Reconstructing historical forest cover change in the
Lower Amazon floodplains using the LandTrendr
algorithm
Everton Hafemann FRAGAL*1, Thiago Sanna Freire SILVA2, Evlyn Márcia Leão de Moraes NOVO1
1 Instituto Nacional de Pesquisas Espaciais, Divisão de Sensoriamento Remoto, Avenida dos Astronautas, 1758, Jardim da Granja. CEP: 12227-010. São José dos Campos, SP,
Brasil.
2 Instituto de Geociências e Ciências Exatas, UNESP - Universidade Estadual Paulista, Campus de Rio Claro, Departamento de Geografia, Av. 24A, 1515. CEP: 13506-900.
Rio Claro, SP, Brasil.
* Autor correspondente: [email protected]
ABSTRACT
The Amazon várzeas are an important component of the Amazon biome, but anthropic and climatic impacts have been leading
to forest loss and interruption of essential ecosystem functions and services. The objectives of this study were to evaluate the capability of the Landsat-based Detection of Trends in Disturbance and Recovery (LandTrendr) algorithm to characterize changes
in várzea forest cover in the Lower Amazon, and to analyze the potential of spectral and temporal attributes to classify forest loss as either natural or anthropogenic. We used a time series of 37 Landsat TM and ETM+ images acquired between 1984 and 2009. We used the LandTrendr algorithm to detect forest cover change and the attributes of “start year”, “magnitude”, and “duration” of the changes, as well as “NDVI at the end of series”. Detection was restricted to areas identified as having forest cover at the start and/or end of the time series. We used the Support Vector Machine (SVM) algorithm to classify the extracted attributes, differentiating between anthropogenic and natural forest loss. Detection reliability was consistently high for change events along the Amazon River channel, but variable for changes within the floodplain. Spectral-temporal trajectories faithfully represented the nature of changes in floodplain forest cover, corroborating field observations. We estimated anthropogenic forest losses to be larger (1.071 ha) than natural losses (884 ha), with a global classification accuracy of 94%. We conclude that the LandTrendr algorithm is a reliable tool for studies of forest dynamics throughout the floodplain.
KEYWORDS: Wetlands, flooded forest, land use change, monitoring, Landsat.
Reconstrução histórica de mudanças na cobertura florestal em várzeas do
Baixo Amazonas utilizando o algoritmo LandTrendr
RESUMO
As várzeas amazônicas são um importante componente do bioma Amazônico, mas impactos antrópicos e climáticos têm levado à perda florestal e à interrupção de processos e serviços ecossistêmicos. O presente estudo teve como objetivos avaliar a aplicabilidade do algoritmo Landsat-based Detection of Trends in Disturbance and Recovery (LandTrendr) na detecção de mudanças na cobertura florestal de várzea no Baixo Amazonas, e analisar o potencial de atributos espectrais e temporais na classificação das perdas florestais em antrópicas ou naturais. Utilizamos uma série temporal de 37 imagens Landsat TM e ETM+, adquiridas entre 1984 e 2009. Aplicamos o algoritmo LandTrendr para detectar mudanças na cobertura florestal e extrair os atributos de “duração”, “magnitude” e “ano de início” das mudanças, além de “NDVI ao final da série”. A detecção se restringiu a áreas identificadas como cobertura florestal no início e/ou final da série. Os atributos derivados da série temporal foram classificados pelo algoritmo Support Vector Machine (SVM), diferenciando as perdas florestais antrópicas e naturais. A confiabilidade da detecção dos eventos de mudança foi consistentemente alta ao longo do rio Amazonas, e mais variável no interior da várzea. As trajetórias espectrais-temporais representaram fielmente os eventos de mudança na cobertura florestal, com base em averiguações em campo. A perda da cobertura florestal por causas antrópicas foi maior (1.071 ha) do que por causas naturais (884 ha), com exatidão global de classificação de 94%. Concluímos que o algoritmo LandTrendr é uma ferramenta confiável para aplicação em estudos de dinâmica da cobertura florestal de várzea.
The river stage height measured at the Óbidos fluviometric station indicates a monomodal hydrological regime. A period of rising water levels extends from December to April, followed by peak flooding with an average water level of 7 meters between May and June. Water levels recede between July and August, followed by a dry period with an average water level of 2 m between September and November (ANA 2014).
Image acquisition and ancillary data
We used a time series of 37 Landsat satellite images that were acquired between 1984 and 2009, path/row 228/061. Thirty-three of these images were recorded by Landsat 5/TM, while the remaining four images were recorded by Landsat 7/ ETM+ (Table 1). We obtained up to two images per year for the months of September–November, corresponding to the low water period of the Amazon River and the season with lowest cloud incidence. The LandTrendr algorithm requires that all images correspond to the same season of each year to minimize variations caused by phenology, flooding, or changes in solar geometry, which could be detected as false cover changes (Kennedy et al. 2010). All images were acquired from
the Landsat Surface Reflectance Climate Data Record (CDR, http://earthexplorer.usgs.gov/). CDR images are corrected for atmospheric interference (surface reflectance) and geometric distortions. They also include cloud and cloud shadow masks, generated using the fmask algorithm (Schmidt et al. 2013). Registration and geolocation errors for CDR products have an expected Root Mean Square Error (RMSE) of 50 meters
(Loveland and Dwyer 2012).
Since no cloud-free images were available for the years 1993, 1996, 2000, 2003, 2006, 2010 and 2011, we excluded these years from the analyses. The LandTrendr algorithm can interpolate data gaps within the time series, provided that the first and last observations of the series are free of clouds or cloud-shadows. Therefore, the time series analyzed in this study ultimately comprised the period between 1984 and 2009. The Amazon River stage height associated with each image was acquired from the Óbidos fluviometric station, operated by the National Water Agency (ANA, http:// hidroweb.ana.gov.br).
Forest cover masks for the years 1984, 2009 and 2013
We separated terra firme (upland) areas from wetland areas according to the flooded areas mask produced by Hess
et al. (2003) and corrected by Ferreira et al. (2013) and Rennó et al. (2013). To reduce processing time and facilitate interpretation of the results, we restricted our analysis to areas where floodplain forest cover was present in either the first or last year of the time series. Digital classification of Landsat/ TM 5 images into “Floodplain forest” and “Non-forest” classes produced binary masks of forest cover for the start
INTRODUCTION
Amazonian floodplain forests provide essential ecosystem functions and services (Wittmann et al. 2010a). The loss of forest cover in the floodplain can interrupt this provision, while gains in forest cover initiate a new cycle of services provided by the forest (Junk et al. 2000). Previous studies have quantified changes in floodplain forest cover by manually producing maps from a small number of images (e.g. Peixoto
et al. 2009). The operationalization of manual methods,
however, demands a large volume of human and financial resources, and temporal analyses with a low frequency of acquisition hinder the discrimination between anthropogenic and natural agents of change. In comparison, semi-automatic methods of detection can be as efficient and less onerous, contributing to current knowledge about forest dynamics in the Amazon floodplain.
The semi-automatic algorithm known as Landsat-based Detection of Trends in Disturbance and Recovery (LandTrendr) is
an operational algorithm developed by Kennedy et al. (2010). LandTrendr fits spectral-temporal trajectories (trajectories of spectral variations over time, Gómes et al. 2014) to each image pixel in an annual time series of Landsat TM and ETM+ images. These trajectories can then be used to identify specific events of forest cover change in space and time (Meigs
et al. 2011). They also provide information on the year of
occurrence, duration, and magnitude of each detected change event, which can aid in identifying the causes of forest loss (Kennedy et al. 2012). Previous studies have proven the efficiency of LandTrendr in the historical reconstruction of change in temperate forests (Meigs et al. 2011; Griffiths et al. 2012), but its applicability to the study of wetland forest dynamics remains to be tested.
The objectives of this study were to 1) evaluate the efficiency of the LandTrendr algorithm in detecting changes in várzea forest cover; 2) determine how accurately the fitted spectral-temporal trajectories reproduce events of forest cover change; and 3) determine if spectral-temporal attributes generated by LandTrendr can aid in the discrimination between anthropogenic and natural causes of forest cover change.
MATERIALS AND METHODS
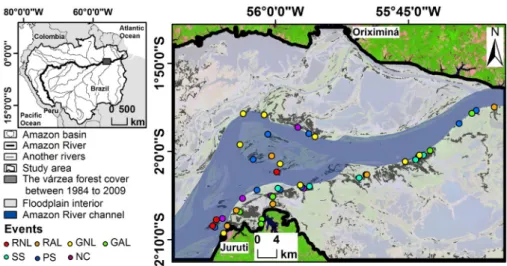
Study area
Table 1. Amazon River stage height measured at the Óbidos fluviometric station (ANA 2014) for each Landsat image acquisition date.
Date Waterlevel (m) Sensor Date Waterlevel (m) Sensor
1984/10/02 6.32 TM 1995/10 /17 4.16 TM
1984/11/19 5.06 TM 1997/10/06 4.44 TM
1985/10/05 6.07 TM 1997/10/22 4.15 TM
1985/10/21 5.47 TM 1999/09/10 5.96 TM
1986/10/08 6.19 TM 1999/10/28 4.97 TM
1986/11/09 6.20 TM 2001/09/23 6.32 ETM+
1987/10/11 4.66 TM 2001/10/25 4.50 ETM+
1987/11/12 4.25 TM 2002/09/26 7.14 ETM+
1988/09/11 6.85 TM 2002/10/28 4.74 ETM+
1988/10/13 5.58 TM 2004/10/09 5.69 TM
1989/09/14 8.25 TM 2004/11/10 4.89 TM
1990/10/03 5.81 TM 2005/09/10 5.60 TM
1900/11/04 4.20 TM 2005/09/26 4.44 TM
1991/09/04 8.02 TM 2007/09/16 6.71 TM
1991/0920 6.92 TM 2007/10/02 5.47 TM
1992/0906 5.58 TM 2008/09/02 7.88 TM
1992/09/22 5.13 TM 2009/10/07 6.40 TM
1994/09/28 7.42 TM 2009/10/23 5.02 TM
1994/10/14 6.53 TM
(10/2/1984 and 11/19/1984) and end periods (10/7/2009 and 10/23/2009). We also used Landsat 8/OLI images (28/06/2013 and 15/08/2013) to produce an additional forest cover mask for 2013. We used this mask to identify the present distribution of floodplain forest in the study region and restrict field data acquisition to areas without forest cover change between 2009 and 2013. The use of two images for each mapped year maximized the number of cloud-free pixels available for mapping.
We classified forest cover using the Random Forests
algorithm (RF), implemented in the “randomforest” package of the statistical software R (Liaw and Wiener 2002). Automatic classification was followed by manual editing to achieve maximum accuracy. We tested different combinations of the algorithm parameters, identifying ntree = 100 (number of decision trees generated) and mtry = 7 (number of variables considered randomly in each node to determine class separation) as optimal values. We then validated the forest cover masks using Global Accuracy and Kappa Index measures (Congalton 1991). We randomly selected 100 points from each forest cover mask and classified these points by visual interpretation of the Landsat images as well as high-resolution images provided by Google Maps™ and Nokia Here™. The interpreter had no knowledge of the algorithm classification result for each validation point prior to interpretation, avoiding bias.
We then intersected the first two forest cover masks to produce three new layers: 1) forest cover loss between 1984 and 2009 (loss = forest removal followed by a different land use); 2) forest cover gain between 1984 and 2009 (gain = primary or secondary forest succession); and 3) unchanged forest cover between 1984 and 2009. After intersection, areas with less than 8100 m2 (< 9 pixels) were eliminated, as spectral
mixing prevents reliable characterization of forest change in small areas (Ponzoni and Shimabukuro 2007). In the present study, primary succession refers to the establishment of forest cover in an area occupied by a different cover type in 1984 (e.g. recently deposited fluvial areas); secondary succession refers to the regeneration of forest cover that was observed in 1984 but was lost sometime during the studied period.
The LandTrendr algorithm
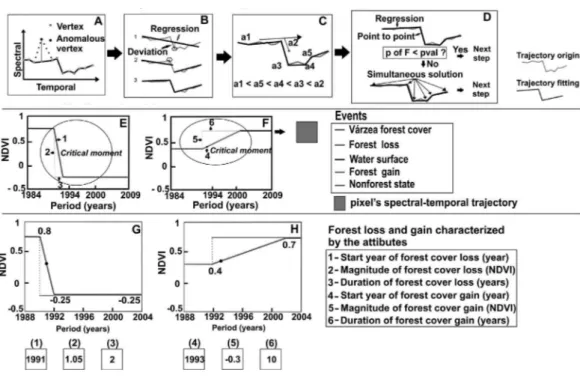
We generated the spectral-temporal trajectories using the LandTrendr algorithm, which is freely available at http:// landtrendr.forestry.oregonstate.edu. The algorithm allows for pixel-by-pixel temporal segmentation of a series of images, generating simplified spectral-temporal trajectories. Trajectory construction is based on the following steps (Figures 2A to 2D): A) removing anomalous vertices caused by clouds or cloud-shadows; B) defining the maximum number of segments for trajectory construction; C) simplifying the initial spectral-temporal trajectory by the removal of segments
with the smallest angles, if necessary; and D) evaluating the differences between the simplified spectral-temporal trajectory in relation to the original trajectory.
To achieve the best possible results, we tested different combinations of algorithm parameter values (Fragal 2015). The optimal values were: 1) maximum number of segments = 6; 2) p-value for the fitted trajectory = 0.05; and 3) spectral index = Normalized Difference Vegetation Index (NDVI, Rouse et al. 1973). NDVI values range from -1 to 1, with values close to -1 representing water bodies, values above 0.3 indicating vegetation cover, and values closer to 1 indicating greater vegetation biomass. To minimize the effect of radiometric variation and registration error between images, we used the average value of a 3 x 3-pixel window to calculate the spectral index values used to fit each spectral-temporal trajectory.
Each segment of the spectral-temporal trajectory is referred to as an “event”, expressing what happened to forest cover during each time interval (Figure 2E and 2F). The
critical moment of the trajectory corresponds to the segment
that expresses an event of forest cover change (loss or gain). After detecting all critical moments in each spectral-temporal trajectory, the LandTrendr algorithm can derive attributes characterizing each forest change event, which are recorded in the form of new images (Figure 2G and 2H). The duration
attribute shows the elapsed time from the start to the end of the critical moment; magnitude expresses the range of variation in NDVI values across the critical moment (higher magnitudes indicate more severe forest losses on larger gains); and start year
expresses the year when the loss/gain event was first detected. The results obtained from LandTrendr depend on three main algorithm parameters: pct_veg_loss, pct_veg_loss20, and pct_veg_gain, which define the minimum amount of variation that should be considered as a critical moment. Pct_veg_loss1
is the minimum reduction in the spectral index value between two consecutive years that should be considered as forest cover change. Pct_veg_loss20 has the same interpretation, but applies to a period of 20 or more years. Pct_veg_gain establishes the minimum increase in the spectral index value over four or more years that should be considered as forest cover gain. The combination of these three parameters determines the resulting detection of forest loss and gain events, from which the duration, magnitude and start year attributes are then derived.
Characterization of changes in forest cover
Since the probability of detecting a forest change event varies as a function of spectral index variability, we tested five different sets of values for pct_veg_loss1, pct_veg_loss20 and
0.05; 0.1), C2 = (0.2; 0.1; 0.15), C3 = (0.25; 0.125; 0.2), C4 = (0.3; 0.15; 0.25), and C5 = (0.35; 0.2; 0.3). The first set is sensitive to small spectral variations (least restrictive detection), and the last set is sensitive only to large spectral variations (most restrictive detection).
From each set of parameters, we generated five binary change detection maps, where pixel value 1 indicated the detection of changes in forest cover, and value 0 indicated no detection. For each pixel, we estimated a detection confidence index based on the normalized sum of all five detection maps. Resulting pixel values varied from 0 (no change detected regardless of parameterization) to 1 (change detected by all five parameterizations).
After change detection, we produced images of duration, magnitude and start year attributes from each set of parameters. Pixels without detected changes were filled with a “no data” value in each attribute image. Then, we combined images derived from all five parameter sets by maximizing the confidence for each pixel. First, we took the attribute image based on the most restrictive parameter set (C5, highest reliability). Then, we added to this image all additional pixels detected in the next corresponding attribute image (produced by the second most restrictive set, C4) that were not already detected using C5. We repeated this process incrementally for
additional pixels detected by C3, C2 and C1 parameterizations, obtaininga single attribute image including all pixels with a confidence index > 0.
Association of spectral-temporal trajectories to forest change events
Specific forms of the spectral-temporal trajectories were compared to specific histories of forest cover change to verify how accurately these trajectories expressed the observed changes in floodplain forest. Based on a visual analysis of the Landsat time series, we defined the following possible change events: RNL – Rapid forest cover loss succeeded by another land cover, caused by natural agents; RAL – Rapid forest cover loss succeeded by another land cover, caused by anthropogenic agents; GNL – Gradual forest cover loss succeeded by another land cover, caused by natural agents; GAL – Gradual forest cover loss succeeded by another land cover, caused by anthropogenic agents; PS – Primary succession (gain of forest cover in areas mapped as “non-forest” in 1984); SS – Secondary succession (recovery of forest cover following a loss event observed after 1984); and NC – No change in forest cover between 1984 and 2009.
We then validated how accurately each of the described events above corresponded to observed forest dynamics, using ground truth information. We conducted field sampling during the dry
season between 25/09/2014 and 06/10/2014. We used two sources of information: 1) georeferenced photos of current land cover from sampling sites where the spectral-temporal trajectories indicated forest cover loss; and 2) forest inventory data from sampling sites where trajectories indicated primary succession, secondary succession, or no change in forest cover between 1984 and 2009. We visited 43 sampling sites, comprising 18 sites with forest inventories and 25 sites with georeferenced photos showing current land cover after forest loss (Figure 1).
Forest inventories were based on 25 x 25 m plots. In each plot, we acquired a) diameter at breast height (DBH), b) total height, c) number of individual trees, and d) tree species identification with the aid of a professional parabotanist. DBH was measured at 1.3 m from ground level, and total height was measured from the base of the tree at ground level to the top of the crown. We sampled only those individuals with DBH ≥ 10 cm. Density of individuals (ind. ha-1) and basal area (m2 ha-1) were then calculated
from this dataset.
Forest structure and species composition recorded for PS, SS, and NC plots were used to estimate the forest successional stages. According to Wittmann et al. (2010b), we defined the following
successional stages: 1) Early succession = pioneer species found in recently deposited substrates or clearings, with a maximum age of 20 to 30 years; 2) Intermediate succession = species that are established after the initial stage, with maximum age of 20 to 150 years; and 3) Late succession = species only found at latter succession stages, reaching ages of more than 150 years.
Discrimination between anthropogenic and natural causes of floodplain forest loss
We considered only events detected with high confidence levels (0.8 to 1.0) when discriminating between anthropogenic and natural causes of forest cover loss, to minimize the inclusion of false losses detected due to the inherent variability of floodplain forests. The attributes selected for discrimination included two of the three attributes estimated by LandTrendr (duration and magnitude), as well as the NDVI value recorded at the last year of the analyzed time series (2009). Our rationale for this selection was that anthropogenic forest loss involves removal through direct human action (e.g. chainsaw and/or axe) followed by a different land use or abandonment, which results in smaller reductions in NDVI values (smaller magnitude), shorter durations of removal events, and final NDVI values greater than zero (exposed soil, undergrowth or secondary succession). On the other hand, natural causes consist primarily of forest removal due to fluvial dynamics, where forested areas are converted to open water surfaces. In this case, we expect a severe reduction of NDVI values (large magnitude), a longer duration of the loss event (fluvial erosion) and no recovery of NDVI values at the end of the series (values below zero).
We evaluated the potential of each attribute to discriminate the causes of forest loss by plotting samples of 1000 pixels from areas previously identified as having undergone natural or anthropogenic changes. The attributes that had the best discriminatory potential were submitted to the Support Vector Machine (SVM) classification algorithm, which is particularly
suitable for detecting boundaries between two classes (Webb 2002). We assessed the discrimination accuracy through the cross-validation method, where half of the pixels of each class is used to train the SVM algorithm, and the other half is used to validate the classification, repeating the process a second time with inverted datasets. Two confusion matrices were produced, and the global accuracy of the classification was calculated for each matrix.
RESULTS
Changes in forest cover between 1984 and 2009
Forest cover classifications were accurate, with Kappa indexes of 0.97, 0.96 and 0.96 for 1984, 2009 and 2013, respectively, and global accuracy of 98% for all years. The intersection between the forest cover masks of 1984 and 2009 indicated a loss of 5,420 ha of floodplain forests and a gain of 3,805 ha, with 9,154 ha of forest cover showing no change during this period.
Historical reconstruction of annual forest change
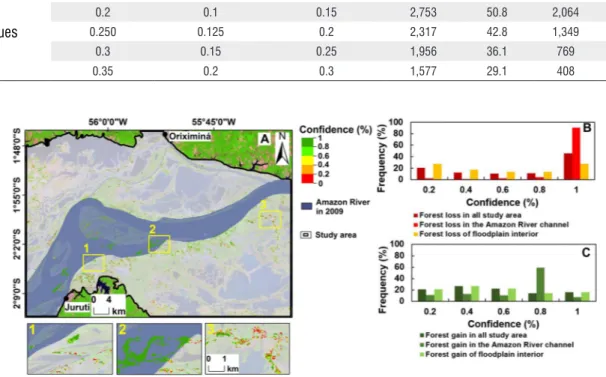
Increasing values of the parameters pct_veg_loss1, ptc_veg_ loss20 and pct_veg_gain led to decreasing numbers of pixels being detected as forest cover change and, consequently, to a decrease in the total area for which duration, magnitude and start year attributes were derived (Table 2). Areas in the interior of the floodplain had lower confidence indexes (Figure 3A), while areas along the Amazon River channel showed higher confidence (between 0.8 and 1) for events of loss (97%) and gain (65%) (Figure 3B and 3C).
Table 2. Change detection rates for different parameterizations of pct_veg_loss1, pct_veg_loss20 and pct_veg_gain. Percentageswere calculated basedon the total area of forest loss and forest gain, derived from the intersection of forest cover maps from 1984 and 2009.Pct_veg_loss1 is the minimum reduction in the spectral index value between two consecutive years that indicates forest cover change. Pct_veg_loss20 has the same interpretation, but considers longer periods (20 or more years). Pct_veg_gain establishes the minimum increase in spectral index value over four or more years that indicates forest cover gain.
Parameter Loss Gain
pct_veg_loss1 pct_veg_loss20 pct_veg_gain Area (ha) Area (%) Area (ha) Area (%)
Values
0.1 0.05 0.1 3,452 63.7 2,632 69.2
0.2 0.1 0.15 2,753 50.8 2,064 54.2
0.250 0.125 0.2 2,317 42.8 1,349 35.6
0.3 0.15 0.25 1,956 36.1 769 20.2
0.35 0.2 0.3 1,577 29.1 408 10.7
Figure 3. Confidence index for thedetection of forest cover change. A) Map of confidence indexes for forest loss and forest gain; B and C) frequency distribution of confidence index values for forest loss and forest gain, respectively. (This figure is in color in the electronic version).
Validation of detected changes in floodplain forests
For forest loss events, rapid or gradual loss caused by natural agents (RNL and GNL, Figure 5) occurred at distinct moments of the time series and were always followed by the same cover type (water body), which we confirmed at the field sites. Likewise, the presence of pasture areas characterized all field sites corresponding to rapid or gradual forest loss caused by anthropogenic agents (RAL and GAL, Figure 5).
In secondary succession (SS) sites, clusters of small individuals were frequent, forming thickets within the plot (Figure 5). Primary succession (PS) sites were characterized by trees more widely spaced than in SS sites (Figure 5), and sites corresponding to no forest cover change between 1984 and 2009 (NC) were characterized by trees with larger diameters and a well-spaced spatial distribution (approximately 2 m) of individuals (Figure 5).
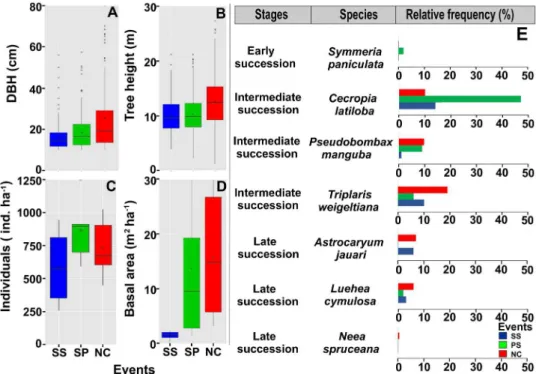
Sites corresponding to SS events had smaller median values of DBH, total height, basal area and density of individuals
compared to PS and NC sites (Figures 6A, 6B, 6C and 6D). Sites identified as PS events had larger median values of DBH, total height and basal area than SS sites, but smaller median DBH values and a higher density of individuals than NC sites. Sites corresponding to NC events had the largest median values of DBH, total height, and basal area, as well as the lowest densities of individuals. In general, the forest structure recorded for the three types of events matched the expected structure of the successional stages resulting from these events, validating the reliability of LandTrendr to detect forest cover changes.
The occurrence of indicator species of different successional stages (Figure 6E) also had a strong association with the type of event detected. PS and SS events were associated with the occurrence of species related to early and intermediate successional stages, except Triplaris weigeltiana. Late
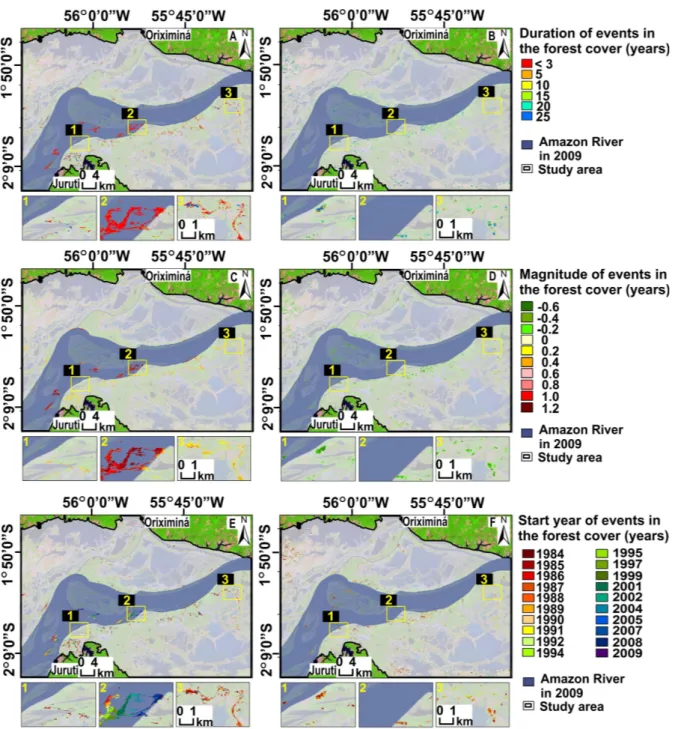
Figure 4. Maps of duration, magnitude and start year attributes for forest change events. A and B) Duration of forest loss and forest gain events, respectively; C and D) Magnitude of forest cover loss and forest gain events, respectively; E and F) Start year for forest cover loss and forest gain events, respectively. Background: Landsat TM from 23 October 2009 R5, G4, B3. (This figure is in color in the electronic version).
Discrimination between anthropogenic and natural causes of forest loss
The attributes of “magnitude of loss” and “NDVI value at the end of the series” had the greatest potential to discriminate between anthropogenic and natural causes of forest loss. The “duration of forest loss” attribute had less discriminatory potential, as both causes can have
either short (e.g. clear cutting vs. bank erosion) or long (subsistence agriculture vs. marginal erosion) durations.
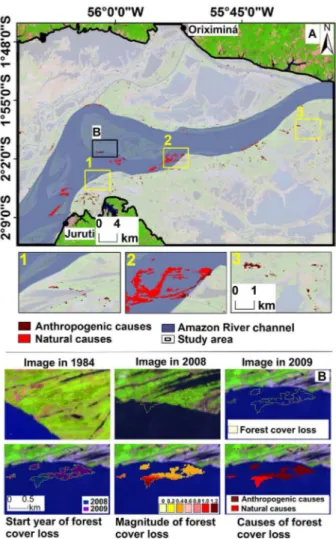
labeled as anthropogenic was observed for areas of recent erosion along the Amazon River channel (Figure 7B).
DISCUSSION
Even when using the least restrictive parameters, the LandTrendr algorithm failed to detect 34% of total forest loss and 31% of total forest gain (as originally mapped by the loss and gain masks). Most of these changes were undetected due to the inherent variability of Amazon floodplain forests, which are reflected by NDVI variations over time. For future
studies of these ecosystems, we recommend investigating the formulation of new vegetation indexes that are less susceptible to this natural variability.
The majority of omission errors in change detection occurred in the interior areas of the floodplain. The LandTrendr algorithm was particularly efficient in detecting and characterizing forest dynamics associated with fluvial erosion and sedimentation. Thus, we believe the LandTrendr algorithm could be applied to reconstruct forest changes along the entire Solimões-Amazon River channel (2750 km Figure 5. Field validation of the association between spectral-temporal trajectories and actual histories of forest cover change. RNL) Rapid Loss of várzea forest cover followed of other land cover, caused by Natural agents; RNL) Rapid Loss of forest cover followed by other land cover, caused by Natural agents; RAL)
Rapid Loss of forest cover followed by other land cover, caused by Anthropogenic agents; GNL) Gradual Loss of forest cover followed by other land cover, caused by Natural agents; GAL) Gradual Loss of forest cover followed by other land cover, caused by Anthropogenic agents; SS) Secondary Succession; PS)
from Iquitos to Óbidos) and major tributaries, which would be a very time consuming task if based on manual mapping methods.
Loss events of short duration were related to fast, natural processes or anthropogenic actions, such as fluvial erosion and clear-cut deforestation, respectively (WinklerPrins 2006). Loss events with longer durations were associated with elevated resistance to fluvial erosion (Kalliola et al. 1992). We also observed long durations for forest gain events, as primary or secondary succession normally takes place over several decades (Worbes 1997). Forest loss (Figure 4C) with NDVI reductions between 0.6 and 1.2 in magnitude indicated the conversion of forest cover to free water surfaces. This severe reduction was also observed for stretches of the Eastern and Central sectors of the Amazon River (Kalliola et al. 1992; Peixoto et al. 2009; Salo et al. 1986). The magnitudes of NDVI gain indicated
succession stages, with values between -0.1 and -0.4 indicating younger forests and values between -0.41 and -0.6 indicating older forests. These results suggest that our method could be effectively applied to estimate forest stand age in floodplain forests, offering important support to carbon and biodiversity studies and forest management activities.
Forest loss events were most frequently detected during the late 1980s, coinciding with an increase in cattle and buffalo herding in the Lower Amazon floodplain (McGrath
et al. 1993). Since the 1990s, most grazing areas appear to
have been consolidated, leading to decreased forest loss in subsequent years. Forest gain events were also most frequent in the late 1980s, being less observed in the remainder of the time series. This reduction could be explained by 1) pasture areas that have never been abandoned or converted to subsistence agriculture (McGrath et al. 2007); 2) high erosion rates in the Amazon River during the 1990s and 2000s, preventing primary succession (Gloor et al. 2013); and/or 3) increases
in the duration of flooding since the 2000s, hindering the establishment of primary or secondary succession (Gloor et al. 2013).
Regarding the indicator species of forest succession stages, the species Triplaris weigeltiana (Figure 6E) was most frequent in sites associated with no forest cover change between 1984 and 2009. As this species is characteristic of secondary succession in forests (Wittmann et al. 2010b),
this observation suggests that many of these areas may have suffered alterations in the decades prior to 1984. Conversely, species usuallyassociated withlater successional stages, such as Astrocaryum jauari and Luehea cymulosa, were frequent in secondary succession sites, supporting the hypothesis that large seed banks can allow forest regeneration with late successional species (D’Oliveira 1989).
Figure 7. Discrimination of natural or anthropogenic causes of forest cover loss. A) map of natural and anthropogenic forest cover loss; B) mapping accuracy. (This figure is in color in the electronic version).
NDVI reduction was similar for natural forest losses occurred in 2009 and losses caused by anthropogenic agents, explaining the observed systematic error of labeling recent natural disturbance areas as anthropogenic. Future research should consider additional attributes (e.g. average NDVI values along the temporal series) to improve the discrimination between natural and anthropogenic causes occurring towards the end of the time series.
CONCLUSIONS
We conclude that the LandTrendr algorithm can reliably detect changes in várzea forest cover, and the spectral-temporal trajectories and derived attributes can faithfully reproduce events of forest cover change. The highest detection reliability was observed in regions adjacent to the Amazon River channel. Furthermore, a combination of the “magnitude of forest loss” and “NDVI values at the end of the series” attributes
was able to discriminate between anthropogenic and natural causes of forest loss (average global accuracy of 94%), except for losses occurring during the last year of the time series. We expect LandTrendr to be applicable to a variety of floodplain ecosystem studies. This method could be used to improve estimates of carbon stocks and emissions by estimating forest stand age, to evaluate the protection efficiency of várzea
conservation areas, to provide explanatory variables to diversity and species distribution models in floodplain landscapes, and to explore the relationship between forest change and the socio-economic activities of local human populations.
ACKNOWLEDGMENTS
We thank Coordination for the Improvement of Higher Education Personnel (CAPES) for the scholarship awarded to EH Fragal in the Graduate Program in Remote Sensing of the National Institute for Space Research. Field data collection was partially funded by the São Paulo Research Foundation (FAPESP), grant 2011/23594-8. TSF Silva received postdoctoral support from FAPESP during part of the study (grant 2010/11269-2).
REFERENCES
Agência Nacional de Águas (ANA), 2014. HidroWeb: Sistema de
Informações Hidrológicas. (http://hidroweb.ana.gov.br/). Acesso
em 09/01/2014.
Congalton, R.G. 1991. A review of assessing the accuracy of
classifications of remotely sensed data. Remote Sensing of
Environment, 49: 1671-1678.
D’Oliveira, M.V.N. 1989. Regeneração natural de uma floresta de
várzea explorada por método tradicional, no Paraná Abufarí no
médio rio Purus. Dissertação de Mestrado, Instituto Nacional
de Pesquisas da Amazônia, Manaus, Amazonas. 75 p.
Ferreira, R.D.; Leão, J.A.D.; Silva, T.S.F.; Rennó, C.D.; Novo, E.M.L.M.; Barbosa, C.C.F. 2013. Atualização e correção do
delineamento de áreas alagáveis da bacia Amazônica. Simpósio
Brasileiro de Sensoriamento Remoto (SBSR), 16: 5864-5871
(http://www.dsr.inpe.br/sbsr2013/files/p1171.pdf). Acesso em 05/02/2014.
Fragal, E.H. 2015. Reconstrução histórica de mudanças na cobertura
florestal em várzeas do baixo Amazonas utilizando o algoritmo
LandTrendr.. Dissertação de Mestrado, Instituto Nacional de
Pesquisas Espaciais, São José dos Campos, São Paulo, 121 p. Gloor, M.; Brienen, R.J.W.; Galbraith, D.; Feldpausch, T.R.;
Schöngart, J.; Guyot, J.L.; Espinoza, J.C.; Lioyd, J.; Phillips, O.L. 2013. Intensification of the Amazon hydrological cycle
over the last two decades. Geophysical Research Letters, 40: 1-5.
Gómez, C.; White, J.C.; Wulder, M.A.; Alejandro, P. 2014. Historical forest biomass dynamics modelled with Landsat
spectral trajectories. Journal of Photogrammetry and Remote
Griffiths, P.; Kuemmerle, T.; Kennedy, R.E.; Abrudan, I.V.; Knorn, J.; Hostert, P. 2012. Using annual time-series of Landsat images to assess the effects of forest restitution in post-socialist Romania.
Remote Sensing of Environment, 118: 199-214.
Hess, L.L.; Melack, J.M.; Novo, E.M.L.M.; Barbosa, C.C.F.; Gastil, M. 2003. Dual-season mapping of wetland inundation
and vegetation for the central Amazon basin. Remote Sensing of
Environment, 87: 404-428.
Junk, W.J.; Ohly, J.J.; Piedade, M.T.F.; Soares, M.G.M. 2000.
The Central Amazon floodplain: actual use and options for a
sustainable management. 1 ed. Leiden: Backhuys Publishers, The
Netherlands, 584p.
Kalliola, R.; Salo, J.; Puhakka, M.; Rajasilta, M.; Häme, T.; Neller, R.J.; Räsänen, M.E.; Danjoy Arias, W.A. 1992. Upper Amazon
Channel Migration, Naturwissenschaften, 79: 75-79.
Kennedy, R.E.; Yang, Z.; Cohen, W.B. 2010. Detecting trends in forest disturbance and recovery using yearly Landsat time series:
1. LandTrendr - Temporal segmentation algorithms. Remote
Sensing of Environment, 114: 2897–2910.
Kennedy, R.E.; Yang, Z.; Cohen, W.B.; Pfaff, E.; Braaten, J.; Nelson, P. 2012. Spatial and temporal patterns of forest disturbance and
regrowth within the area of the Northwest Forest Plan. Remote
Sensing of Environment, 122: 117–133.
Liaw A.; Wierner, M. 2002. Classification and regression by Random
Forest. News, 2: 18-22.
Loveland T.R.; Dwyer J.L. 2012. Landsat: Building a strong future.
Remote Sensing of Environment, 122: 22–29.
McGrath, D.; Castro, F.; Futemma, C.; Amaral, B.; Calabria, J. 1993. Fisheries and the evolution of resource management on
the Lower Amazon floodplain. Human Ecology, 21: 167–195.
McGrath, D.; Almeida, O.; Merry, F.D. 2007. The Influence of Community Management Agreements on Household Economic Strategies: Cattle Grazing and Fishing Agreements on the Lower
Amazon Floodplain. International Journal of the Commons, 1:
67-87.
Meigs, G.W.; Kennedy, R.E.; Cohen, W.B. 2011. A Landsat time series approach to characterize bark beetle and defoliator impacts
on tree mortality and surface fuels in conifer forests. Remote
Sensing of Environment, 115: 3707–3718.
Peixoto, J.M.A.; Nelson, B.W.; Wittmann, F. 2009. Spatial and temporal dynamics of river channel migration and vegetation in central Amazonian white-water floodplains by remote-sensing
techniques. Remote Sensing of Environment, 113: 2258–2266.
Ponzoni, F.J.; Shimabukuro, Y.E. 2007. Sensoriamento Remoto no
Estudo da Vegetação. 1 ed. Parêntese, São José dos Campos, 144p.
Rennó, C.D.; Novo, E.M.L.M.; Banon, L.C., 2013. Correção geométrica da máscara de áreas alagáveis da bacia amazônica.
Simpósio Brasileiro de Sensoriamento Remoto (SBSR), 16:
5507-5514 (http://www.dsr.inpe.br/sbsr2013/files/p1166.pdf). Acesso em 05/02/2014.
Renó V.F.; Novo, E.M.L.M.; Suemitsu, C.; Rennó, C.D.; Silva, T.S.F. 2011. Assessment of deforestation in the Lower Amazon
floodplain using historical Landsat MSS/TM imagery. Remote
Sensing of Environment, 115: 3446–3456.
Rouse, J.W; Haas, R.H; Schell, J.A; Deering, D.W. 1973.
Monitoring vegetation systems in the great plains with ERTS.
Earth Resources Technology Satellite, 1: 309-317.
Salo, J.; Kalliola, R.; Häkkinen, I.; Mäkinen, Y; Niemelä, P.; Puhakka, M.; Coley, P.D. 1986. River dynamics and the diversity of
Amazon lowland forest. Nature, 322: 254-258.
Schmidt, G.; Jenkerson, C.; Masek, J.; Vermote. E. Gao, F., 2013.
Landsat Ecosystem Disturbance Adaptive Processing System
(LEDAPS) Algorithm Description. (http://pubs.usgs.gov/
of/2013/1057/). Acesso em 20/11/2013.
Webb, A. 2002. Statistical Pattern Recognition. 2 ed. [S.l.]: Wiley,
New York, 496p.
WinklerPrins, A.M.G.A. 2006. Jute cultivation in the lower Amazon, 1940-1990: an ethnographic account from Santarém, Pará,
Brasil. Journal of Historical Geography, 32: 818-838.
Wittmann, F.; Schöngart, J.; Junk, W.J.2010a.Phytogeography,
species diversity, community structure and dynamics of Amazonian floodplain forests. In: Junk, W.J.; Piedade, M.T.F.;
Wittmann, F.; Schöngart, J.; Parolin, P. (Ed.). Amazonian
floodplain forests: ecophysiology, biodiversity and sustainable
management. Springer Verlag, Berlin, p.61-102.
Wittmann, F.; Schöngart, J. Wittmann, A.O.; Piedade, M.T.F.;
Parolin, P.; Junk, W.J.; Guillaumet, J.L. 2010b. Manual de árvores
de várzea da Amazônia Central: taxonomia, ecologia e uso. 1 ed.
Instituto Nacional de Pesquisas da Amazônia, Manaus, 298p. Worbes, M. 1997. The Forest Ecosystem of the floodplain. In: Junk,
W.J. (Ed.).The central Amazon floodplain: ecology of a pulsing
system. Springer Verlag, Berlin, p.223-265.