www.scielo.br/rbg
CRUSTAL SINKING AND THE SEA LEVEL AT CANAN´EIA, SP, BRAZIL
Cristiano de Salles Almeida
1, Andr´e Ribeiro Lopes da Silva
2,
Mauro Sznelwar
2and Afrˆanio Rubens de Mesquita
2ABSTRACT.In this study, of tidal data of Canan´eia, Brazil (Lat: 25◦01,0’ S and Long: 47◦55,5’ W), the following components were identified: 1) astronomical, defined by the tide generating potential; 2) nonlinear tidal dissipative components; 3) radiational, defined by the Sun light on the oceans; and 4) the polar geophysical component. The residual components of the sea level, resulting from filtering the above variables, are called “meteorological tides” (MT). This tidal data, after filtering its values, that include the decadal and intradecadal components, leads to the Long Term (LT) sea level values. Other measurements related to the LT sea level indicated the occurrence of: 5) the variation, due to the sinking of the crust; and 6) a constant rise in the LT sea level. Besides, the LT sea level trend also has components due to: 7) the eustatic variation; 8) the halosteric variation; and 9) the steric variation. The LT sea level trend component in Canan´eia is estimated as: a1= 5.66 mm/year. While the vertical trend values of GPS is a2= –3.8± 01.1 mm/year, indicating that the sea level rise in Canan´eia is mostly due to the sinking of the crust in the region. The real value of the sea level variation corresponds to the difference between a1and a2, which is an increase of a3= 1.8 mm/year. This trend value is the sum of the eustatic, halosteric and steric components and all of them seem to be consequences of the global warming.
Keywords: mean sea level, crustal variation, eustatic variation, steric variation, halosteric variation.
RESUMO.Nesta an´alise do n´ıvel do mar de Canan´eia, Brasil (Lat: 25◦01,0’ S e Long: 47◦55,5’ W), foram identificadas as seguintes componentes: 1) astronˆomicas, definidas no potencial gerador de mar´es; 2) dissipativas da energia das mar´es; 3) radiacionais da radiac¸˜ao solar; e 4) a componente geof´ısica da mar´e polar. As componentes residuais, resultantes da filtragem das vari´aveis acima, dos registros de n´ıvel do mar, s˜ao conhecidas como “mar´e meteorol´ogica” (MM). Essa mar´e d´a origem, filtrando-se os valores da MM, que incluem as componentes decadais e intradecadais, `a determinac¸˜ao da variac¸˜ao de longo termo (LT) do n´ıvel do mar. Al´em dessas componentes peri´odicas, foi determinada, atrav´es de medic¸˜oes de GPS, a ocorrˆencia 5) da variac¸˜ao, devido ao afundamento da crosta; e 6) de um constante aumento do n´ıvel do mar de LT. Esse aumento, por sua vez, tem tamb´em componentes: 7) devido `a variac¸˜ao eust´atica; 8) devido `a variac¸˜ao halost´erica; e 9) devido `a variac¸˜ao est´erica. O valor da tendˆencia de LT do n´ıvel do mar em Canan´eia, que engloba as trˆes componentes acima, ´e de a1= 5,66 mm/ano. A tendˆencia dos valores verticais de GPS ´e de a2= –3,8± 01,1 mm/ano, indicando que o aumento do n´ıvel m´edio relativo do mar de Canan´eia ´e devido, em grande parte, ao afundamento da crosta na regi˜ao. O valor real da variac¸˜ao do n´ıvel do mar corresponde `a diferenc¸a entre a1e a2que ´e igual a a3= 1,8 mm/ano, valor esse que corresponde `a soma das componentes eust´atica, halost´erica e est´erica, parecendo serem todas elas decorrentes do aquecimento global.
Palavras-chave: n´ıvel m´edio do mar, variac¸˜ao da crosta, variac¸˜ao eust´atica, variac¸˜ao est´erica, variac¸˜ao halost´erica.
1Universidade de S˜ao Paulo, Instituto Oceanogr´afico, Prac¸a do Oceanogr´afico, 191, Cidade Universit´aria, Butant˜a, Laborat´orio de Ecotoxicologia Marinha e Microfito-bentos, sala 141A/B. 05508-120 S˜ao Paulo, SP, Brazil. Phone: +55(11) 3091-6572 – E-mail: [email protected]
2Universidade de S˜ao Paulo, Instituto Oceanogr´afico, Prac¸a do Oceanogr´afico, 191, Cidade Universit´aria, Butant˜a, Laborat´orio de Mar´es e Processos Temporais Oceˆanicos, sala 204A. 05508-120 S˜ao Paulo, SP, Brazil. Phone: +55(11) 3091-6648 – E-mails: [email protected]; [email protected]; [email protected]
i i
“main” — 2017/12/19 — 15:23 — page 6 — #2
i i
6
CRUSTAL SINKING AND MEAN SEA LEVEL AT CANAN´EIA INTRODUCTIONThe oceans constitute a water lamina with an average depth of 4 km along the Earth radius, which is around 6400 km, becom-ing then a thin lamina in relation to the Earth radius. Nevertheless, this lamina is responsible for the climate regulation. Among other more important phenomena under the influence of the complex relations between oceans and climate, there are the variations of the relative mean sea level (Mesquita, 2009).
The expansion of the oceans is one of the most feared effects of the global warming. However, despite proving that the seawater level is rising in many regions, including the Brazilian coast, the predictions about the variations of the relative mean sea level in a worldwide scale are one of the biggest controversies of contem-porary science (Mesquita, 2009).
To establish the variations of decadal (10 years) and in-tradecadal (from 2 to 7 years) periods, it is required to have spec-tral analyses, similar to the ones recently made from global data of the ocean temperature by Munk (2002). For this, in the southeast region of Brazil, the acquirement of annual measurements of tem-perature and salinity (in a sistematic way, that is, in time series) is necessary, in order to obtain a perspective of the oceanic variation in decadal and intradecadal scales, as well as a perspective of the LT eustatic, halosteric and steric components of the relative mean sea level of Canan´eia.
The data series collected (up to 2012) in the Brazilian coast comprise relatively short measurement periods. In general, less than 60 years. Although being difficult to get an accurate estimate of the average global rise of sea level, the recent analyses based on longer series, like the Brest record, in France, over 120 years, and the analysis in San Francisco, USA, over 110 years, consid-ered more stable and reliable, predict a relative mean sea level rise of 1.8 mm/year, that is, 18 mm/century (Mesquita et al., 2013).
Also, it is required to consider that, besides being different from those estimatives in many places, the sea level variation is also relentlessly negative. That is to say, in many other oceanic regions, a clear sea level sinking is occurring, demonstrating the enigma exposed by Munk (2002) and after by Mesquita et al. (2013).
The Munk (2002) estimative, based on global oceanic data of temperature between 1960 and 2000, indicated that decadal and intradecadal variations in the global values of seawater tempera-ture took place in this period. Also, it occurred an increase close to 2× 10²³ joules of the heat content stored in the 0 to 3,000
meter oceanic layer, with a variation ratio of 5× 10²¹joules by
year, due to the greenhouse effect. In this same period there was a temperature increase around 0.10◦C in the 0 to 500 meters depth and, as a consequence, there was a mean increase of 3 cm of the steric level.
In this work a LT study was developed about the data of the sea level of Canan´eia, filtering the decadal and intradecadal varia-tions. However, the estimative of the LT variation ratio of the fresh water volume added in the sea (eustatic variation), caused by the melting of glaciers, due to the global warming (Mesquita, 2009), was not developed. This study can be a contribution of the South Atlantic to solve the enigma pointed out by Munk (2002) in rela-tion to the global variarela-tion of the relative mean sea level.
MATERIAL AND METHODS
For this analysis, 50.5 years of sea level data (from 1954 up to 2005) were used to develop comparisons with 30 month data of vertical displacement of the Canan´eia GPS station. The sea level data were acquired since 1954 by means of the OTT tide gauge in continuous series at GLOSS (Global Sea Level Observing System) station, number 194, in Canan´eia city, and the GPS (Global Po-sitioning System) vertical measurements, at SIRGAS (Sistema de Referˆencia Geocˆentrico para as Am´ericas) station, were provided by IBGE (Instituto Brasileiro de Geografia e Estat´ıstica). The GPS data processing was carried out following international standards, using the GNSS (Global Navigation Satellite System) service, IGS (International GNSS Service) and the ITRF – 2000 (International Terrestrial Reference Frame) accurate coordinate system from any point of the planet, which can be seen in the Geoscience Australia website (AGGA, 2012), according to Abreu et al. (2006).
The calculus of the LT variations of the mean sea level requires the estimative of all tide components that derive from the tide generating potential: dissipative components of tidal energy (shallow depth components), radiation tides, as well as other oceanographic, meteorological and geophysical components, like the polar and the meteorological tides. After the identification of these components, a filtering was carried out to produce LT data for this analysis.
The resulting series of this process is constituted by the eu-static, halosteric and steric components of the region. With the measurements of temperature and salinity of oceanographic ses-sion, in the proposal to be submitted to FAPESP (Fundac¸˜ao de Amparo `a Pesquisa do Estado de S˜ao Paulo), they can be es-timated, allowing the identification of the fresh water volume added to the region by the presently global melting of glaciers (Mesquita, 2009).
Area of Study
Figure 1 shows the Canan´eia region, where the tide gauge and GPS stations are. Part of Comprida Island; Canan´eia Island; and Cardoso Island can also be seen. The Southeast region area,
Figure 1 – Canan´eia region (Lat: 25◦01,0’ S and Long: 47◦55,5’ W), South coast of S˜ao Paulo State.
where Canan´eia is, can be seen in Mesquita et al. (2011). There is also a description of the marine lands, which is a matter of great interest for residents near the beaches of the Brazilian coast.
The Canan´eia research base was founded in 1954 and it is operated by Instituto Oceanogr´afico of Universidade de S˜ao Paulo (IO-USP). In 2002 a GPS station was installed and its antenna was placed near the German OTT sea level gauge.
Were obtained 30 months of double frequencies, which are used in this communication. A planialtimetric levelling is often carried out between the GPS station and the OTT tide gauge, following casual changes of the land where the research base is (Mesquita et al., 2005). The JASON and TOPEX/POSEIDON (JPL, 2015) satellite data are received and transmitted in real time to IBGE, that disclose them to the national and international scientific community.
RESULTS
Figure 2 shows the set of original time data of the relative mean sea level of Canan´eia, obtained from 1954 to 2005, that after filter-ing showed a systematic error of 5 cm in the measurements. This error correction allowed the accurate calculus of the trend showed by the continuous line of the figure (Mesquita et al., 2005).
The continuous line of Figure 2 corresponds to the filtered series of the decadal, intradecadal and meteorological influences. From the linear regression analysis, it was obtained the value of the coefficient of line a1and of its intercept a, that produced
the following values: a = 158,872 ± 0.094 mm; a1 = 5.66 ±
0.07 mm/year. In the figure it can be noted an adjustment of the 5 mm records, that occurred in 1971.
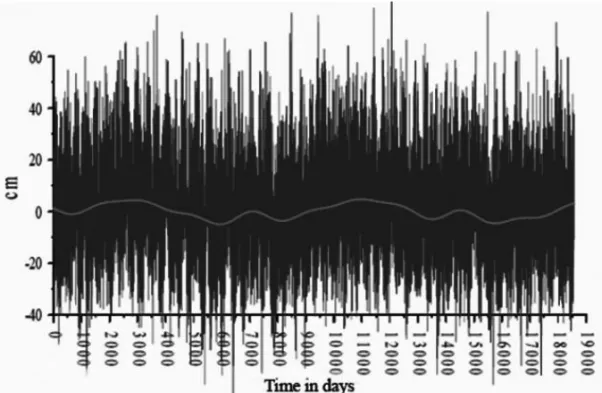
The Figure 3 shows the daily average data, calculated from the original time data of the sea level showed in Figure 2. The fluctuations observed in Figure 3 outline the decadal and intradecadal fluctuations resulting from the ENSO (El Nino & Southern Oscillation) phenomenon, (Morettin & Mesquita, 1984), which results from the oceanic and meteorological interaction that occurs in the equatorial part of the Pacific Ocean.
The ENSO phenomenon influence is also recorded in many other series. In the atmospheric precipitation series of Fortaleza (Mesquita & Morettin, 1984); in the sea level series of San Fran-cisco city, in the series of river flow in the basins near to S˜ao Paulo city (Mesquita & Corrˆea, not published); and in the flux series of the large rivers of the Earth planet (Kaiser et al., 1990).
The Figure 4 shows the spectrum obtained from the filtered data of the tide components, keeping the meteorological variations in the series. The periods of these spectral peaks demonstrate the
i i
“main” — 2017/12/19 — 15:23 — page 8 — #4
i i
8
CRUSTAL SINKING AND MEAN SEA LEVEL AT CANAN´EIAFigure 2 – Relative mean sea level trend in Canan´eia (Mesquita et al., 2005).
Figure 3 – Series of time values of sea level of Canan´eia. The continuous gray line corresponds to the daily averages
(Mesquita et al., op. cit.).
influence of the ENSO phenomenon on the sea level of Canan´eia. Amplitudes of intradecadal (from 2 up to 3 years) and decadal (12 years) periodicities are obtained with statistical assurance of 95%. The periods corresponding to these spectral peaks were obtained for the first time by Mesquita et al. (op. cit.).
The Figure 5 shows the temporal series of vertical heights in the period from 2003 to 2005, derived from the GPS mea-surements, produced in Canan´eia base of IO-USP, in the south coast of S˜ao Paulo State, indicating the negative inclination of the regression line.
The estimated value of the variation ratio of the vertical move-ment (negative), that is, the sinking of the crust in this port, is given by the inclination of the regression line, which is a2 =
–3.8± 1.1 mm/year. It can be noted that the data are not
con-tinuous as there are many interruptions caused by diverse cir-cumstances resulting from the maintenance operations of the GPS data acquisition system.
DISCUSSION
The results indicate that the crust in Canan´eia is sinking at the ratio of 3.8 mm/year. Values of the LT trend of the sea level of Canan´eia were calculated as the inclination of the regression line (a1= 5.66 mm/year) and the trend of the GPS vertical values were
a2= –3.8± 1.1 mm/year, showing that part of the rise of the
rel-ative mean sea level of Canan´eia is caused by the sinking of the crust in the region. The a3= 1.8 mm/year value results from the
difference between a1and a2, corresponding to the eustatic
Figure 4 – Sea level spectrum, showing intradecadal and decadal values of the sea level variation in
Canan´eia (Mesquita et al., 1996).
i i
“main” — 2017/12/19 — 15:23 — page 10 — #6
i i
10
CRUSTAL SINKING AND MEAN SEA LEVEL AT CANAN´EIAand steric components, that occurred in the period. In other words, a3value results from:
a) the water mass volume increase, due to the melting of glaciers (eustatic variation);
b) the decrease of the seawater salinity, due to the consequent fresh water addition (halosteric variation); and
c) the seawater temperature increase (steric variation). All of them resulting from the global warming.
Munk (2002) worked with global values of temperature in the period from 1960 to 2000, and observed an increase of 0.1 degree centigrade of temperature in the 0 to 500 meter oceanic layer, with a variation ratio of 0.0025 degrees by year, producing as a result an increase of approximately 3 cm of the sea steric level, with a variation ratio of b1= 0.75 mm by year.
The annual undertaking of the oceanographic session called Capric´ornio, previously proposed and mentioned, will be required in order to estimate the halosteric component apart from the steric component, and to have a complete overview of all variables of the sea level process of Canan´eia. Also, it will be necessary to establish the decadal and intradecadal variations discovered 30 years ago in the atmospheric precipitation data of Fortaleza in the Brazilian northeast and in the sea level data of San Francisco. Variations of this kind were exposed by Mesquita et al. (1988), Mesquita & Morettin (1984), Morettin & Mesquita (1984), Moret-tin et al. (1994) and Kaiser et al. (1990), who considered the flows of the large rivers of the Earth (Amazonas, Nilo, Mississipi, Volga etc.).
These values were detected not only in those publications, but they were also estimated by Hastenrath (1985) and detected after by Munk (2002), in the global lamina of oceanic temperature that covers the Earth planet.
During the last 40 years, results obtained by Faria (2005) show that the Brazilian coast did not present signs that there is any change of the beach line in many regions along the coast, including the Southeast region where Canan´eia is. Other works look for showing that the climatic variations are studied consid-ering short temporal continuance and that it is not possible to clearly establish the presently sea level variation.
Tamisiea & Metrovica (2011), based on modeling results of the Earth’s mantle, taking into account the Peltier (2000), GIA (Global Isostatic Adjustment), showed that in all Brazilian coast, including the Southeast region, the GIA impact is responsible for subtracting the mass of the Earth’s mantle. The values of this subtraction produce an increase of the sea level of approximately
b2= 0.6 millimeters/year, that is, 60 mm/century in all Brazilian
coast.
Although these results are quiescent to the present variation estimatives of the relative mean sea level of Canan´eia, they are not yet convenient nor in accordance with the reality of present days. Furthermore, they oppose the results of other authors. To achieve results closer to reality, it will be necessary to carry out annual sampling in Capric´ornio oceanographic session. Being so, probably along 13 years of research project continuance, it will be possible to estimate LT global values of the sea level of the Southeast region (Mesquita & Harari, 2011), as well as to carry out the first content estimative of ice converted into fresh water, as a consequence of the warming in Santos Basin (Mesquita, 2009).
CONCLUSION
The values of the sea level trend of Canan´eia (a1= 5.66 mm/year)
and of the trend of the GPS vertical values (a2= –3.8 mm/year)
demonstrated that the increase of the relative mean sea level of Canan´eia is largely caused by the sinking of the crust in the re-gion. The difference of a1and a2that produces a3= 1.8 mm/year
corresponds to the eustatic, halosteric and steric variation, that is, to the sum of the fresh water mass volume in the sea, as a conse-quence of the melting of glaciers, plus the sea level increase, due to the water temperature increase and the decrease of the oceanic salinity. All these variations (components) occur due to the global warming.
In order to achieve final conclusions about the eustatic, halosteric and steric components in all Brazilian southeast coast, it will be necessary measurements of the LT values, of the fresh water volume added in the Southeast region, and of the salinity and temperature values of these water masses, which can only be detected by means of measurements observing at least 13 years of continuance in an oceanographic session in Santos basin.
ACKNOWLEDGEMENTS
The authors would like to thank Instituto Oceanogr´afico of Univer-sidade de S˜ao Paulo (IOUSP) that allowed the use of the institu-tion facilities besides providing, since 2006, the extension course: “Measurement, analysis, forecasting and modelling of sea level” (medic¸˜ao, an´alise, previs˜ao e modelagem do n´ıvel do mar), under the aegis of Pr´o-Reitoria de Cultura e Extens˜ao of Universidade de S˜ao Paulo. To FAPESP for the financial support given to the project “Medic¸˜oes da Raz˜ao de Variac¸˜ao do N´ıvel Absoluto do Mar no Litoral do Estado de S˜ao Paulo: Canan´eia e Ubatuba” (vari-ation ratio measurements of the absolute sea level in the coast of S˜ao Paulo State: Canan´eia and Ubatuba). Process FAPESP No. 2010/17159-4.
REFERENCES
ABREU MA, FONSECA JR, FRANC¸A CA de S & MESQUITA AR de. 2006. Resultados preliminares das variac¸˜oes temporais das coorde-nadas da estac¸˜ao GPS de Canan´eia. Afro-America Gloss News, 10(1): 1 p. Available on: <http://www.mares.io.usp.br/aagn/aagn10/3sbo/ descritivo 3SBO 1.htm>. Access on: September 19, 2014.
AGGA – AUSTRALIAN GOVERNMENT GEOSCIENCE AUSTRALIA. 2012. Applying geoscience to Australia’s most important challenges. Avail-able on: <http://www.ga.gov.au/earth-monitoring/geodesy/geodetic-techniques/global-positioning-systems-gps.html>. Access on: September 13, 2014.
HASTENRATH S. 1985. Climate and Circulation of the Tropics. D. Reidel Publishing Company. 425 pp.
IBGE – INSTITUTO BRASILEIRO DE GEOGRAFIA E ESTAT´ISTICA. 2012. Available on: <http://www.ibge.gov.br/home/geociencias/geodesia/ default.shtm>. Access on: September 13, 2014.
JPL – JET PROPULSION LABORATORY/NASA. 2015. Missions. Avail-able on:<https://sealevel.jpl.nasa.gov/missions>. Access on: Febru-ary 5, 2015.
KAYSER N, JEAN-LUC P & TARDI Y. 1990. C. R. Acad. Sci. Paris t. 310, S´erie II, p. 757–763.
MESQUITA AR de. 2009. O Gigante em Movimento. In: Mudanc¸as Clim´aticas e Desafios Ambientais. S´erie Oceanos. Scientific American Brasil. p. 16–23.
MESQUITA AR de & CORREA MA. 2002. The Hydrological Cycle of the City of S˜ao Paulo and the Heat Fluxes of the Brazil Current: Mea-surements in the Capricorn Section. Proposal submitted to FAPESP (Fundac¸˜ao de Amparo `a Pesquisa do Estado de S˜ao Paulo) – Brazil. Programme SIHESP (Not published).
MESQUITA AR de & HARARI J. 2011. Early and Recent Sea Level Measurements in the Brazilian Coast Afro-America Gloss News, 15(1): 1 p. Available on: <http://www.mares.io.usp.br/aagn/aagn15/ EARLY IAPSO MELBOURNE IV.pdf>. Access on: September 19, 2014. MESQUITA AR de & MORETTIN PA. 1984. Inter-annual Variation of Precipitation in Cear´a, Brazil. Tropical Ocean Atmosphere Newsletter, NOAA, USA, 27: 9–10.
MESQUITA AR de, MORETTIN PA, GAIT N & TOLOI MC. 1988. An´alise das Relac¸˜oes entre alguns Fenˆomenos Naturais. Boletim do Instituto Geociˆencias da USP, 6: 4–8.
MESQUITA AR de, HARARI J & FRANCA CA de S. 1996. Global Changes in the South Atlantic: Decadal and Intradecadal Scales. An. Acad. Bras. Ci., 68(1): 109–115.
MESQUITA AR de, FRANC¸A CA de S, DUCARME B, VENEDIKOV A, COSTA DS, ABREU MA, VIEIRA DR, BLITZKOW D, FREITAS SRC & TRABANCO JAL. 2005. Analysis of the mean sea level from a 50 years tide gauge record and GPS observations at Canan´eia (S˜ao Paulo – Brazil). Afro America Gloss News, 9(1): 1 p. Available on: <http://www.mares.io.usp.br/aagn/aagn9/gp2 poster.pdf>. Access on: September 19, 2014.
MESQUITA AR de, FRANC¸A CA de S & CORREA MA. 2013. Sea Level Analyses of PSMSL Series by Proximity and Collinearity Coefficients. Brazilian Journal of Geophysics, 31(Supl. 1): 23–31.
MORETTIN PA & MESQUITA AR de. 1984. Rainfall at Fortaleza Brazil Revisited. In time Series Analyses, UK, 1: 66–87.
MORETTIN PA, GAIT N, TOLOI MC & MESQUITA AR de. 1994. Anal-ysis of The Relationship between some Natural Phenomena. Revista Brasileira de Meteorologia, 8: 523–534.
MUNK W. 2002. Twentieth century sea level: An Enigma. Proceedings of the National Academy of Sciences of the United States of America, PNAS, 99(10): 6550–6555.
PELTIER WR. 2000. Global Glacial Isostatic Adjustment and Modern Instrumental records of Relative Sea Level History. In: DOUGLAS BC, KEARNEY MS & LEATHERMAN SP (Eds.). Sea Level Rise. Academic Press, International Geophysics Series, 75: 65–95.
TAMISIEA ME & MITROVICA JX. 2011. The Moving Boundaries of Sea Level Change: Understanding the Origins of Geographic Variabil-ity. Oceanography, 24(2): 24–39. Available on:<http://www.tos.org/ oceanography/archive/24-2 tamisiea.pdf>. Access on: February 9, 2015.
Recebido em 28 maio, 2014 / Aceito em 6 outubro, 2016 Received on May 28, 2014 / Accepted on October 6, 2016
i i
“main” — 2017/12/19 — 15:23 — page 12 — #8
i i
12
CRUSTAL SINKING AND MEAN SEA LEVEL AT CANAN´EIA NOTES ABOUT THE AUTHORSCristiano de Salles Almeida. Undergraduate in Biological Sciences (licentiate – 2009) and (Bachelor’s Degree – 2010), at Universidade Nove de Julho
(UNI-NOVE). Master’s degree in Biological Oceanography at Instituto Oceanogr´afico of Universidade de S˜ao Paulo (IO-USP); Postgraduate – Lato Sensu – Specialization in Measurement, Analysis, Forecasting and Modelling of Sea Level at IO-USP. Areas of interest: Physical Oceanography; Biological Oceanography; Sea level; Geophysics.
Andr´e Ribeiro Lopes da Silva. Bachelor’s degree in Biological Sciences (2007) at Universidade Estadual de Goi´as (UEG); Postgraduate – Lato Sensu. Specialization
in Measurement, Analysis, Forecasting and Modelling of Sea Level at IO-USP. Areas of interest: Physical Oceanography; Biological Oceanography; Sea level; Geophysics.
Mauro Sznelwar. Bachelor’s degree in Statistics (2004) at Instituto de Matem´atica e Estat´ıstica of Universidade de S˜ao Paulo (IME-USP); Postgraduate in
Measure-ment, Analysis, Forecasting and Modelling of Sea Level at IO-USP (2010). Areas of interest: Statistics; Physical Oceanography; Sea level; Geophysics.
Afrˆanio Rubens de Mesquita. Bachelor’s degree in Physics (1964) at Institute of Physics of Universidade de S˜ao Paulo (IF-USP), Master’s degree in Physical
Oceanography (1968) at IO-USP, Master of Philosophy in Oceanography (1972) at University of Southampton, Doctor’s degree (1981) and Full Professor (1983) in Physical Oceanography at IO-USP. Created and coordinates the course Specialization in Measurement, Analysis, Forecasting and Modelling of Sea Level of IO-USP. Areas of interest: Physical Oceanography; Sea level; Geophysics.