Blackwell Publishing Ltd
Molecular and phenotypic profiling from the base to the
crown in maritime pine wood-forming tissue
Jorge A.P. Paiva
1,2,3, Marcelo Garcés
1,4, Ana Alves
3,5, Pauline Garnier-Géré
1, José Carlos Rodrigues
3,5, Céline
Lalanne
1, Stéphane Porcon
1, Grégoire Le Provost
1, Denilson da Silva Perez
6, Jean Brach
1, Jean-Marc Frigerio
1,
Stéphane Claverol
7, Aurélien Barré
8, Pedro Fevereiro
2,9and Christophe Plomion
11INRA, UMR 1202, Biodiversity Genes and Communities, 69 route d’Arcachon, F-33610 Cestas, France; 2Instituto de Tecnologia Química e Biológica, Universidade Nova de Lisboa, Av. da República-EAN, 2780-157 Oeiras, Portugal; 3Tropical Research Institute of Portugal (IICT), Forest and Forest Products Centre, Tapada da Ajuda, 1349-017 Lisboa, Portugal; 4Instituto de Biología Vegetal y Biotecnología. Universidad de Talca, Chile; 5Centro de Estudos Florestais, Departamento de Engenharia Florestal, Instituto Superior de Agronomia, ISA-DEF, Tapada Ajuda, 1349-017 Lisboa, Portugal; 6FCBA InTechFibres, Laboratoire Bois Process, Domaine Universitaire, BP 251, 38044 Grenoble, Cedex 9, France ; 7Proteomic Facility, Université Bordeaux 2, 33076 Bordeaux, France; 8Centre de Bioinformatique Bordeaux, Université Victor Segalen Bordeaux 2, rue Léo Saignat, 33076 Bordeaux Cedex, France; 9Departamento de Biologia Vegetal, Faculdade de Ciências da Universidade de Lisboa, Campo Grande, 1700 Lisboa, Portugal
Summary
• Environmental, developmental and genetic factors affect variation in wood properties at the chemical, anatomical and physical levels. Here, the phenotypic variation observed along the tree stem was explored and the hypothesis tested that this variation could be the result of the differential expression of genes/proteins during wood formation. • Differentiating xylem samples of maritime pine (Pinus pinaster) were collected from the top (crown wood, CW) to the bottom (base wood, BW) of adult trees. These samples were characterized by Fourier transform infrared spectroscopy (FTIR) and analytical pyrolysis. Two main groups of samples, corresponding to CW and BW, could be distinguished from cell wall chemical composition.
• A genomic approach, combining large-scale production of expressed sequence tags (ESTs), gene expression profiling and quantitative proteomics analysis, allowed identification of 262 unigenes (out of 3512) and 231 proteins (out of 1372 spots) that were differentially expressed along the stem.
• A good relationship was found between functional categories from transcriptomic and proteomic data. A good fit between the molecular mechanisms involved in CW–BW formation and these two types of wood phenotypic differences was also observed. This work provides a list of candidate genes for wood properties that will be tested in forward genetics.
Key words: analytical pyrolysis, Fourier transform infrared spectroscopy, Pinus pinaster, proteome, transcriptome, wood formation.
New Phytologist (2008) 178: 283–301
© INRA (2008). Journal compilation © New Phytologist (2008) doi: 10.1111/j.1469-8137.2008.02379.x
Author for correspondence:
Christophe Plomion Tel: +0 33 5 57 12 28 38 Fax: +0 33 5 57 97 90 88 Email: [email protected] Received: 29 August 2007 Accepted: 15 December 2007
Introduction
Trees are long-living organisms with the characteristic feature of forming wood. Wood confers mechanical strength and a long-distance pathway for water, minerals and hormones. Wood properties vary spatially within a single tree. The transition
between juvenile/crown wood ( J/CW) to mature/base wood (M/BW) constitutes an important source of variation in wood traits (Zobel & van Buijtenen, 1989; Zobel & Sprague, 1998; Larson et al., 2001). This transition has been defined for the variations occurring both from the pith to the bark and from the apex to the base of the tree stem.
Mature/base wood differs from J/CW in that it has thicker cell walls, narrower cell lumens, larger cellulose microfibril angles, larger spiral-grain angles and higher specific density. Juvenile/crown wood can occasionally present disproportionate amounts of compression wood, distorted grain patterns and pith deposits (Larson et al., 2001). In terms of chemical composition, M/BW shows higher cellulose and lower lignin contents (reviewed by Zobel & Sprague, 1998). The anatomical, structural and chemical characteristics of J/CW adversely affect solid wood product performances (e.g. strength, stiffness and warping on drying) as well as pulp and paper manufacture (e.g. yield, tearing strength and bleaching) (Zobel & van Buijtenen, 1989; Zobel & Sprague, 1998). Owing to economic factors, there are strong trends towards the decrease of harvest age in industrial forest plantations. Together with faster growth rates and changing silvicultural practices, these factors will lead to a higher proportion of J/CW in harvested trees. Thus, it is of great importance to understand the molecular machinery involved in J/CW and M/BW formation, and to provide genetic markers for improving and manipulating wood quality.
Wood cell division and differentiation occur at the vascular cambium, the meristematic tissue found between the xylem and phloem. During wood formation, new xylem cells are produced by division of cambial initials (fusiform and ray initials). Cambial maturation (cell expansion, cell wall thickening and programmed cell death) results in changes of cell dimension and structure (e.g. orientation of microfibrils in the S2 layer of the cell wall), and chemical composition (e.g.
cellulose and lignin content), which in turn affect the final anatomical, structural and chemical composition of fully developed wood.
The maintenance of a strict balance between the number of meristematic cells (cambium initials) and the programmed differentiation of their progeny (rays and tracheids) is critical for meristematic function (Nakajima & Benfey, 2002). Strong evidence has been found that key genes originally characterized as those regulating the meristematic cells of the shoot apical meristem are also expressed in the vascular cambium during woody growth (reviewed by Groover, 2005). At the top of a tree or at the end of branches, new secondary cambium is produced each year from the apical meristem. Simultaneously, at the tree stem base, the secondary cambium is maintained over the years by a delicate balance between cell proliferation and differentiation. These different cambial origins and locations result in a cambial age gradient along the tree stem; that is, at the apices of the stems and branches, secondary cambium tissues are younger than those located at the base of the stem.
The different ages of secondary cambium tissues along an adult tree stem, combined with the effects of genetic and environmental factors, for example, proximity to the crown (Larson et al., 2001), are likely to affect the rate and duration of cell division and cambial maturation, and thus result in differences in anatomical structure and xylem composition.
At the beginning of the growing season, the reactivation of cambial growth in mature pine trees occurs simultaneously throughout the stem (Savidge & Wareing, 1984; Sundberg
et al., 1991). However, there is a high degree of variation in
the rate of cell division and cambial maturation along the stem. Uggla et al. (1998) reported that cambial growth, measured by the radial number of tracheary derivatives produced following the start of the growing season, was greater within the crown, and decreased down the stem. They also showed that this pattern was stable over several years. Recently, Cato
et al. (2006) found that the rate of cell division was 3.3 times
higher in cambium located in the crown than at the tree base, and that this faster growth was associated with reduced cell wall thickness. They also found that the proportion of cells undergoing secondary thickening in the crown was significantly lower than at the base. Cato et al. (2006) also showed that genes involved in cell division and expansion tended to be more highly expressed in the tree crown, and two putative cell-cycle repressors (with sequence homology with a putative PREG-like negative regulator, and a putative CDC48 repressor protein) were expressed twofold higher in the base. They found that transcripts involved in secondary cell wall thickening were more abundant at the base.
Pines are considered to be an excellent model species to study wood formation (Lev-Yadun & Sederoff, 2000). Despite their relatively simple xylem structure (mainly tracheids) within a single tree genotype, six contrasting types of wood can be identified: compression wood vs opposite wood, early wood vs late wood and J/CW vs M/BW. The plasticity of molecular mechanisms associated with the formation of these different types of wood has been studied in pines mainly at the trans-criptome level (Whetten et al., 2001; Lorenz & Dean, 2002; Le Provost et al., 2003; Egersdotter et al., 2004; Yang & Loosptra, 2005; Cato et al., 2006). RT-PCR has been used to confirm the results of over 350 genes that were differentially expressed between wood-forming tissues associated with early vs late wood, compression vs opposite wood, and juvenile ( JW) vs mature wood (MW). These transcripts included genes involved in cell division, expansion and cell wall thickening. However, it is now necessary to carry out research on the proteome of wood-forming tissue (Plomion et al., 2000; Gion et al., 2005).
In contrast to fully developed wood, wood-forming tissues associated with different types of wood have generally not been characterized at the phenotypic level. Moreover, studies aimed at characterizing molecular modifications have often been disconnected from phenotypic characterization of corre-sponding wood-forming cells. In only a handful of studies has phenotypic characterization of wood-forming tissues been combined with gene expression analyses. For example, in
Populus, Andersson-Gunneras et al. (2006) studied the
metabolomic changes together with gene expression profile during the formation of tension wood, and in Pinus radiata, Cato et al. (2006) measured tracheid cell wall thickness,
radial growth and gene expression of wood-forming tissues associated with both BW and CW along the tree stem.
The objectives of this study were twofold: (i) to describe the variation of cell wall chemical composition in wood-forming tissues along the stem; and (ii) to study the variation in the transcriptome and proteome of differentiating xylem collected on the same samples.
Materials and Methods
Tissue samplingA total of seven samples were collected along a cambial age gradient on one straight 30-yr-old tree. Samples were collected on the 12 May 2003 at internodes of years 1982 (level 0, L0), 1985 (level 1, L1), 1988 (level 2, L2), 1991 (level 3, L3), 1994 (level 4, L4), 1997 (level 5, L5), and 1999/2000 (level 6, L6). Levels L1 to L6 were used to describe the variation of cell wall chemical composition, and for transcriptome analyses. Levels L0, L2, L4, and L6 were used to describe the proteome along the tree.
Two additional straight trees (A and B) were sampled in 2006, at the same date and location as that of the tree sampled in 2003. This additional sampling was conducted in order to study the extent to which the results obtained in 2003 were related, or not, to other genotypes and climatic conditions. Samples L0 (internode 1982) and L6 (internode 1999/2000) were characterized in terms of cell wall chemical composition. Samples L1 (1985), L2 (1988), L5 (1997), and L6 (1999/ 2000) were used to quantify gene expression (using qPCR) for 14 genes showing differential expression along the stem of the tree sampled in 2003.
These three mature trees were sampled from a natural stand within the Forest Research Unit of INRA-Pierroton (Cestas, France). Each tree was 50 m from its nearest neighbour. Typically, natural stands from this region display high degrees of heterozygosity among individuals (Mariette et al., 2001; Derory et al., 2002; Ribeiro et al., 2002), and parentage analysis (González-Martinez et al., 2002) has shown that close mature trees within stands are unrelated most of the time.
The outer bark was removed from the trunk (Supplementary material, Fig. S1A), and the inner bark was cut and removed using a knife (Fig. S1B). This sampled layer comprised the secondary phloem cells with attached cambium and immature secondary xylem cells in the early stages of differentiation (division and beginning of cell expansion). The exposed tissue on the trunk side was then scraped down to the hard lignified layer beneath (Fig. S1C). Scraped tissues were soft and com-prised loosely bound differentiating xylem cells undergoing cell expansion or initiating the cell wall thickening. Tissues were collected from around the trunk and then bulked. It took 30 min to collect all the samples from each tree. Differentiating xylem samples were immediately frozen in liquid nitrogen, and stored at −80°C before use.
Phenotypic characterisation of wood-forming tissues Microscopic observations Blocks of 0.5 cm× 0.5 cm × 0.5 cm (from the 2006 samples), consisting of developing phloem, xylem and fully developed wood, were dehydrated in ethanol and embedded in paraffin. Samples were sectioned with a microdissector at a thickness of 20 µm and examined using bright field illumination on a Nikon Eclipse 80i microscope (Nikon Instruments Europe BV, Badhoevedorp, the Netherlands) equipped with a digital camera. NIS-Elements D 2.30 (Nikon) was used for image analysis.
Automatic fibre analysis Cells of the differentiating wood samples collected in 2003 were dispersed by a nondestructive method. A known mass of tissue was put in a 1 : 1 (v/v) solution of acetic acid and hydrogen peroxide for 14–16 h, at 75°C. A known mass of sample was then placed in the MorFi®
analyser (Techpap, Grenoble, France), diluted to make a cell (fibre) suspension, and then homogenized. The measurement chamber consists of a transparent vein with a certain geometry that allows the flux of cell suspension and images to be captured by an optical device. Images were analysed using MorFi® V7.07.16.B software.
Chemical characterization Extractive-free samples were characterized by Fourier transform infrared (FTIR) spectroscopy and analytical pyrolysis.
The samples were freeze-dried for 1 wk and ground into a fine powder using a pestle and mortar. An aliquot of each sample was then sequentially extracted by dichloromethane, methanol and water using a fast extraction procedure. This was conducted for 30 min in an extraction thimble in direct contact with the boiling solvent (extraction). Finally, the thimble was raised and kept above the boiling solvent for 1 h (washing step).
FTIR spectroscopy Approximately 1.5 mg of finely ground tissue was mixed with 200 mg of KBr spectroscopic grade using a ball mill for 20 s. A standard pellet device was used to prepare 13-mm-diameter pellets. The spectra were recorded using a Bio-Rad FTS 165 infrared spectrometer with 64 scans per sample at a resolution of 4 cm−1. At least two spectra per sample were obtained. Each spectrum was rationed against a background of pure KBr.
The spectra were offset at the minimum close to 2000 cm−1, and two different normalization procedures were used: the min-max normalization and the vector normalization. The min-max normalization method scales spectrum intensities to the effect that the minimum absorbance unit is 0 (at 1925 cm−1) and the maximum is 2 (at the polysaccharide band with maxima at 1059 cm−1). This normalization was performed between 2000 cm−1 and 400 cm−1.
The vector normalization method calculates the average
from the spectrum, decreasing the mid-spectrum to y= 0. The sum of squares of all y-values is calculated and the spectrum is divided by the square root of this sum.
For a semiquantitative evaluation of the relative proportions of polysaccharides/proteins between samples, these two nor-malization procedures were used. The results were essentially the same, thus only results obtained with min-max normalization are shown.
Analytical pyrolysis Analytical pyrolysis (pyrolysis gas chroma-tography with flame ionization detector, Py-GC/FID) was performed with a CDS Pyroprobe 1000 with a coil filament connected to a HP 5890 series II by a heated interface (270°C) (Rodrigues et al., 2001). Each sample (75–80 µg) was pyrolysed at 650°C for 10 s with a temperature rise time of approx. 20°C ms−1. The DB1701 (60 m× 0.25 mm, 0.25 µm film,
J&W Scientific) capillary column was used. Gas chromatography conditions were as follows: injector, 250°C; detector, 280°C; temperature programme, 45°C, 4 min isothermal, then heating rate 4°C min−1 to 270°C. The identification of pyrolysis
products was performed using previously well characterized samples, by Py-GC/MS (CDS Pyroprobe 1000 connected to a HP 6890 with a HP 5973 mass selective detector). Products were identified by their mass spectra and retention time through comparison with the NIST library and with the literature (Faix et al., 1990a,b; 1991a,b; Ralph & Hatfield, 1991). At least two runs per sample were performed. Quantification of pyrolysis products was calculated with Chemstation Software (Agilent Technologies, Palo Alto, CA, USA).
Transcriptome analysis
RNA extraction Total RNA was isolated from 3 g of xylem following Chang et al. (1993). Genomic DNA was removed by treating RNA with DNase (0.1 U µl−1 of total RNA; Promega, Madison, WI, USA) for 30 min at 37°C. RNasine (0.4 U µl−1 of total RNA; Promega) was added to protect RNA from RNase degradation. Treated RNA was then purified using an RNeasy® Mini Kit (Qiagen GmbH, Hilden, Germany),
quantified by spectrometry and quality checked using 2% agarose gels.
cDNA library construction, sequencing and bioinformatic analysis A composite cDNA library was constructed using the xylem samples described in Table S1. Total RNA from each sample was extracted following the method of Chang
et al. (1993). Equal amounts of total RNA from each sample
were mixed and poly A(+) RNA was isolated from this bulked sample. A cDNA library was prepared using the λ-ZAP-cDNA synthesis kit (Stratagene, La Jolla, CA, USA). Approximately 10 000 clones were excised to generate plasmid clones. The colonies were randomly picked and clones were arranged individually in 96-well microtitre plates for storage and processing. Individual plasmid clones were grown overnight
at 37°C in wells containing 250 µl of LB-ampicillin and stored at –80°C with glycerol. The 10 000 plasmid clones were sequenced using the Templifi kit (Amersham Bioscience, Piscataway, NJ, USA), by single pass from the 5′-end to generate the EST collection.
A bioinformatic pipeline that was developed to analyse the maritime pine ESTs sequences was based on our own developments and third party software. This system, available at http://cbi.labri.fr/outils/SAM2/, allowed the following operations to be performed automatically on all ESTs: (i) base calling: phred (sequence and quality files); (ii) vector masking: cross_match; (iii) vector removing (and splitting); and (iv) detection of polyA (and splitting). Only sequences longer than 60 nucleotides were kept for further analysis. Since the data from the sequencing machine vary in quality for a number of reasons (Ewing et al., 1999), a visual inspection was conducted for sequences with quality score < 20, that is with a mean phred base-call accuracy < 99%, and for those containing a poly A, T, C or G. Secondly, to provide a nonredundant set of ESTs to be spotted onto nylon membranes, we used the StackPack (http://www.sanbi.ac.za) software for clustering and assembly of the clones. A functional annotation (gene function and metabolic classification) was then assigned for each consensus. This process is based on a search for homo-logy with public protein and nucleic acid sequence databases, using the BLAST software (Altschul et al., 1997). Homologues were sequentially searched in SWISSPROT (BLASTX), TrEMBL (BLASTX), EMBL (BLASTN) and, lastly, dbEST (BLASTN). At each step, the process was stopped if a gene with a similar sequence was found (defined by an expected value lower than 10−5 for BLASTX, and 10−10 for BLASTN searches). Annotation decision was facilitated by complementary analysis such as sequence comparisons with dedicated databases such as PRODOM (Corpet et al., 1998), PROSITE (Falquet
et al., 2002) and KEGG (Kanehisa & Goto, 2000). ESTs were
deposited at the EMBL database (http://www.ebi.ac.uk/embl/ index.html) and annotated sequences made available in a dedicated server (http://cbi.labri.fr/outils/SAM/COMPLETE/ index.php).
Production of maritime pine xylem macroarrays, hybridization, signal quantification and data analysis The 3512 genes of the Pinus pinaster Ait. xylem cDNA library (Paiva, 2006), representing 89.5% of unique sequences (based on Pinus Genes Index Tentative Contigs database (PGI), http:// compbio.dfci.harvard.edu/tgi/cgi-bin/tgi/gimain.pl?gudb=pine) and controls, including luciferase, desmin, nebulin, RAS polylinker of insertional vector of the cDNA library and water, were amplified by nested PCR as follows. The first PCR (PCR1) was prepared in 10 µl, with 1 µl of bacteria suspension added to a PCR mix containing 5 mm dNTPs, 2 mm MgCl2,
0.2 µm of universal primers M13 (−20) and R13, and 0.2 U µl−1 of Taq polymerase. The second PCR (PCR2) was prepared
in 100 µl, with 2 µl of PCR1 amplification product added to a PCR mix containing 5 mm dNTPs, 2 mm MgCl2, 0.2 µm of
T7 and T3 primers, and 0.2 U µl−1 of Taq polymerase. All PCR reactions were performed using a Primus Thermoblock (MWG, Reinach, Switzerland). After an initial denaturation step at 95°C for 5 min, 15 cycles for the PCR1 and 40 cycles for the PCR2 were carried out as follows: 30 s denaturation at 95°C, 45 s annealing at 55°C, and 90 s elongation at 72°C. A final elongation step was conducted for 10 min at 72°C. All PCR2 were checked for their quality and quantified on an agarose gel before spotting.
Amplified genes and controls were robotically spotted (Eurogentec, Liege, Belgium) in duplicates onto a set of two nylon membranes, using a two-level template, as indicated in Fig. S2.
Antisense mRNA (aRNA) was obtained from 2 µg of total RNA using the MessageAmp kit (Ambion, Inc, Austin, TX, USA). Antisense mRNA was quantified using the RiboGreen®RNA quantitation assay (Molecular Probes Inc.,
Eugene, OR, USA). All aRNA samples were diluted in Rnase-free water to a final concentration of 50 ng µl−1. Desmin was used as an external control of probe labelling. A desmin cDNA fragment cloned in pBS-SK+ was used for in vitro transcription of RNA from T3 promoter, according to instructions provided by the supplier of T3-polymerase (Riboprobe combination systems T3/T7 RNA Polymerase; Promega). Desmin aRNA was also quantified by the RiboGreen®RNA assay.
Probes were synthesized using 300 ng aRNA supplemented with 2% desmin aRNA using the Strip-EZ™ RT kit from Ambion (Ambion Inc.) in the presence of random-sequence decamer primers provided with the kit, according to the manufacturer’s instructions.
Filters were prehybridized for 8 h in 15 ml of hybridization buffer (5xSSC, 5X Denhardt, 0.5% SDS, 10 µg ml−1 denatured salmon sperm DNA) at 65°C. Hybridizations were carried out in high stringency conditions at 65°C overnight using 15 ml of fresh hybridization buffer supplemented with a minimum of 106 cpm purified and denatured probe per ml of
buffer. Membranes were washed twice (5 min each) at room temperature with 2xSSC 0.5% SDS buffer. They were then washed twice at 65°C for 15 min in 2xSSC 0.1% SDS buffer, two washes of 15 min in 1xSSC 0.1% SDS followed by two washes (15 min each) in 0.1xSSC 0.1% SDS buffer. Finally, they were wrapped in a plastic film, exposed to the General Purpose PhosphorImager screen (Amersham Bioscience) for a period of 4 d, and finally scanned using Storm System (Amersham Bioscience), set to a resolution of 50 µm.
Hybridization signals were quantified using ArrayVision (Imaging Research, Ontario, Canada). Median-based trimmed mean density (MTM density) was used for spot quantification. The background of each spot within each level 1 grid was calculated using the median of the four blanks located in the corresponding level 1 grid (‘selected spot background’ option of ArrayVision; see Fig. S2). The background values were
removed from individual spot density values, and the adjusted values were used for statistical analysis.
Two batches of three hybridization replicates (including labelling, overnight hybridizations, washing and screen expo-sition) were performed, resulting in a total of six data points for each spotted gene (three replicated hybridizations× two spots per gene). Batch A corresponded to samples L1, L3 and L5, and batch B corresponded to samples L2, L4 and L6. Overall, 18 hybridizations (three replicates × six samples) were performed.
After background correction, the average density for each membrane set and hybridization was calculated. The density of all data points from a membrane was then divided by the corresponding average mean to account for technical effects. The following ANOVA model was then applied to each gene (based on corrected density values). Statistical analyses were performed using SAS v. 6.12 (Statistical Analysis System version 6.12, SAS Institute, Cary, NC, USA). Analysis of variance (ANOVA) was carried out using the following model: Eqn 1 where Yjkl is the gene corrected density of batch j in sample k
for replicate l (l= 1−6), Bj is the batch effect ( j= A and B), and Lk/j is the cambial age effect (k= 1, 2, 3, 4, 5, 6) nested
in batch effect Bj, and εjkl is the residual of the model.
The criteria used to select differentially expressed genes were based on the results from these ANOVA models. A transcript was classified as differentially expressed between the different samples if its P-value for the cambial age effect within batch was less than 10−4, if the cambial age effect also explained more than 50% of the total variation in the sum of squares (in order to guarantee that most variation was the result of cambial age), and if it displayed a normal residual distribution. Using such stringent criteria, it was our hope to decrease the rate of false positives, as the threshold used was an approximation of the Bonferroni threshold used for multiple comparison tests, which guarantees that the identification of false positives is less than one. By considering the normality of residues, we guaranteed one of the conditions of application of the parametric tests implemented in the model. However, the risk associated with these stringent statistical criteria was that true positives could be discarded, that is, genes showing a true differential expression between the cambial age samples. Centred-reduced data of the differentially expressed genes, were analysed using the ‘Click’ algorithm (Sharan & Shamir, 2000) of the Expander software (Shamir et al., 2005), in order to cluster genes by their expression profiles.
Quantitative real-time PCR (qPCR) assay PCR primers were designed using PRIMER3 software (Rozen & Skaletsky, 2000) for 14 genes, as well as for two controls corresponding to a ribosomal protein (BX252550) and a Profilin 1 gene (BX249454). The two controls were selected based on a
pre-screen of 10 genes on different types of wood-forming tissues collected along the trunk (from BW to CW) and through the duration of the growing season (from early to late wood). Primers were designed to have an optimal size of 22 bp (18–24 bp), GC content of 40–60%, and TM of 58–62°C. Other criteria, such as primer self-annealing, were also taken into account. Predicted fragment size ranged between 103 and 228 bp. Olignonucleotides were synthesized by Eurogentec. Primers pairs are listed in Table S2.
One microgram of total RNA was reverse transcribed, using the ImProm-II™ Reverse Transcription System (Promega), in accordance with manufacture instructions. Two independent reverse-transcription reactions (RT) were performed using a pool of total RNA and each one was diluted 10-fold before each qPCR reaction. The qPCR reactions were performed on the Chromo4™ Multicolor Real-Time PCR Detection System (Bio-Rad Laboratories, Inc. Hercules, CA, USA), by adding 10 µl of IQ™ SYBR® Green SuperMix (Bio-Rad), 3 µl of
diluted cDNA, 3 pmol of each primer, and water (to the final volume of 20 µl), to the reaction mix. After one initial incubation at 95°C for 3 min, amplifications were performed for 40 cycles with the following cycle profile: a denaturing step at 95°C for 15 s followed by an annealing/extension step at 60°C for 45 s, as recommended by the manufacturers. A fluorescent signal was obtained at each cycle at the 60°C annealing/extension step. After amplification, a melting curve was obtained allowing the detection of primer-dimers, and other nonspecific amplification products.
For relative quantification of transcript accumulation, Ct values were obtained for each of the two gene-primer-cDNA dilutions, and data were analysed using the Excel (Microsoft) macro GENEX v1.10 (Gene expression Analysis for iCycle iQ® Real-time PCR Detection System, v1.10, 2004, Bio-Rad
Laboratories), using the methods derived from the algorithms of Vandesompele et al. (2002). For each tested gene, average PCR efficiency was calculated for each individual sample well (automatically calculated by Chromo4™ Multicolor Real-Time PCR Detection System (Bio-Rad Laboratories) software and based on fluorescence signal) and used in expression data analysis.
Proteome analysis using two-dimensional gel-electrophoresis (2D-E), coupled with protein identification by tandem mass spectrometry (MS/MS) Protein extraction and quantification Starting with 2 g of fresh tissue, the total protein of each of the four samples described earlier (2003 tree) was extracted following the procedure described by Gion et al. (2005). Proteins were stored at −80°C. Three extractions were completed for each sample and pooled for protein quantification. The resulting mix was quantified over six replicated assays, using the protocol described by Ramagli & Rodriguez (1985). The mean concentration was then calculated and used to load 300 µg of proteins on each IPG strip.
Two-dimensional gel-electrophoresis This technique (O’Farrel, 1975) was used to analyse total protein from the xylem samples following the procedure of Gion et al. (2005) adapted for the IPGphor system (Amersham Biosciences, Uppsala, Sweden). For the IEF, 24 cm strips were used with a linear pH gradient ranging from 4 to 7. To ensure gel reproducibility, four replicates were performed for each sample, resulting in a total of 16 gels.
Coomassie brilliant blue G250 (CBB G-250; Bio-Rad) was used for gel staining. Gels were fixed for 2 h in a solution containing 2% phosphoric acid and 50% ethanol. After three washes with water (each of 30 min), the gels were placed in an incubation solution (methanol 34%, ammonium sulphate 17%, phosphoric acid 2%) for 1 h, and then immersed in a staining solution (methanol 34%, ammonium sulphate 17%, phosphoric acid 2%, Coomassie blue 0.05%) for 5 d. Finally, the gels were stored for several days in a 5% acid acetic solution before scanning and manual spot picking.
Image acquisition and spot detection Stained gels were digi-talized using the Image Scanner (Amersham Biosciences) and the LabScan software (Amersham Biosciences). First, a calibration with a grey scale was necessary to transform grey levels into OD values for each pixel of the gel picture. The calibration method used was the colloidal blue method described in the LabScan manual. All the gel pictures were saved as tiff files. Image analysis was performed using the Image Master 2D-Elite software (IM2D; Amersham Biosciences). The 16 gel images were placed in one folder. The wizard detection method proposed by the software was used to detect the spots. The spots that were automatically detected by the software were checked manually. Following the detection procedure, the volume of each spot corresponded to a gross value. In order to eliminate the background from this gross value, the nonspot mode of IM2D was used. Finally, all the gels were matched to attribute a common spot identity for the same spots derived from different images. For this, we used the automatic matching options of IM2D. After a visual check of the matching, the IM2D software was used to construct a master gel. For each sample, when a protein was detected in all of the four replicates, this protein was automatically added to the master gel. Normalized volumes were finally obtained using the total spot volume normalization procedure of IM2D.
Statistical analyses Analysis of variance (ANOVA) was used to test the position effect (L0, L2, L4, L6) on protein accumulation, using the following model: Yijk= µ + Lj+ eijk,
where Yijk is the normalized intensity value of spot i (i= 1–1372)
in level j (j= 0, 2, 4, 6) for replicate k (k = 1–4), µ is the mean intensity of spot i in all gels, Lj is the effect of level j, and eijk
is the residual term. ANOVAs were performed using R (R Development Core Team, 2004). A protein was classified as differentially expressed between the different samples if its
selection of false positives was minimized. Centred-reduced data for the differentially expressed proteins were analysed using the k-means algorithm of the Expander software.
Protein identification by mass spectrometry CBB-stained protein spots were washed in H2O/ACN (50 : 50) until
destaining. The solvent mixture was removed and replaced by ACN. After shrinking of the gel pieces and ACN removal, gel pieces were dried in a vacuum centrifuge. Gel pieces were rehydrated in 10 ng µl−1 trypsin (Sigma-Aldrich, St Louis, MO, USA) in 50 mm NH4HCO3 and incubated overnight at
37°C. The supernatant was removed and stored at −20°C, and the gel pieces were incubated for 15 min in 50 mm NH4HCO3 at room temperature under rotary shaking. This
second supernatant was pooled with the previous one, and a H2O/ACN/HCOOH (47.5 : 47.5 : 5) solution was added
to the gel pieces for 15 min. This step was repeated twice. Supernatants were pooled and concentrated in a vacuum centrifuge to reach a final volume of 25 µl. Digests were finally acidified by addition of 1.2 µl acetic acid and stored at −20°C. Peptide mixtures were analysed by online nano HPLC (LC Packings, Amsterdam, the Netherlands) coupled to a nanospray LCQ Deca XP Plus ion trap mass spectrometer (Thermo-Finnigan, San Jose, CA, USA). Peptides were separated on a 75 µm id× 15 cm C18 PepMapTM column (LC Packings, Amsterdam, the Netherlands).
The flow rate was set at 200 nl min−1. Peptides were eluted using a 5–50% linear gradient of solvent B in 30 min (solvent A was 0.1% formic acid in 5% ACN, and solvent B was 0.1% formic acid in 80% ACN). The mass spectrometer was operated in positive ion mode at a 1.8 kV needle voltage and a 43 V capillary voltage. Data acquisition was performed in a data-dependent mode alternating in a single run, a MS survey scan over the range m/z 300–1700 and three full-scan MS/MS in an exclusion dynamic mode. MS/MS data were acquired using a two-m/z-units ion isolation window, a 35% relative collision energy, and a 0.5 min dynamic exclusion duration.
Peptides were identified with SEQUEST through the Bioworks 3.2 interface (Thermo-Finnigan, Torrence, CA, USA) using the 327,484 indexed entries of the Pinus Gene Index (http://compbio.dfci.harvard.edu/tgi/cgi-bin/tgi/ gimain.pl?gudb=pine). The validation filters used for the database query were as follows: Peptide DeltaCN ≥ 0.1, Peptide Xcorr vs Charge State ≥ 1.5 (+1), 2.0 (+2), 2.5 (+3), 3.0 (≥ +4), Peptide Peptide Probability ≤ 0.05, Peptide # Matches= 1, Protein Number of Different Peptides ≥ 2.
Results
Phenotypic analysis of base to crown wood-forming tissues
Anatomical and morphological characterization The transition between J/CW to M/BW wood in maritime pine, estimated
from variations in wood density, occurs at around the 10th to the 12th growth ring (Zobel et al., 1972; Radi, 1992; Dumail
et al., 1998; Fonseca & Lousada, 2000). Considering the age
range of the 2003 samples, it is likely that the differentiating xylem collected along the stem included a range of wood, from BW to CW. To ensure that the extreme samples collected at the base and the crown had the properties commonly reported for these types of wood, differentiating xylem cell morphology was characterized using the MorFi® automatic analyser.
Signi-ficant differences were obtained between the samples collected at the crown and the base, with regard to the mean length (410 vs 1020 µm, respectively) and the mean width of cells (27.9 vs 31.2 µm, respectively). These data fit the expectation of shorter and thinner fibres in CW as compared with BW.
Upon microscopic observations (carried out for the 2006 samples; see Fig. S3) it can be seen that: (i) the number of tracheids produced by the cambium at the crown is about twice that produced at the base; (ii) the length of each zone corresponding to the different stages of secondary xylogenesis also differs between both samples; and (iii) tissues left out from the sampling (at either the base or the crown) comprise secondary phloem with attached cambium as well as xylem cells in the early stages of differentiation. The exposed tissue that was collected comprised loosely bound differentiating xylem cells undertaking cell expansion (EZ zone in Fig. S3) and maturing tracheids (cells undertaking cell wall thickening and programmed cell death, MZ zone in Fig. S3). Although the length of the expansion zone was found to be not signifi-cantly different between crown and base samples, the mean number of cells differed significantly (8.1 vs 5.8, respectively;
t-test P< 0.05). The length of the maturing zone was cleary
different (t-test P< 0.05) between both samples (2316 µm in CW vs 1344 µm in BW), as well as the number of cells (60.8 cells in CW vs 29.3 cells in BW, t-test P< 0.05), and the mean cell radius (11 µm in CW vs 15 µm in BW, t-test P< 0.05). Cell wall chemical composition Cell wall chemical composition of differentiating xylem samples collected in 2003 was assessed by FTIR and analytical pyrolysis on extractive-free tissues.
Fourier transform infrared spectroscopy spectra were obtained for samples L1 to L6 collected along the tree stem. Besides the usual features found in the spectra of fully developed wood, that is, the characteristic bands of lignin and polysaccharides, we also found bands of amide I, II, and III (Fig. S4) that can be attributed to the presence of amide vibrations from the peptide group (proteins). A higher protein content was found in the crown (samples L5 and L6), whereas a lower protein content was found in the base samples (L1 and L2). Inter-mediate amounts were observed for samples L3 and L4 (Fig. 1). Pyrograms (Fig. S5) contained typical pyrolysis products of polysaccharides and lignin origin (see also details in Table S3).
The variation in the main groups of pyrolysis products along the stem is presented in Fig. 2:
• Toluene aa1, a characteristic pyrolysis product of phenyla-lanine (Moldoveanu, 1998), was found to be at a low and stable level from L1 to L3 (BW), and then rapidly increased from L3 to L6 (CW).
• Lignin: part of H-units result from protein contribution, as it is known that tyrosine produces phenol and cresol, two main H pyrolysis products of lignin (Faix et al., 1991a; Moldoveanu, 1998). Indeed, H-units followed the same pattern as pheny-lalanine (aa1). For this reason we preferred not to use the H-units as a reliable measure of lignin composition, but rely more on lignin determined by G-units (g). G-units lignin showed a very irregular profile along the cambial age gradient. After an abrupt increase from L1 to L2, it dropped down from L2 to L3, then increased again from L4 to L5, and finally decreased from L5 to L6.
• Carbohydrate pyrolysis products other than pentosans and hexoxans (c) increased from BW to CW with a rapid increase
from L4 to L6. It should be noted that hemicelluloses are the main contributors to c. pentosans (cP), and that the content was quite irregular but showed a tendency to increase from the bottom (L1) to the top (L6) of the tree. Together, c and cP indicate that hemicellulose content increased from BW to CW. The higher content of cellulose (represented by hexosans cH and, in particular, cH7-levoglucosan) was found to slightly decrease from L1 to L4, and then decreased abruptly from L4 to L6. It should be noted that the pattern of c (mainly of hemicellulose origin) and cH (mainly of cellulose origin) presented symmetric profiles.
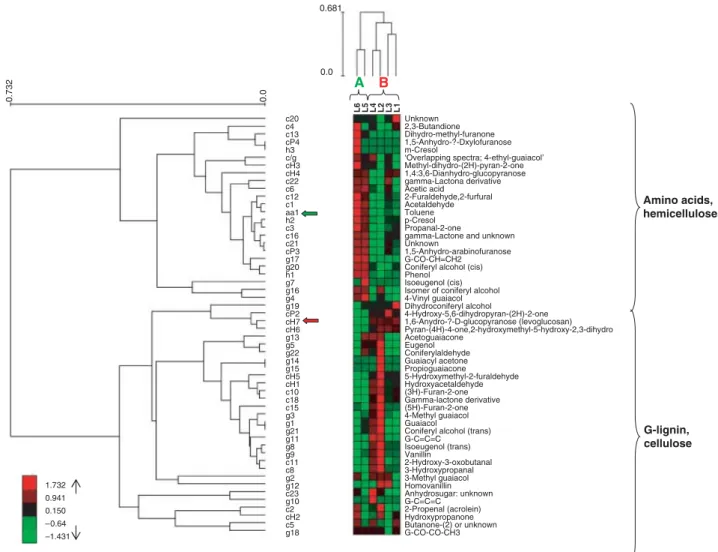
Expander software was used to cluster the differentiating xylem samples according to their metabolic profile. This analysis revealed two main sub-trees (Fig. 3):
• Group A included the differentiating xylem samples derived from the youngest cambium collected at the top of the tree (L5 and L6). These samples had lower cellulose (cH, cH7), higher hemicelluloses (c and cP), and higher amino acid (aa1) content.
• Group B consisted of the differentiating xylem samples derived from the oldest cambium collected at the base of the tree (L1–L4). They were characterized by higher cellulose content. In group B we observed that the metabolic profile of samples L2 and L4 was different from that of L1 and L3, L2 and L4 containing more G-lignin.
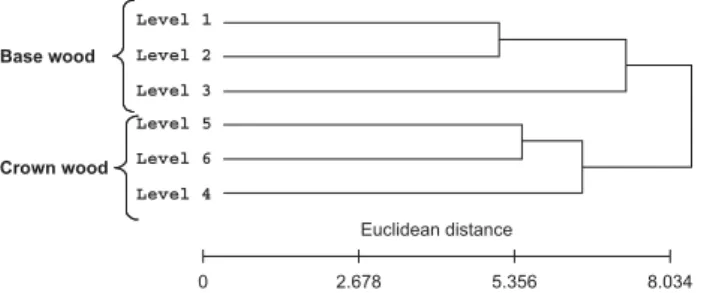
Environmental and genotypic effects on cell wall chemical composition To study the environmental and genotypic effects on cell wall chemical composition, pyrolysis was carried out on wood-forming tissue collected at the base and the crown of three unrelated individuals located in the same stands and sampled mid-May (therefore forming early wood). The first set of samples were collected from the 30-yr-old tree sampled in 2003, and the second set were collected from the two 33-yr-old trees sampled in 2006. A hierarchical clustering of the data (Fig. 4) first showed that these six samples clustered into two distinct sub-trees corresponding to each sampling year (2003 vs 2006), suggesting that climatic conditions had the strongest impact on cell wall chemical composition. Despite the sampling year, it was also found that the contrast between CW and BW samples was similar and was half as much as the distance between years. Finally, the distance between the two 2006 genotypes was much lower and comparable to that found between two consecutive cambial ages (L5 vs L6 or L0 vs L1). Molecular analysis of base and crown wood-forming tissues
Variability of transcript accumulation along the stem The same six samples from 2003 that were previously characterized at the chemical level were also analysed at the transcriptome level, using high-density filters (HDFs). The HDFs consisted of 3512 unique clones derived from a nonnormalized xylem cDNA library (Paiva, 2006). A total of 262 (7.5%) transcripts
Fig. 1 Min-max normalized spectra of differentiating xylem from L1 (base wood) to L6 (crown wood) showing the broad amide I and amide II bands.
Fig. 2 Variation of main classes of pyrolysis products along the stem, from the base (L1) to the crown (L6) of the tree sampled in 2003: aa1, toluene (amino acid content); cP, pentosans (hemicellulose origin); cH, hexoxanes (mainly from cellulose); c, other carbohydrates (mainly from hemicellulose origin); G, guaiacyl lignin (G) units. Standardized data, data for each pyrolysis product was normalized to a mean of 0 and standard deviation of 1.
were found to be differentially expressed along the stem. About 55.7% of the differentially expressed transcripts could be attributed to known functional proteins (BLASTX < 10−5
against the SwissProt database), 17.2% matched to proteins of unknown function (BLASTX e-value < 10–5 for sequence
homology with Arabidopsis unknown proteins), and 27.1% did not match any sequences in public databases and were therefore classified as putative proteins (BLASTX e-value > 10–5 or ‘no hit’). Such a high proportion can in part be
attributed to a lower sequence read length for the ‘putative protein’ category (436 bp on average vs 572 bp for known function proteins), but for some of the ESTs (e.g. ‘unknown function’ category characterized with a mean length of 576 bp), this is also likely to be the result of a general lack of information regarding the putative molecular mechanisms in which these genes are involved.
For differentially expressed genes, the fold-change ratio between maximum and minimum values varied between 1.3 and 3.9 (data available in Table S4). About 45% of these genes had a fold-change ratio below 1.6; 35.9% had a ratio varying between 1.6 and 2, whereas 19.1% of the genes had a ratio greater than 2. Among the 19 genes showing the largest changes in gene expression level (fold-change ratio higher than 2.5), we found a geranylgeranyl pyrophosphate synthetase (plastidial) (BX254083, 3.4-fold) and an α-tubulin (BX249184, 2.8-fold) both up-regulated in BW, an orthologue to a P. taeda water deficit inducible protein LP3/abscissic stress ripening protein (BX253505, 2.7-fold), and a GASA5-like protein (BX250252, 2.6-fold) both up-regulated in CW. Nine genes classified as putative proteins or those of unknown function were found among differentially expressed genes displaying the highest variation between the samples.
Fig. 3 Clustering of differentiating xylem samples (levels L1 to L6) according to their metabolic profiles and clustering of pyrolysis products. cH7, marker for cellulose content; aa1, marker for amino acid content (toluene). The scale bar adjacent to each dendogram represents the distance measurement used in the Expander software algorithm ((1 – Pearson correlation)/2). The colour scale bar represents the standardized content of pyrolysis products. For each pyrolysis product, data were standardized to give a mean of 0 and standard deviation of 1.
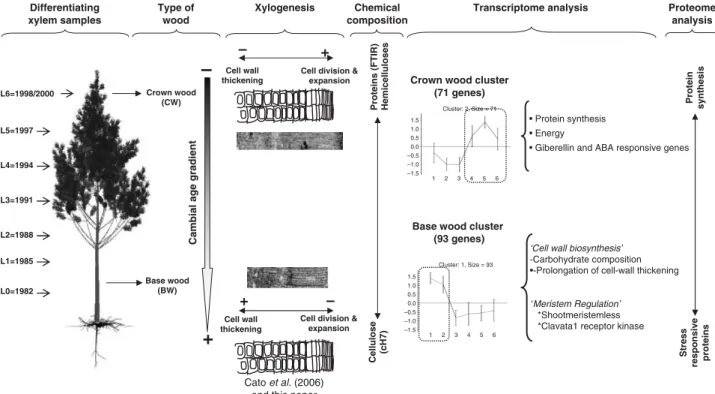
Epclust (http://www.bioinf.ebc.ee/EP/EP/EPCLUST/) was used to cluster the differentiating xylem samples according to their transcriptomic Euclidian distance. This was computed using log2 scaling data based on the 262 differentially expressed transcripts. Samples were found to cluster into two distinct sub-trees (Fig. 5), that is, one sub-tree corresponding to BW samples (L1, L2 and L3) and the other corresponding to CW samples (L4, L5 and L6).
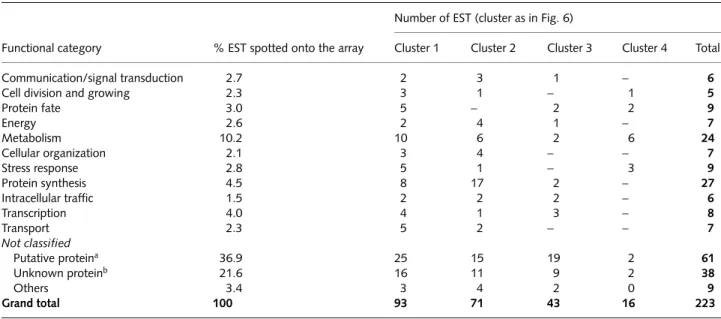
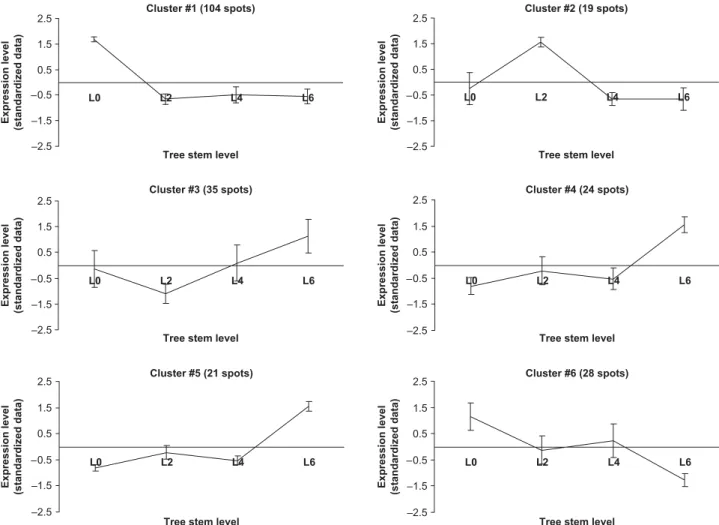
In order to summarize the complexity of the expressional data, differentially expressed genes were also clustered according to their expression profiles using the Click algorithm of Expander. Of the 262 genes, 223 were clustered into four groups (Fig. 6), with an average homogeneity of 0.885, and an average separation score of –0.295, which means that the expression profiles in each cluster were very homogeneous. Most of the genes were split into two clusters: clusters 1 and 2, comprising 35.5 and
27.1% of the differentially expressed genes, respectively. Cluster 3 (16.4%) and cluster 4 (6.1%) comprised 22.5% of the differentially expressed genes, whereas 39 genes remained as singletons.
Expressed sequence tags within each cluster could be split into 14 functional categories (Table 1). EMBL accessions, PGI tentative contigs (TC) and annotations (sorted by clusters and/or functional categories) are provided as supplementary data (Table S4).
Clusters 1 and 2 were particularly interesting because they displayed very distinct profiles. Transcripts of cluster 1 were over-expressed in samples L1 and L2, and were thus referred to as BW-related genes. Their accumulations strongly decreased at L3, whilst L3 to L6 maintained a relatively constant expression level. Amongst the known function genes with a fold-change ratio greater than 2, we found a subtilisin-like protease (BX255758, twofold), a cytochrome c1 precursor (BX253984, twofold), a 40S ribosomal protein S7 (BX255511, 2.1-fold), a 17.6 KDa class I HSP (BX251102, 2.6-fold), a gamma-thionin homolog precursor (BX254131, 2.2-fold), an ATP-binding cassette transporter (BX249573, 2.6-fold) and a SEC13 related protein (BX249772, 2.6-fold). Two genes with the highest ratios were for an α-tubulin (BX249184, 2.8-fold) and a geranylgeralypyrophosphate synthetase (BX250083, 3.4-fold). Interestingly, two transcripts involved in the meristematic regulation (Homeobox protein SHOOTMERISTEMLESS (BX254965, 1.5-fold), and the receptor kinase CLAVATA 1 (BX252322, 1.5-fold)) were also included in this cluster.
Cluster 2 included transcripts which were over-expressed in crown samples (L4, L5, L6), and were thus further referred to as CW-related genes. The CW cluster contained 71 transcripts, 37% corresponding to putative or unknown function proteins. Amongst the genes with known function, 38% were classified in the ‘protein synthesis’ category (corresponding mainly to ribosomal proteins). The ‘metabolism’ (13%), ‘energy’ (9%) and ‘cellular organization’ (9%) categories were also well represented. Amongst the genes of known function (with a fold-change ratio greater than two) we found four ribosomal proteins (BX251945, BX251256, BX250069, BX255250, 2.1- to 2.3-fold), a GASA5 like protein (BX250252, 2.6-fold) and a LP3 (ASR) protein (BX253505, 2.7-fold). Three genes of unknown function, which were among the most significant (BX255469, 2.9-fold; BX252990, 2.6-fold; and BX248868, 3.0-fold) were also found in this cluster.
Cluster 3 comprised 43 genes showing a rapid increase from L1 to L3, then a rapid decrease from L3 to L4. From L4 to L5 they maintained their expression, and finally slightly increased. Almost three-quarters of these genes were classified as putative proteins or as proteins of unknown function. ‘Transcription’ was the most represented category, with three genes, including an Avr9/Cf-9 rapidly elicited protein (BX253198, 1.7-fold), a glycine-rich RNA-binding protein 7 (BX250887, 1.8-fold), and a zinc finger protein (BX252274, 2.3-fold).
Fig. 4 Clustering of differentiating xylem according to their metabolic profiles. Samples were collected at the base (B) and the crown (C) of the of the three adult trees sampled in 2003 and 2006 (trees a and b) at the same period (mid-May) and in the same experimental field. The scale bar adjacent to each dendogram represents the distance measurement used in the Expander software algorithm ((1 – Pearson correlation)/2). The colour scale bars represent the relative standardized content of main classes of pyrolysis products. For each pyrolysis product class, data were standardized to give a mean of 0 and a standard deviation of 1.
Fig. 5 Clustering of differentiating xylem samples collected from the crown (L6) to the base (L1) of an adult tree sampled in 2003, according to their transcriptomic distance (Euclidian distance of log2 expression valued and UPGM algorithm).
Cluster 4 consisted of 16 genes, presenting two peaks of expression at L1 and L4, and low to very low levels of expression at L2, L3, L5 and L6. This cluster could also be considered as characteristic of BW-related genes. ‘Metabolism’ (37.5% of the genes) was the main functional category of this cluster, including, for example, a cellulose synthase (BX249248, 2.8-fold) and two chitinases (BX254139 and BX254191, 2.5- and 2.1-fold, respectively).
Variability of protein accumulation along the stem Two-dimensional gel-electrophoresis was used to analyse the proteome variation of wood-forming tissues along the trunk of the tree sampled in 2003. A reference 2D-E map was established using the proteins extracted from four differentiating xylem samples associated with the transition from BW formation (level L0) to CW formation (level L6). A total of 1372 spots were placed on the reference map that was further used to compare the
Fig. 6 Clustered mean expression profiles of differentially expressed genes along the trunk (tree sampled in 2003), from the bottom (level L1) to the crown (level L6). Clusters were obtained using the ‘Click’ function of the Expander software on standardized data (mean 0 and standard deviation 1). Error bars represent the standardized expression level variation within each level.
Table 1 Cluster distribution of the different functional categories of differentially expressed genes along the stem
Functional category % EST spotted onto the array
Number of EST (cluster as in Fig. 6)
Cluster 1 Cluster 2 Cluster 3 Cluster 4 Total
Communication/signal transduction 2.7 2 3 1 − 6
Cell division and growing 2.3 3 1 − 1 5
Protein fate 3.0 5 − 2 2 9 Energy 2.6 2 4 1 − 7 Metabolism 10.2 10 6 2 6 24 Cellular organization 2.1 3 4 − − 7 Stress response 2.8 5 1 − 3 9 Protein synthesis 4.5 8 17 2 − 27 Intracellular traffic 1.5 2 2 2 − 6 Transcription 4.0 4 1 3 − 8 Transport 2.3 5 2 − − 7 Not classified Putative proteina 36.9 25 15 19 2 61 Unknown proteinb 21.6 16 11 9 2 38 Others 3.4 3 4 2 0 9 Grand total 100 93 71 43 16 223
aPutative proteins (BLASTX e-value> 10−5 or ‘no hit’)
abundance of each spot/protein (spot volume) between the four levels. Statistical analysis using ANOVA allowed the detection of 231 spots, each showing significant differences between the four levels.
The 231 spots were clustered into six groups using the K-means algorithm of Expander software (Fig. 7). Clusters 1 and 6 comprised 45.0 and 12.1% of the spots showing maximum abundance at L0, that is, associated with the formation of BW. Conversely, clusters 3, 4 and 5 comprised 15.1, 10.4 and 9.1% of the spots presenting a maximum abundance at L6, that is, associated with the formation of CW. Cluster 2 presented a peak at L2.
A total of 33 spots were characterized by LC ESI MS/MS, representing spots over-expressed either in BW (22 spots) or CW (11 spots) samples. These spots (Fig. 8) were manually checked to ensure the selection of spots with high resolution and reproducibility between replicates. Table S5 summarizes the mass spectrometry results (also available at http:// www.cbib1.cbib.u-bordeaux2.fr/Protic/public/PublicMAP.php).
For half of the spots, more than one protein was identified, which could result from the comigration of proteins with similar electrophoretic properties, thus hindering their enu-meration and identification (Westbrook et al., 2001).
The BW clusters comprised mainly proteins of the defence and amino acid metabolism functional categories. Defence-related proteins included peroxidases (#1033, #1107, #445; 26-, 5.1- and 2.4-fold variation), heat-shock proteins (#974, #1163, #995; 85-, 18- and 10-fold) and a chaperonin (#184, 2.7-fold). The amino acid-related proteins, in particular, included those involved in methionine metabolism, that is, methionine synthase (#1057, 44-fold; #39, 7.1-fold), adenosylhomo-cysteinases (#352, 6.4-fold; #282, 1.5-fold), adenosylmethionine synthase (#405, 5.4-fold); and glutamine synthetase (#804, 3.0-fold). In addition, structural enzymes of cellwall poly-saccharides and lignin biosynthetic pathways were identified in the BW clusters. These included UDP-glucose dehydrogenase (#276, 75-fold), UTP-glucose-1-phosphate urydyltransferase (#225, 5-fold) and cinnamoyl-CoA reductase (#641, 2.5-fold).
Fig. 7 Clustered mean expression profiles of differentially expressed proteins along the trunk (tree sampled in 2003, levels L0, L2, L4 and L6). Clusters were obtained using the ‘K-means’ function of the Expander software on standardized data (mean 0 and standard variation 1). Error bars represent the standardized expression levels variation within each level.
Proteins involved in vesicular traffic (GTP-binding protein, Rab family (#1060, 6-fold) and Nucleosome assembly protein 1-like 1 (NAP-1 related protein) (#256, 4.3-fold) were also observed.
The CW clusters contained proteins of the defence category, such as glyoxalase I (#731, 6.2-fold) and heat-shock proteins (#1116, 4.6-fold; #96, 2.1-fold), two proteins of the energy category (RuBisco subunit binding protein (#188, 1.6-fold) and malate dehydrogenase (#728, 2.3-fold)), two cytoskeletal proteins (actin (#495, 6.2-fold) and β-2-tubulin (#718, 2.6-fold)), as well as two adenosylmethionine synthases (#483, 14.5-fold; and #505, threefold). For proteins preferentially expressed in CW, the highest fold-ratio was observed for a nascent polypeptide-associated complex (#1022, 24-fold). Genotypic and climatic effect on gene expression Quantitative real-time PCR (qPCR) was used to check whether or not differentially expressed genes between the crown and the base of the 2003 samples showed similar trends in 2006 (for both fold-change and rank). This investigation, using two different biological replicates (collected in 2006) and a different transcriptomic technology (qPCR), was carried out for 14 genes identified as differentially expressed in the 2003 samples: five genes more expressed in the crown (GASA5 (BX250252), LP3 protein (BX253505), and three unknown function genes (BX252990; BX255469, BX248868)) and nine genes more expressed in the base (17.6 kD HSP (BX251102), gamma-thionin (BX254131), ATP-binding cassette (BX249573), homebox STM (BX254965), betaine-aldehyde dehydrogenase (BX253899), phytoceramidase (BX249766), geranylgeranyl-diphosphate synthase (BX254083), SEC13-putative protein (BX249772) and cellulose synthase (BX249248)). qPCR results are presented as supplementary data (Fig. S6). While some genes (whose expression could be linked to the ontogenic effect) clearly displayed the same trend of gene expression along the
stem between the 2003 and 2006 samples, such as GASA5, gamma-thionin, and smwHSP (genes of known function), others did not match the 2003 results at all. It is likely that these genes were either responding to environmental conditions or corresponded to different members of the same multigene family cross-hybridizing in reverse northern, for example, cellulose synthases. These interpretations will be discussed further in the following section.
Discussion
We would like to highlight the importance of this study because it involves an extensive application of genomic tools (metabolome, transcriptome and proteome characterization) used to link phenotypic data with molecular mechanisms along the stem of wood-forming tissues. We only found a single reference (Cato et al., 2006) that attempted to link phenotypic data (cell wall thickness and radial growth and the proportion of developing xylem cell types) with gene expression in wood-forming tissues associated with both BW and CW in P. radiata.
In this section we will illustrate how the phenotypic plasticity observed along a base to crown gradient of a single tree could be interpreted in terms of molecular variation as revealed by gene and protein expression profiles obtained along the stem. We will the discuss to what extent these results can be generalized with other genotypes and climatic conditions. Anatomical and cell wall chemical composition versus gene expression along a base to crown gradient Carbohydrate and lignification-related genes are overexpressed in BW-forming tissue As expected, the variation of cellulose content along the stem was similar to that found in fully developed wood; that is, cellulose content was higher at the
Fig. 8 Two dimensional gel-electrophoresis (2D-E) maps of maritime pine wood-forming tissue. Proteins that were identified are marked with circles and numbered as in Table S5 (L0, base wood; L6, crown wood).
base of the stem where mature wood is formed. The increase in cellulose content results from the extension of secondary cell wall thickening. Cato et al. (2006) reported that over 30% of differentiating tracheids in BW-forming tissue produced secondary cell walls, compared with only 3% produced by the J/CW. Since secondary cell walls consist mainly of cellulose, the higher cellulose content in differentiating xylem at the base thus results in a thicker cell wall. Conversely, upper levels (L5 and L6) had lower cellulose content but higher content of hemicelluloses (Figs 2 and 3).
Two cellulose synthases (UDP-forming), PpinCesa3 (http:// cellwall.stanford.edu/) (BX250234, 1.8-fold) in cluster 1 and
PpinCesa11 (BX249248, 2.8-fold) in cluster 4, were found to
be preferentially expressed at the base of the tree, which is consistent with the higher cellulose content found in this tissue.
PpinCESA3 is 98% identical to PtCESA3, and PpinCESA1 is
97% identical to PtCESA2. PtCESA3 is an orthologue of
AtCESA7 (IRX3) and PtCESA1 is an orthologue of AtCESA8,
two genes known to be involved in secondary xylem formation in Arabidopsis thaliana. The sequence homology of these two genes suggests that both PpinCESA1 and PpinCESA3 could be involved in secondary cell wall thickening. Both transcripts were found to be differentially expressed in a panel of eight tissues of maritime pine (Paiva, 2006), but while PpinCESA1 was more expressed in differentiating xylem, PpinCESA3 was found to be preferentially expressed in other tissues. These results suggest different roles of these two cellulose synthases during the formation of the secondary cell wall. Proteins related to carbohydrate metabolism were also identified in the BW clusters, namely one UDP-glucose dehydrogenase (spot #276, 75-fold) and one UTP-glucose-1-phosphate urydyltransferase (spot #225, fivefold). Both enzymes have important roles in cell wall formation in higher plants. UTP-glucose-1-phosphate urydyltransferase produces UDP-glucose, which can be used in the biosynthesis of cellulose (reviewed by Kleczkowski et al., 2004). UDP-glucose can then be used by the UDP-glucose dehydrogenase to form UDP-glucoronate, a key precursor in hemicellulose and pectin formation (Seitz et al., 2000).
At the proteomic level we found that enzymes implicated in methionine metabolism were highly up-regulated in BW-forming tissues: namely methionine synthase (44-fold), adenosylhomocysteinase (6.4- and 1.5-fold), adenosylmethionine synthetase (SAM-S, 5.4-fold), and homocysteine methyl-transferase (7.1-fold). Methionine is involved in methylmethyl-transferase reactions as S-adenosylmethionine (SAM). The preferential abundance of these proteins in BW-forming tissues may reflect the higher demand for methyl transfer reactions required for the biosynthesis of monolignols. The importance of methylation associated with lignin biosynthesis is also corroborated by the higher expression of one of the lignification enzymes, CCoAOMT (2.5-fold), in BW-forming tissue. In terms of absolute value, more lignin is expected in BW-forming tissues because of the thicker cell walls of BW tracheids.
Prolongation of cell wall thickening in BW-forming tissue involved the up-regulation of defence-related genes One of the characteristics of tracheids from stem base is the presence of a thicker secondary cell wall (Zobel & Sprague, 1998). This thicker cell wall is more related to the duration of cell wall thickening than to the rate of cell wall biosynthesis (Larson
et al., 2001; Uggla et al., 2001; Cato et al., 2006).
We found that five genes of the ‘stress response’ category accumulated preferentially in BW-forming tissues (clusters 1 and 4 of Fig. 6), including a 17.6 kDA class I heat-shock protein (BX251102, 2.6-fold), a gamma-theonin precursor/ defensin (BX254131, 2.2-fold), a late embryogenesis protein (LEA; BX255424, 1.9-fold), a DNA damage regulation gene DDR48-stress protein (BX248943, 1.5-fold), and a disease resistance protein-like (BX255778, 1.5-fold).
In plants, low-molecular-weight heat-shock proteins (smwHSP) accumulate in response to various stresses (Vierling, 1991; Waters et al., 1996; Costa et al., 1998), and also seem to have specific roles in developmental processes, including seed maturation, somatic embryogenesis and wood formation (Puigderrajols et al., 1996, 2002; Pla et al., 1998; Le Provost
et al., 2003). In animals, expression of smwHSP during the
transition of cell division to differentiation has been related to a preventive role in differentiating cells from undergoing apoptosis (Arrigo, 2005). Gion et al. (2005) also observed that smwHSP proteins accumulated in BW-forming tissues and suggested that they played a role in prolonging the cell wall thickening phase of xylogenesis, by delaying entry into programmed cell death (PCD). Late embryogenesis proteins are a major group of proteins which are extremely stable and hydrophilic. They typically accumulate during the late stages of embryogenesis or in response to dehydration, low temperature, salinity or exogenous abscisic acid (ABA) treatments, thus indicating their responsiveness to cellular dehydration (Ramanjulu & Bartels, 2002). It has been proposed that LEA stabilize membranes and prevent crystallization of cellular components (Dure et al., 1989; Garay-Arroyo et al., 2000). Thionins are small, basic, cysteine-rich proteins, which may function as defence molecules against an array of plant pathogens (Florack & Stiekema, 1994; Broekaert et al., 1995). We report here for the first time on the up-regulation of these two genes in BW-forming tissues.
In agreement with the transcriptomic data, we also found that defence-related proteins were preferentially expressed in BW-forming tissues such as heat-shock proteins (spot #974, spot #1163, and spot #995, 85- 18- and 10-fold variation, respectively), peroxidases (spot #1033, spot #1107, and spot #445, 26-, 5.1- and 2.4-fold variation, respectively), universal stress protein (spot #805, 13-fold) and one chaperonin (spot #184, 2.7-fold).
The preferential expression of a higher number of stress-responsive proteins and other molecular mechanisms involved in PCD in BW-forming tissues fully agree with the results previously obtained at the proteome level by Gion et al.
(2005). Furthermore, this is consistent with the hypothesis that these genes could be involved in the delay of PCD, and thus in the prolongation of cell wall deposition, therefore resulting in the higher cell wall thickness and wood density characteristic of BW.
‘Protein synthesis’ and ‘energy’ related genes are more expressed in CW-forming tissue The greater protein content observed at the top of the tree may be the result of a higher rate of cell division, with more cells in the division and expansion stages, as shown by the microscopic observations. This result is consistent with that found in P. radiata, where cell division was 3.3 times greater in cambium of the crown compared with that of the base, even during the period of late wood formation (Cato et al., 2006). In Scots pines (Pinus sylvestris), Uggla et al. (2001) also reported that the rate and time of cell division and expansion were greater at the top of the tree than at the bottom.
The youngest vascular cambium is associated with CW formation and is characterized by a high rate of cell division and expansion (Uggla et al., 2001; Cato et al., 2006; this study). At the protein level we found two essential components of the cytoskeleton, an actin (spot #495, 6.2-fold) and a tubulin (β-2-tubulin; spot #718, 2.6-fold) preferentially expressed in CW-forming tissues. These cytoskeleton-related proteins might be involved in the control of cell division. In particular, actin filaments are responsible for many aspects of cell behaviour, such as cell division, intracellular movement and cell expansion. Cell division and expansion are highly demanding in terms of protein synthesis and energy requirements, as demonstrated by the higher protein content and number of genes included in cluster 2 (Fig. 6) classified into the ‘protein synthesis’ category (13 genes, mainly ribosomal proteins with fold-change ratios ranging from 1.6 to 2.3, while cluster 1 comprised only three ribosomal proteins with fold-change ratios of 1.6, 1.9 and 2). Interestingly, the protein with the highest CW/BW ratio was a nascent polypeptide-associated complex (spot #1022, 24-fold), demonstrating the importance of protein synthesis in CW. Similarly, but with a fold-change ratio equal to or less than 2, we found four genes up-regulated in the CW-forming tissues, suggesting a high demand for energy and metabolic needs. These genes were cytochrome-c oxidase (BX252991, twofold), ferredoxin III (BX252874, 1.8-fold), naphtoate synthase (EC 4.1.3.36, ubiquinone biosynthesis pathway, BX250373, 1.7-fold), and cytochrome c (BX251935, 1.6-fold). At the protein level, we also found two proteins of the ‘energy’ category: malate dehydrogenase (spot #728, 2.3-fold) and a RuBisco subunit binding protein (spot #188, 1.6-fold).
GA and ABA responsive genes are overexpressed in CW-forming tissue A gene encoding a GASA5-like protein (BX250252; TC58624, 2.6-fold) was up-regulated in CW-forming tissues. The GASA (for GA-stimulated) belongs to a widespread class of genes found in mono- and dicotyledonous
plants. They are all structurally related to the original gibberellins (GA) regulated GAST1 (GA-stimulated transcript 1) gene from tomato (Aubert et al., 1998). Gibberellins (GAs) constitute a class of tetracyclic diterpenoid acids involved in the regulation of major plant growth and developmental processes such as germination, cell elongation, expansion and division, flowering and fruit development (Richards et al., 2001). GAs act synergistically with auxin in stimulating cambial growth (Israelsson et al., 2005) and to provide positional information during wood development (Tuominem et al., 1997; Uggla
et al., 1998, 2001). Homologues of GAST1 have been shown
to be differentially expressed in different tissues of several species, for example: (i) histochemical analysis revealed that the
GASA4 promoter is active in meristematic regions, suggesting
a role in cell division (Aubert et al., 1998); (ii) GEG, a gerbera homolog of GAST1, was found to inhibit petal cell expansion, but to promote radial cell expansion (Kotilainen et al., 1999); (iii) the tomato RS1 is expressed in roots and induced by auxin (Taylor & Scheuring, 1994); (iv) GIPs (GA-induced genes of
Petunia) have been implicated in shoot elongation and
transition to flowering (Ben-Nissan et al., 2004); (v) in poplar, Israelsson et al. (2005) showed that the expression of a GIP-like1 gene dramatically increased (several hundred-fold) in expansion zones of wood-forming tissues, where the con-centration of bioactive GA was highest.
Another gene that could be implicated in cell wall expansion, is an orthologue of LP3 (ASR) (BX253505; TC73497, 2.7-fold) that was found to be up-regulated in CW-forming tissues. LP3 is a water deficit-induced protein, which is highly homologous to ASR (ABA, stress and ripening proteins). ASR is a small gene family demonstrating similarity with ABA, stress and ripening genes (Padmanabhan et al., 1997). Le Provost (2003) also reported in P. pinaster that a different member of the LP3 family, the P. pinaster LP3-1 (AJ300726, TC73079), was up-regulated 12-fold in BW compared with CW-forming tissues. The different expression patterns of these two LP3 members are likely to be the result of different functional roles. As LP3 genes are highly hydrophilic (Padmanabhan et al., 1997) they might be implicated in the regulation of cell water potential during the cell expansion phase.
A BLAST search of BX255469 against the EMBL public database revealed this accession matched with a gene of unknown function in Oryza sativa (accession AK062043, e-value= 9e−37) and Arabidopsis thaliana (accession NM127873, e-value= 1e−33). These genes were found to be implicated in gibberellin (Matsui et al., 2005) and drought stress (Yazaki et al., 2004) responses in rice and Arabidopsis respectively. The coregulation of GASA5, LP3 and BX255469 suggests a main role of the cross-talk between GA- and ABA-responsive genes in the regulation of crown wood formation, in particular during the cell division and expansion stages.
Genetic and climatic effects on phenotypic and molecular ‘base to crown’ variation An important finding of this study