Blackwell Publishing Ltd Oxford, UK NPH New Phytologist 0028-646X
© The Authors (2008). Journal compilation © New Phytologist (2008) 2367
10.1111/j. 1469-8137.2008.02367.x January 2008 00348??? 357??? Original Articles
XX XX
In field-grown coffee trees source–sink manipulation
alters photosynthetic rates, independently of carbon
metabolism, via alterations in stomatal function
Fábio M. DaMatta
1, Roberto L. Cunha
1, Werner C. Antunes
1, Samuel C. V. Martins
1, Wagner L. Araujo
1,
Alisdair R. Fernie
2and Gustavo A. B. K. Moraes
11Departamento de Biologia Vegetal, Universidade Federal de Viçosa, 36570-000 Viçosa, MG, Brasil; 2Max-Planck-Institute for Molecular Plant Physiology,
Am Muelenberg 1, 14476 Potsdam-Golm, Germany
Summary
• Perturbations of the source–sink balances were performed in field-grown coffee
(Coffea arabica) trees to investigate the possible role of carbohydrates in feedback
regulation of photosynthesis.
• Four treatments were applied at the whole-plant level: (i) complete defruiting and maintenance of the full leaf area, (ii) the half crop load and full leaf area, (iii) the full crop load and full leaf area and (iv) the full crop load and half leaf area. Sampling and measurements were performed twice during the phase of dry matter accumulation of fruits. Gas exchange, chlorophyll a fluorescence, carbon isotope labelling and steady-state metabolite measurements were assessed in source leaves.
• The average rate of net photosynthetic rate (A) and stomatal conductance (gs) were larger (>50%), and carbon isotope composition ratio was lower, in trees with
a full crop load and half leaf area than in defruited trees, with individuals of the other two treatments showing intermediate values. However, differences in A seem unlikely to have been caused either by photochemical impairments or a direct end-product-mediated feedback down-regulation of photosynthesis.
• It is proposed that the decreased A in defruited coffee trees was independent of carbon metabolism and was rather directly related to a lower CO2 availability coupled to lower gs.
Key words: carbon metabolism, Coffea arabica, gas exchange, photosynthesis, source–sink manipulation, stomatal conductance.
New Phytologist (2008) 178: 348–357
© The Authors (2008). Journal compilation © New Phytologist (2008)
doi: 10.1111/j.1469-8137.2007.02367.x Author for correspondence:
Fabio M. DaMatta Tel:+55 31 3899 1291 Fax:+55 31 3899 2580 Email: [email protected]
Received: 13 November 2007 Accepted: 11 December 2007
Introduction
The pivotal influence of sink activity on photosynthesis and carbon (C) partitioning has been well documented in several woody species, including citrus (Iglesias et al., 2002; Rivas
et al., 2007), mango (Urban et al., 2004a), coffee (Franck
et al., 2006) and peach (Li et al., 2007; Duan et al., 2008). Under conditions of decreased sink demand, end-product accumulation in source leaves is often understood to be the
observed to cause an effect on A irrespective of whether it results in an accumulation of end products (see, for example, Lunn & Hatch, 1995; Nautiyal et al., 1999). Moreover, if A is depressed by a direct feedback mechanism, photo-synthesis and the activities of related key biosynthetic enzymes should decrease as end-products accumulate under decreasing source demand, but this has not always been observed (see, for example, Li et al., 2007). Collectively, this conflicting information casts doubt as to whether decreased sink demand decreases A by direct feedback through carbohydrate accumulation, which is a clear factor influencing photosynthetic rates in other environmental conditions such as growth in elevated CO2 (Stitt, 1991). As
an alternative to end-product limitation, it is feasible that when A decreases as a result of weakened sink activity, partial stomatal closure, in response to changes in intercellular CO2 concentration (Ci) (Wünsche et al., 2005), may cause
increased leaf temperature (TL). If this temperature change
shifts the TL above the optimum for photosynthesis it
is conceivable that it could damage the structure of photosystem II (PSII) and thereby impair A (Li et al., 2007; Duan et al., 2008).
In coffee (Coffea arabica), the activity of source photo-synthetic production and sink demand appear to be highly coordinated. For example, Cannell (1971) found that when coffee trees were completely deblossomed, A
decreased by c. 30%, whilst Vaast et al. (2005) showed that A was 60% lower in girdled, defruited branches than in girdled branches bearing a high crop load. Franck
et al. (2006) noted a negative correlation between A and total soluble sugars and concluded, from sucrose-feeding experiments, that the source–sink down-regulation of A in leaves from girdled coffee branches is mediated by sucrose content in the phloem of source leaves. By contrast, DaMatta et al. (1997) found that starch accumulation was associated with decreases in A, whilst Ronchi et al. (2006), working with potted coffee displaying variant source-to-sink ratios, demonstrated that A did not correlate with starch, sucrose or hexoses but rather correlated inversely with the hexose-to-amino acid ratio. The latter finding was in accordance with the observation of Paul & Pellny (2003), that A is dependent on active pools of both C and nitrogen (N) rather than merely the carbohydrate status alone.
In the current study, source–sink imbalances were ana-lysed via controlled defoliation and defruiting experiments, which were anticipated to modulate C assimilation and assim-ilate partitioning in field-grown coffee trees. We combined data of both gas exchange and chlorophyll a fluorescence measurements, in addition to C isotope labelling and steady-state metabolite measurements, in order to improve our understanding of the long-term effects of source–sink manipulation on photosynthesis and the process that governs photosynthetic metabolism.
Materials and Methods
Plant material and growth conditions
The experiment was carried out under field conditions with 10-yr-old trees of coffee (C. arabica L. ‘Catuaí Vermelho IAC 44’) growing as a hedgerow (east–west orientation) on a red-yellowish oxisol, in Viçosa (20°45′S, 42°15′W, 650 m above sea level), south-eastern Brazil. The site is characterized by a subtropical climate with a mean annual temperature of 19°C. It receives an average rainfall of 1200 mm, chiefly distributed from October to March. The trees were cultivated in full sunlight and were planted at a spacing of 3.0×1.0 m. They were trained with three to four orthotropic branches and received routine agricultural practices for commercial coffee bean production, including hoeing, fertilization and chemical control of insects and pathogens. No supplemental irrigation was provided, but there was abundant rain during the weeks preceding measure-ments. Twenty-four trees were selected based on their uniformity with regard to height and number of orthotropic branches.
Treatments and experimental design
The experiment was conducted during the 2005/2006 growing season. Four treatments were applied on a whole-plant level on 5 December 2005, when trees bore pinhead fruits (a stage of negligible fruit growth): (i) complete defruiting and full leaf area; (ii) half crop load and full leaf area; (iii) full crop load and full leaf area (unmanaged trees); and (iv) full crop load and half leaf area. For convenience, these treatments are hereafter referred to as T1, T2, T3 and T4, respectively. For each plant, six plagiotropic branches were tagged. These branches had 12–14 fully expanded leaves and 100–120 fruits. To improve uniformity (i.e. similar leaf area-to-fruit ratios within each treatment), the tagged branches were managed in order to bear six or 12 expanded leaves and 0, 50 or 100 fruits, according to the treatments. Unless otherwise indicated, samplings and measurements were made on cloudless days during 23–25 January 2006 and 21–23 March 2006, occasions in which the trees bore fruits in their linear phase of dry matter accumulation (assessed by evaluating fruit mass changes at 15-d intervals using an extra sample of plants). The youngest, fully expanded leaves, corresponding to the third or fourth pair from the apex of plagiotropic branches, were used.
Environment and leaf temperature
The incident photosynthetic active radiation (PAR) intercepted by leaves (in their natural angle) and the TL were measured
were monitored daily from a meteorological station located
c. 2000 m from the coffee plantation.
Growth parameters
Branch growth and leaf area were monitored at 30-d intervals during the growing season until 23 March 2006. Fruits were harvested from the mentioned tagged branches, as well as from the remaining branches, when the majority of fruits were ripe (end-May 2006). Fruits were dried according to standard agronomic practices until their humidity content reached
c. 13%. Fruit mass and fruit fall were also assessed.
Photosynthetic measurements
Leaves were tagged for repeated measurements to be taken during the day. Natural leaf angles were maintained as far as possible during the measurements, which were conducted under ambient CO2, light and temperature conditions. The net photosynthetic rate (A), stomatal conductance (gs), and internal-to-ambient CO2 concentration ratio (Ci/Ca) were measured during the day using the infrared gas analyser described under ‘Environment and leaf temperature’. In addition, using a portable pulse amplitude modulation fluorometer (FMS2; Hansatech, Kings Lynn, UK), minimum (F0) and maximum (FM) dark-adapted (30 min) fluorescence was measured, from which the variable-to-maximum fluorescence ratio (FV/FM), in which FV=F
M–F0,
was calculated. This ratio has been used as a measure of the potential photochemical efficiency of PSII. The photochemical quenching coefficient (qP) and the quantum yield of PSII electron transport (Φ
PSII) were calculated as described in
DaMatta et al. (2002) using a 1 s pulse of saturating light of 6000 µmol m−2s−1
.
Biochemical analyses
Biochemical analyses (amino acids, carbohydrates (glucose, fructose, sucrose and starch), phosphorylated intermediates (glucose-1-P, glucose-6-P, fructose-6-P and inorganic phosphate (Pi)), and activities of enzymes (sucrose-phosphate synthase (SPS, EC 2.4.1.14), fructose-1,6-bisphosphatase (FBPase, EC 3.1.3.11), Rubisco (EC 4.1.1.39), ADP-glucose pyro-phosphorylase (AGPase, EC 2.2.7.27), NADP-dependent glyceraldehyde-3-phosphate dehydrogenase (NADP-GADPH, EC 1.2.1.12), acid invertase (EC 3.2.1.26), sucrose synthase (SuSy, EC 2.4.1.13) and starch phosphorylase (SPase, EC 2.4.1.1)) were assayed as previously described (Praxedes et al., 2006; Ronchi et al., 2006). Ribulose-1,5-bisphosphate was quantified according to Pieters et al. (2001). For all these analyses, leaf discs were collected after gas-exchange measurements (08:00–09:00 h, when photosynthetic rates were maximal), flash frozen in liquid nitrogen and stored at −80°C until analysed. Previous experiments
revealed that both carbohydrate concentrations and enzyme activities were quite similar, irrespective of whether leaves were sampled at 08:00–09:00 h or at 13:00–14:00 h. Each replicate represented the mean of three determinations on the same sample.
Incubation of leaf discs with 14CO
2 and fractionation of 14C-labelled tissue extracts
Leaves were detached from the mother plant early in the morning, re-cut under water to prevent xylemic embolism and immediately brought to the laboratory with their petioles immersed in water. This material was used for the 14
C-labelling pattern of carbohydrates and other cellular constituents, which was performed by illuminating leaf discs (10 mm in diameter) in a leaf chamber (LD2/2; Hansatech) under a saturating CO2 partial pressure (approx. 5 kPa) at a PAR of 1000 µmol photons m−2s−1
at 35°C for 30 min. Previous assays showed that incorporated radioactivity was maximal at that temperature. The CO2 was supplied from 400 µl of 1m
NaH14CO
3 (specific activity of 1.96 GBq mmol −1
), pH 9.3, placed on a felt mat at the base of the leaf chamber. Leaf discs were then flash frozen and stored at –80°C until required.
Frozen leaf tissues were extracted successively for 10 min at 100°C in an aqueous ethanolic series consisting of 2 ml of 80% (v/v) ethanol, 50% (v/v) ethanol, 20% (v/v) ethanol, H2O and finally 80% (v/v) ethanol. The supernatants were combined and lyophilised. The ethanol-insoluble fraction (comprising cell-wall components, protein and starch) was separated from the soluble fraction. Components of the soluble fraction were resuspended in 2 ml of H2O and sep-arated into neutral (soluble sugars), anionic (organic acids) and cationic (amino acids) subfractions by ion-exchange chromatography. The incorporated radioactivity in these fractions was assessed using a liquid scintillation analyser (Beckman LS 6500; Beckman Instruments, Fullerton, CA, USA). Further details have been previously documented (Fernie et al., 2001).
Other assays
Leaf tissues were oven dried for 72 h at 70°C after which total N and the stable C isotope ratio (δ13C) were measured, as
described previously (DaMatta et al., 1999, 2002).
Statistical analyses
Data were statistically examined using analysis of variance and tested for differences in significance (P<0.05) using Newman– Keuls and F tests. The means presented in the Tables and Figures were obtained from six independent replications per treatment of single tree experimental plots. All statistical analyses were performed using the saeg System version 8.0
Results
Growth attributes are presented in Table 1. The branch growth rate decreased with decreasing source : sink ratio, although it did not differ significantly between T3 (full crop load and full leaf area) and T4 (full crop load and half leaf area) trees. For obvious reasons, the leaf : fruit ratio was lower in T4 trees and larger in T2 (half crop load and full leaf area) trees, with intermediate values in T3 individuals. The extent of fruit abscission was 13.4% in T2 trees compared with c. 25% both in T3 and T4 trees, whereas the mean fruit mass decreased significantly as the leaf : fruit ratio decreased. These results largely explain why the total crop yield was only 28% lower in T2 trees than in nondefruited individuals. It is worth noting that the extent of partially empty (malformed) fruits was 34% in T4 trees in comparison to 20% in T2 and T3 plants (data not shown).
The PAR intercepted by leaves under the conditions described in the present experiment was generally higher than the saturating irradiance for coffee (approx. 600 µmol photons m−2s−1
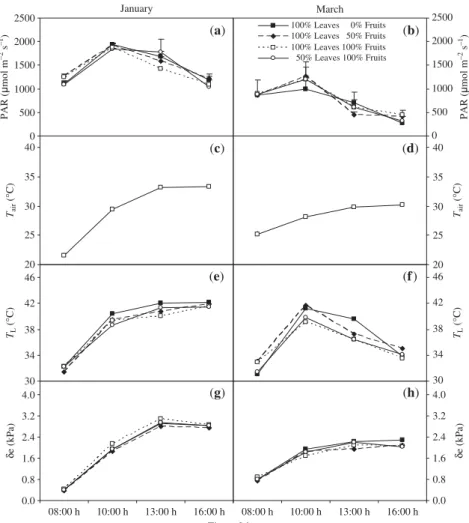
) (Fig. 1a,b). On average, air temperature (Tair), TL and δe were higher in January than in March. During the diurnal period, TL reached values as high as, or even above,
40°C, particularly in January. At 10:00 h and 13:00 h T
L
tended to be higher in T1 (complete defruiting and full leaf area) trees, especially in March when differences of up to 3°C were recorded when comparing these trees with those of the other treatments. By contrast, there were no significant differences in δe among the leaves, regardless of the applied treatments.
The overall pattern of gas exchange was characterized by low rates of A and gs, particularly after mid-morning when both TL and δe were particularly elevated. On several samplings, a trend for larger A and gs with decreasing leaf area : fruit ratio was found, especially for T4 trees (Fig. 2a–d). Irrespective of treatment, A and gs were only modestly correlated to one another other in January (r=0.253, P<0.05), but a stronger correlation between these variables was found in March (r=0.912, P<0.001; data not shown). These results suggest that part of the fluctuations of A could be explained by changes in gs. It should be emphasized that, integrated over the course of the day, T4 trees had larger (>50%) A and g
s
values than T1 trees, with T2 and T3 individuals showing intermediate values of A and gs (but without differing signifi-cantly) compared with T1 and T4 trees (Fig. 2a–d). Differences in both A and gs, detected in instantaneous gas-exchange
Fig. 1 The effect of source–sink imbalances
performed through controlled defoliation and defruiting in field-grown coffee (Coffea arabica) trees on the time-course of intercepted photosynthetic active radiation (PAR) by leaves (a,b), air temperature, Tair (c,d), leaf temperature, TL (e,f), and
leaf-to-air vapour pressure deficit, δe (g,h). Measurements were made twice (January and March) during the linear phase of dry matter accumulation of fruits. Each point represents the mean of six replicates. Vertical bars denote the SE; when not shown, the
measurements, were also reflected in the long term: δ13C was
significantly more negative in T3 and T4 than in T1 trees, with T2 trees showing intermediate δ13C values (Fig. 3).
Some changes in Ci/Ca ratios were evident, but were not consistently associated with source–sink imbalances (Fig. 2e,f ). It should be emphasized that differences in A were largely unrelated to the FV/FM ratio, which was maintained at or above 0.8 during the day, regardless of the treatment applied. Changes in A were also unrelated to PSII photochemistry in light-adapted leaves because little, if any, changes were observed in Φ
PSII and qP (Fig. 4).
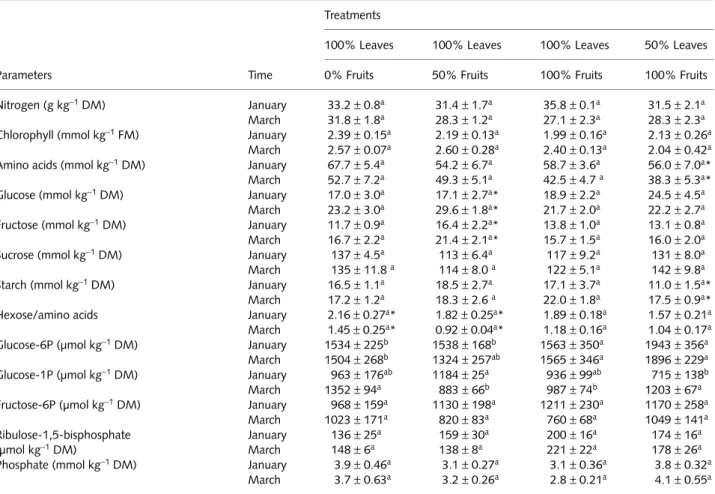
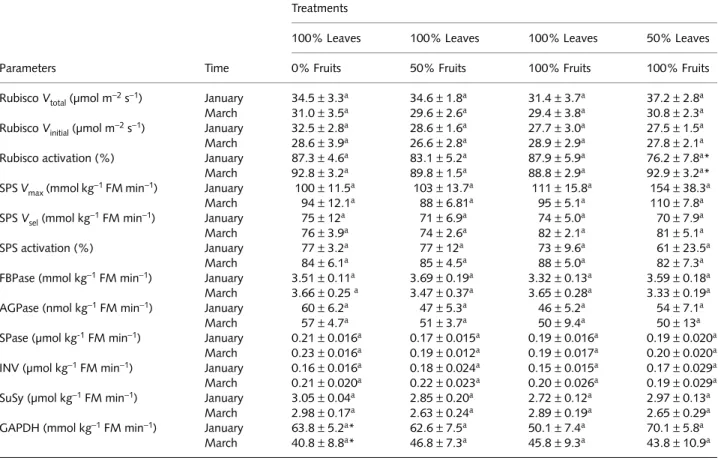
Leaf concentrations of N, chlorophyll(a+b), glucose, fruc-tose, sucrose, starch, glucose-6-P, glucose-1-P, fructose-6-P, Pi and ribulose-1,5-bisphosphate all remained unchanged in response to the applied treatments (Table 2). Similarly, the activities of Rubisco (total and initial activities, and activation state), SPS (maximum and selective assays, and activation state), FBPase, AGPase, SPase, invertase, SuSy, and NADP-GAPDH were also unresponsive to source–sink manipulation (Table 3). Overall, there were larger seasonal changes in these parameters than there were as a result of the experimental treatments described in this paper.
Table 1 The effect of source–sink imbalances performed through controlled defoliation and defruiting on growth parameters in field-grown
coffee (Coffea arabica) trees
Parameters
Treatments
100% Leaves 100% Leaves 100% Leaves 50% Leaves
0% Fruits 50% Fruits 100% Fruits 100% Fruits
Branch growth (mm d−1) 1.21±0.11a 0.63±0.06b 0.44±0.04c 0.41±0.04c
Leaf area-to-fruit ratio (cm2 per fruit) – 13.4±2.2a 7.7±1.3b 4.7±1.0c
Total yield (g) – 1485±137b 2050±201a 2075±213a
Fruit mass (g per 100 fruits) – 65±1.6a 52±1.1b 47±0.9c
Fruit fall (%) – 13.4±4.2b 24.6±3.9a 24.9±3.6a
Different upper case letters denote significant differences among means for each parameter (P<0.05, Newman–Keuls’ test). n=6±SE.
Fig. 2The effect of source–sink imbalances
performed through controlled defoliation and defruiting in field-grown coffee (Coffea arabica) trees on the time-course of net photosynthetic rate, A (a,b), stomatal conductance, gs (c,d), and
internal-to-ambient CO2 concentration ratio, Ci/Ca (e,f).
Measurements were made twice (January and March) during the linear phase of dry matter accumulation of fruits. Each point represents the mean of six replicates. Vertical bars denote SE; when not shown, the SE was smaller than the symbols. In the insets, mean diurnal values of A, gs, and the Ci/Ca ratio are shown.
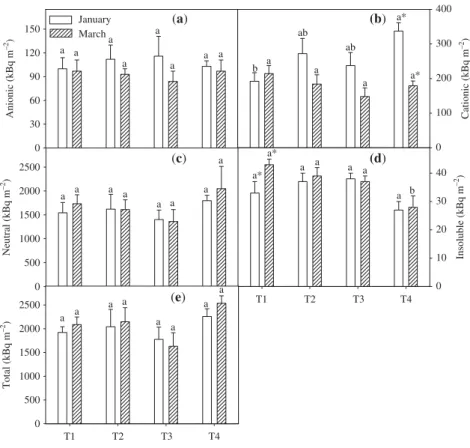
The rate of 14CO
2 uptake in leaf discs isolated from the
experimentally treated plants suggested that there was no change in response to source–sink imbalances (Fig. 5). Only slight changes in the partitioning of the recently fixed 14C
were observed between the various experimental treatments,
such as that seen in the redistribution of radiolabel to amino acids. Irrespective of the experimental treatment, approx. 5% of the 14CO
2 assimilated was recovered in organic acids,
9–13% in amino acids, 80% in soluble sugars and only 1.6% in insoluble components such as starch.
Discussion
In this study, leaf area and fruit burden were manipulated in coffee trees in the absence of perturbation of other functional sinks such as roots and branches. This experimental mani-pulation was chosen as it probably mimics the normal growth conditions of intact coffee trees that often experience large biennial fluctuations in both vegetative and reproductive growth (DaMatta, 2004). In fact, fruits, which are by far the strongest carbohydrate sinks in coffee (Cannell, 1976), remarkably restrained the vegetative growth. For obvious reasons, competition between vegetative and reproductive organs increased with decreasing leaf area : fruit ratio, and variations in total crop load and fruit mass among fruiting treatments not only depended on the source strength but also on the sink strength of competing organs. However, for all fruiting treatments, a relatively high proportion of malformed fruits were found, even in T2 trees. Thus, it seems unlikely that fruit demand for assimilates is completely met by carbohydrates produced in source leaves. This may be a consequence of insufficient leaf area because the maximum leaf area : fruit ratio we found (13.4 cm2 per fruit) was below
Fig. 3 The effect of source–sink imbalances performed through
controlled defoliation and defruiting (T1, complete defruiting and full leaf area; T2, half crop load and full leaf area; T3, full crop load and full leaf area; and T4, full crop load and half leaf area) in field-grown coffee (Coffea arabica) trees on the carbon isotope composition ratio (δ13C). Measurements were made twice (January, open bars; and
March, hatched bars) during the linear phase of dry matter accumulation of fruits. Different letters denote significant differences among means within each time (P<0.05, Newman–Keuls’ test). n=6±SE.
Fig. 4 The effect of source–sink imbalances
performed through controlled defoliation and defruiting in field-grown coffee (Coffea arabica) trees on the time-course of variable to maximum chlorophyll fluorescence ratio, FV/FM (a,b), photochemical quenching
coefficient, qP (c,d), and quantum yield of photosystem II electron transport, Φ
PSII (e,f).
the minimum presumably required (20 cm2 per fruit;
Cannell, 1976) to sustain the normal development of one fruit of coffee. At first glance, the above results largely explain the similar leaf carbohydrate concentrations, regardless of differences in leaf : fruit ratio. Even in the most contrasting treatments (T1 and T4 trees) leaf carbohydrate concentrations were quite similar, in part because the A in T1 trees was lower, but also because vegetative growth may have acted as a sink with sufficient strength to prevent carbohydrate accumulation in the leaves. From the above it follows that absolute differences in overall sink strength among treatments are narrower than previously expected. This hypothesis lends some support to explain why significant differences in A were observed only when comparing the treatments with the most divergent source : sink ratios.
The positive effect of crop load on A is consistent with previous observations for coffee (Cannell, 1976; Vaast et al., 2005; Franck et al., 2006). Such an effect was likely to have
been mediated by an increase in gs. Compelling evidence for this assumption is provided by the C isotope discrimination pattern and the 14CO
2 feeding studies. Larger isotope
dis-crimination (more negative δ13C) can arise because of high g s
or low A (Farquhar et al., 1989). Therefore, the observed decreases in δ13C with decreasing leaf : fruit ratio reflect a
proportionally larger increase in gs than in A in the long term. Furthermore, as δ13C reflects the internal CO
2 availability
being tightly negatively correlated with the Ci/Ca ratio (Farquhar et al., 1989), we propose that the long-term increases in A should have mainly occurred as a function of greater CO2 availability associated with larger gs. It should be noted that the contribution of potential differences in mesophyll capacity for CO2 fixation towards the observed differences in A may be ruled out because the rate of 14CO
2
assimilation (assessed under saturating CO2 and as such in the absence of diffusion-mediated limitations of photosynthesis) was unaffected by the imposed treatments.
Table 2 The effect of source–sink imbalances performed through controlled defoliation and defruiting in field-grown coffee (Coffea arabica)
trees on the concentrations of nitrogen, pigments, amino acids, carbohydrates, phosphorylated intermediates and phosphate
Parameters Time
Treatments
100% Leaves 100% Leaves 100% Leaves 50% Leaves
0% Fruits 50% Fruits 100% Fruits 100% Fruits
Nitrogen (g kg−1 DM) January 33.2±0.8a 31.4±1.7a 35.8±0.1a 31.5±2.1a
March 31.8±1.8a 28.3±1.2a 27.1±2.3a 28.3±2.3a
Chlorophyll (mmol kg−1 FM) January 2.39±0.15a 2.19±0.13a 1.99±0.16a 2.13±0.26a
March 2.57±0.07a 2.60±0.28a 2.40±0.13a 2.04±0.42a
Amino acids (mmol kg−1 DM) January 67.7±5.4a 54.2±6.7a 58.7±3.6a 56.0±7.0a*
March 52.7±7.2a 49.3±5.1a 42.5±4.7 a 38.3±5.3a*
Glucose (mmol kg−1 DM) January 17.0±3.0a 17.1±2.7a* 18.9±2.2a 24.5±4.5a
March 23.2±3.0a 29.6±1.8a* 21.7±2.0a 22.2±2.7a
Fructose (mmol kg−1 DM) January 11.7±0.9a 16.4±2.2a* 13.8±1.0a 13.1±0.8a
March 16.7±2.2a 21.4±2.1a* 15.7±1.5a 16.0±2.0a
Sucrose (mmol kg−1 DM) January 137±4.5a 113±6.4a 117±9.2a 131±8.0a
March 135±11.8 a 114±8.0 a 122±5.1a 142±9.8a
Starch (mmol kg−1 DM) January 16.5±1.1a 18.5±2.7a 17.1±3.7a 11.0±1.5a*
March 17.2±1.2a 18.3±2.6 a 22.0±1.8a 17.5±0.9a*
Hexose/amino acids January 2.16±0.27a* 1.82±0.25a* 1.89±0.18a 1.57±0.21a
March 1.45±0.25a* 0.92±0.04a* 1.18±0.16a 1.04±0.17a
Glucose-6P (µmol kg−1 DM) January 1534±225b 1538±168b 1563±350a 1943±356a
March 1504±268b 1324±257ab 1565±346a 1896±229a
Glucose-1P (µmol kg−1 DM) January 963±176ab 1184±25a 936±99ab 715±138b
March 1352±94a 883±66b 987±74b 1203±67a
Fructose-6P (µmol kg−1 DM) January 968±159a 1130±198a 1211±230a 1170±258a
March 1023±171a 820±83a 760±68a 1049±141a
Ribulose-1,5-bisphosphate (µmol kg−1 DM)
January 136±25a 159±30a 200±16a 174±16a
March 148±6a 138±8a 221±22a 178±26a
Phosphate (mmol kg−1 DM) January 3.9±0.46a 3.1±0.27a 3.1±0.36a 3.8±0.32a
March 3.7±0.63a 3.2±0.26a 2.8±0.21a 4.1±0.55a
Measurements were made twice (January and March) during the linear phase of dry matter accumulation of fruits.
Different upper case letters denote significant differences among means within each time (P<0.05, Newman–Keuls’ test). Asterisks represent significant difference for a given parameter within sampling dates (F test, P<0.05). n=6±SE.
Differences in gs in response to source–sink manipulation
were probably unrelated to differences in Ci because in several
samplings larger gs values were not accompanied by a lower Ci/ Ca ratio. Similar results have been previously reported for
other species (Urban et al., 2004a; Li et al., 2007). In any case, increased gs allowed increased transpiration rates (data not
shown), which would largely explain the decreased TL, as
particularly found in T3 and T4 trees during the warmer periods of the day. Lower TL, in turn, may lead to lower
respiration and photorespiration rates (Lambers et al., 1998), which would ultimately exacerbate the differences in A as a function of differences in leaf : fruit ratio.
Source–sink manipulations may also alter the fluorescence kinetics of chlorophyll a. This has previously been observed in citrus (Syvertsen et al., 2003; Rivas et al., 2007) and mango (Urban et al., 2004b), and postulated in coffee (Franck et al., 2006). In peach, Li et al. (2007) proposed that higher TL,
associated with low gs and limited sink demand, impaired
photosynthesis through effects on PSII reaction centres. By contrast, we have no evidence that decreased A was associated with the photoinhibition of photosynthesis because the FV/ FM ratio during the day was near or within the optimal range
(0.80–0.83 found in unstressed leaves of higher plants) reported by Björkman & Demmig (1987). In addition, differences in A were also unrelated to either qP or ΦPSII, and
hence to electron transport rate.
The changes in A were rather unlikely to result from direct feedback control because the concentrations of hexose, sucrose and starch, and the hexose : amino acid ratio, were unaffected by the imposed treatments. Accordingly, the maximum extractable activities of enzymes involved in starch metabolism (AGPase and SPase), sucrose metabolism (SPS, FBPase, acid invertase and SuSy) and photosynthetic path-ways (Rubisco and NADP-GAPDH), the activation state of
Table 3 The effect of source–sink imbalances performed through controlled defoliation and defruiting in field-grown coffee trees on the activities
of some enzymes associated with carbon metabolism: (Rubisco: total (Vtotal) and initial (Vinitial) activities, and activation state), sucrose-phosphate
synthase (SPS; maximum (Vmax) and selective (Vsel) activities, and activation state), fructose-1,6-bisphosphatase (FBPase), ADP-glucose
pyrophosphorylase (AGPase), starch phosphorylase (SPase), invertase (INV), sucrose synthase (SuSy) and NADP-dependent glyceraldehyde-3-phosphate dehydrogenase (GAPDH)
Parameters Time
Treatments
100% Leaves 100% Leaves 100% Leaves 50% Leaves
0% Fruits 50% Fruits 100% Fruits 100% Fruits
Rubisco Vtotal (µmol m
−2 s−1) January 34.5±3.3a 34.6±1.8a 31.4±3.7a 37.2 ± 2.8a
March 31.0±3.5a 29.6±2.6a 29.4±3.8a 30.8±2.3a
Rubisco Vinitial (µmol m
−2 s−1) January 32.5±2.8a 28.6±1.6a 27.7±3.0a 27.5±1.5a
March 28.6±3.9a 26.6±2.8a 28.9±2.9a 27.8±2.1a
Rubisco activation (%) January 87.3±4.6a 83.1±5.2a 87.9±5.9a 76.2±7.8a*
March 92.8±3.2a 89.8±1.5a 88.8±2.9a 92.9±3.2a*
SPS Vmax (mmol kg
−1 FM min−1) January 100±11.5a 103±13.7a 111±15.8a 154±38.3a
March 94±12.1a 88±6.81a 95±5.1a 110±7.8a
SPS Vsel (mmol kg
−1 FM min−1) January 75±12a 71±6.9a 74±5.0a 70±7.9a
March 76±3.9a 74±2.6a 82±2.1a 81±5.1a
SPS activation (%) January 77±3.2a 77±12a 73±9.6a 61±23.5a
March 84±6.1a 85±4.5a 88±5.0a 82±7.3a
FBPase (mmol kg−1 FM min−1) January 3.51±0.11a 3.69±0.19a 3.32±0.13a 3.59±0.18a
March 3.66±0.25 a 3.47±0.37a 3.65±0.28a 3.33±0.19a
AGPase (nmol kg−1 FM min−1) January 60±6.2a 47±5.3a 46±5.2a 54±7.1a
March 57±4.7a 51±3.7a 50±9.4a 50±13a
SPase (µmol kg-1 FM min−1) January 0.21±0.016a 0.17±0.015a 0.19±0.016a 0.19±0.020a
March 0.23±0.016a 0.19±0.012a 0.19±0.017a 0.20±0.020a
INV (µmol kg−1 FM min−1) January 0.16±0.016a 0.18±0.024a 0.15±0.015a 0.17±0.029a
March 0.21±0.020a 0.22±0.023a 0.20±0.026a 0.19±0.029a
SuSy (µmol kg−1 FM min−1) January 3.05±0.04a 2.85±0.20a 2.72±0.12a 2.97±0.13a
March 2.98±0.17a 2.63±0.24a 2.89±0.19a 2.65±0.29a
GAPDH (mmol kg−1 FM min−1) January 63.8±5.2a* 62.6±7.5a 50.1±7.4a 70.1±5.8a
March 40.8±8.8a* 46.8±7.3a 45.8±9.3a 43.8±10.9a
Measurements were made twice (January and March) during the linear phase of dry matter accumulation of fruits.
Different upper case letters denote significant differences among means within each time (P<0.05, Newman–Keuls’ test). Asterisks represent significant difference for a given parameter within sampling dates (F test, P<0.05). n=6±SE.
SPS and Rubisco, and the concentrations of hexose-P and Pi all remained unaltered, as did the actual amount and proportion of 14CO
2 diverted to the major photosynthetic fluxes. In any
case, the photosynthetic apparatus clearly worked towards maintenance of a large export capacity. However, in contrast to our previous studies using young coffee plants grown in pots (Praxedes et al., 2006; Ronchi et al., 2006), we found, in the current study, a lower starch : sucrose ratio that was associated with a lower AGPase activity and higher FBPase and SPS activities (coupled to a higher SPS activation state), even in defruited trees. These results are consistent with the proportion of newly fixed 14CO
2 partitioned in favour of
sucrose at the expense of starch. Taken together, these findings provide further support for the assumption that differences in sink strength among the treatments were relatively narrow, in addition to suggesting that changes in A in response to source–sink manipulation occurred without major changes in C metabolism.
In this study, we showed compelling evidence that the decreased A in defruited trees was largely unrelated to either photochemical impairments or direct feedback mechanisms mediated by end-product accumulation, or to a lower potential capacity of mesophyll cells to fix CO2. Instead, the decreased
A was a consequence of lower CO2 availability for photosyn-thesis coupled to lower gs. Similar results were found by Nunes-Nesi et al. (2007) working with transgenic tomato plants with reduction in mitochondrial activity; these plants
demonstrated decreases in A that resulted from an impaired stomatal function with relatively little alteration in overall leaf metabolism, with the exception that they displayed altered starch and hexose concentrations.
In trees, decreases in gs, associated with or without changes in Ci, with increased source : sink ratio have been reported elsewhere (e.g. Kochhar et al., 2003; Zhou & Quebedeaux, 2003; Urban et al., 2004a; Wünsche et al., 2005; Li et al., 2007; Duan et al., 2008), but this response has been invariably linked to end-product accumulation. In this sense, C meta-bolism may thus directly or indirectly be associated with decreased gs, and by extension A, under low-sink strength conditions (although gs is not always tightly linked to A, as shown in tobacco with antisense decrease of Rubisco (von Caemmerer et al., 2004)). By contrast, the present study, to the best of our knowledge, is the first to provide evidence that changes in gs may take place independently of C metabolism. The exact mechanism by which the high crop load induced increases in gs remains as yet unknown; however, it seems rea-sonable to anticipate that this is related to an as-yet-undefined signal associated with sink strength.
Acknowledgements
This research was partially funded by the Minas Gerais State Research Foundation, Brazil. Scholarships granted by CAPES (R. L. Cunha) and by CNPq (S. C. V. Martins, W. L. Araujo,
Fig. 5The effect of source–sink imbalances
performed through controlled defoliation and defruiting (T1, complete defruiting and full leaf area; T2, half crop load and full leaf area; T3, full crop load and full leaf area; and T4, full crop load and half leaf area) in field-grown coffee (Coffea arabica) trees on the partitioning of 14C-labelled leaf tissues into
W. C. Antunes and G. A. B. K. Moraes), both from the Brazilian Government, are gratefully acknowledged.
References
Björkman O, Demmig B. 1987. Photon yield of O2 evolution and
chlorophyll fluorescence characteristics at 77K among vascular plants of diverse origins. Planta 170: 489–504.
von Caemmerer S, Lawson T, Oxborough K, Baker NR, Andrews TJ, Raines CA. 2004. Stomatal conductance does not correlate with photosynthetic capacity in transgenic tobacco with reduced amounts of Rubisco. Journal of Experimental Botany 55: 1157–1166. Cannell MGR. 1971. Effects of fruiting, defoliation and ring-barking on the
accumulation and distribution of dry matter in branches of Coffea arabica
L. in Kenya. Experimental Agriculture 7: 63 –74.
Cannell MGR. 1976. Crop physiological aspects of coffee bean yield. A review. Kenya Coffee 41: 245–253.
DaMatta FM. 2004. Ecophysiological constraints on the production of shaded and unshaded coffee: a review. Field Crops Research 86: 99–114. DaMatta FM, Amaral JAT, Rena AB. 1999. Growth periodicity in trees of
Coffea arabica L. in relation to nitrogen supply and nitrate reductase activity. Field Crops Research 60: 223 –229.
DaMatta FM, Loos RA, Silva EA, Loureiro ME. 2002. Limitations to photosynthesis in Coffea canephora as a result of nitrogen and water availability. Journal of Plant Physiology 159: 975–981.
DaMatta FM, Maestri M, Mosquim PR, Barros RS. 1997. Photosynthesis in coffee (Coffea arabica and C. canephora) as affected by winter and summer conditions. Plant Science 128: 43–50.
Duan W, Fan PG, Wang LJ, Li WD, Yan ST, Li SW. 2008. Photosynthetic response to low sink demand after fruit removal in relation to photoinhibition and photoprotection in peach trees. Tree Physiology 28: 123 –132. Farquhar GD, Ehleringer JR, Hubik KT. 1989. Carbon isotope
discrimination and photosynthesis. Annual Review of Plant Physiology and Plant Molecular Biology 40: 503–537.
Fernie AR, Roessner U, Trethewey RN, Willmitzer L. 2001. The contribution of plastidial phosphoglucomutase to the control of starch synthesis within the potato tuber. Planta 213: 418–426.
Franck N, Vaast P, Génard M, Dauzat J. 2006. Soluble sugars mediate sink feedback down-regulation of leaf photosynthesis in field-grown Coffea arabica. Tree Physiology 26: 517–525.
Iglesias JD, Lliso I, Tadeo FR, Talon M. 2002. Regulation of photosynthesis through source:sink imbalances in citrus is mediated by carbohydrate content in leaves. Physiologia Plantarum 116: 53–572.
Kochhar A, Ap Rees T, Pollock CJ. 2003. Assimilate partitioning in leaves of the raffinose-storing herb Lamium album L.: the effects of altering source–sink balance. Revista Brasileira de Botânica 26: 533–540. Lambers H, Chapin III FS, Pons TL. 1998. Plant physiological ecology.
New York, NY, USA: Springer.
Landsberg JJ. 1986. Physiological ecology of forest production. Orlando, FL, USA: Academic Press.
Li WD, Duan W, Fan PG, Yan ST, Li SH. 2007. Photosynthesis in response to sink–source activity and in relation to end products and activities of metabolic enzymes in peach trees. Tree Physiology 27: 1307–1318. Lunn JE, Hatch MD. 1995. Primary partitioning and storage of
photosynthate in sucrose and starch in leaves of C4 plants. Planta 197:
385–391.
Nafziger ED, Koller HR. 1976. Influence of leaf starch concentration on CO2 assimilation in soybean. Plant Physiology 57: 560 –563.
Nautiyal PC, Ravindra V, Joshi YC. 1999. Net photosynthetic rate in peanut (Arachis hypogea L.): influence of leaf position, time of day, and reproductive sink. Photosynthetica 36: 129–138.
Nunes-Nesi A, Carrari F, Gibon Y, Sulpice R, Lytovchenko A, Fisahn J, Graham J, Ratcliffe RJ, Sweetlove JL, Fernie AR. 2007. Deficiency of mitochondrial fumarase activity in tomato plants impairs photosynthesis via an effect on stomatal function. Plant Journal 50: 1093 –1106. Paul MJ, Pellny TK. 2003. Carbon metabolite feedback regulation of leaf
photosynthesis and development. Journal of Experimental Botany
54: 539–547.
Pieters AJ, Paul MJ, Lawlor DW. 2001. Low sink demand limits photosynthesis under Pi deficiency. Journal of Experimental Botany 52:
1083–1091.
Praxedes SC, DaMatta FM, Loureiro ME, Ferrão MAG, Cordeiro AT. 2006. Effects of long-term soil drought on photosynthesis and carbohydrate metabolism in mature robusta coffee (Coffea canephora
Pierre var. kouillou) leaves. Environmental and Experimental Botany 56: 263–273.
Rivas F, Gravina A, Augustí M. 2007. Girdling effects on fruit set and quantum yield efficiency of PSII in two Citrus cultivars. Tree Physiology 27: 527–535.
Ronchi CP, DaMatta FM, Batista KD, Moraes GABK, Loureiro ME, Ducatti C. 2006. Growth and photosynthetic down-regulation in Coffea arabica in response to restricted root volume. Functional Plant Biology 33: 1013–1023.
saeg – Sistema para Análises Estatísticas. 1999. Version 8.0. Viçosa, Brazil: Fundação Arthur Bernardes.
Sheen J. 1990. Metabolic repression of transcription in plants. Plant Cell 10: 1027–1038.
Stitt M. 1991. Rising CO2 levels and their potential significance for carbon
flow in photosynthetic cells. Plant, Cell & Environment 14: 741–762. Syvertsen JP, Goñi C, Otero A. 2003. Fruit load and canopy shading affect
leaf characteristics and net gas Exchange of ‘Spring’ navel orange trees. Tree Physiology 23: 899–906.
Urban L, Léchaudel M, Lu P. 2004a. Effect of fruit load and girdling on leaf photosynthesis in Mangifera indica L. Journal of Experimental Botany 55: 2075–2085.
Urban L, Lu P, Thibaud R. 2004b. Inhibitory effect of flowering and early fruit growth on leaf photosynthesis in mango. Tree Physiology 24: 387–399.
Vaast P, Angrand J, Franck N, Dauzat J, Génard M. 2005. Fruit load and branch ring-barking affect carbon allocation and photosynthesis of leaf and fruit of Coffea arabica in the field. Tree Physiology
25: 753–760.
Wünsche JN, Greer DH, Laing WA, Palmer JW. 2005. Physiological and biochemical leaf and tree responses to crop load in apple. Tree Physiology
25: 1253–1263.