Agrometeorology |
Article
based on leaf area index
Antonio Roberto Pereira (1*); Marcelo Bento Paes de Camargo (2);Nilson Augusto Villa Nova (1)
(1) ESALQ/USP, Departamento de Engenharia de Biossistemas, Av Padua Dias 11, 13418-900 Piracicaba (SP), Brasil.
(2)Instituto Agronômico, Centro de Pesquisa e Desenvolvimento de Ecofisiologia e Biofísica, Caixa Postal 28, 13001-970 Campinas
(SP), Brasil.
(*) Corresponding author: [email protected]
Received: October 25, 2010; Accepted: April 19, 2011.
Abstract
Crop coefficient (Kc) for coffee plantations was found to be linearly related to the leaf area index (L) up to 3, i.e., Kc = b L. The basic assumption is that for irrigated trees the water use per unit leaf area (ETLA) is equal to the reference evapo
-transpiration (ETo) expressed also on a unit leaf area basis of the reference surface (ETLA = ETo/Lo). As recommended by
FAO-56 the leaf area index (Lo) for the hypothetical reference surface (grass) is equal to 2.88, then the most likely value is b = Lo-1 = 2.88-1 = 0.347. However, for L > 3 (completely covered ground surface) Kc decreased from a peak value (~1.05) tend -ing to an asymptotic low value around 0.7 for L > 6, but the linear model gives unrealistic Kc estimates; tentatively the empiri
-cal function Kc = 1.8 L-0.5 is offered here as an initial guess due to the lack of experimental results for the interval 3.5 <L < 5.5. To become operational under commercial fields it is necessary to estimate the leaf area per coffee tree (LA, m2tree-1), and based on a very limited set of data, LA was estimated as a function of planting density (PD, trees ha-1), i.e., LA = 88.38 – 8.63 Ln (PD). Alternatively, L (< 3.4) can be computed directly as a function of canopy volume (for V < 1.2 m3).
Key words: Coffea arábica L., reference evapotranspiration, soil water balance, planting density.
Coeficiente de cultivo de cafezais com base no índice de área foliar para irrigação de
precisão
Resumo
Observou-se que o coeficiente de cultivo (Kc) para cafezais relacionou-se linearmente com o índice de área foliar (L), ou seja, Kc
= b L para L < 3. A premissa básica é que para árvores irrigadas, o consumo hídrico por unidade de área foliar (ET
LA) é igual à evapotranspiração de referência (ETo) expressa também por unidade de área foliar da superfície de referência (ETLA = ETo/Lo). Como Lo = 2,88 é o valor recomendado pelo boletim FAO-56 para o índice de área foliar da hipotética superfície de referência (gramado), então o valor mais provável é b = Lo-1 = 2,88-1 = 0,347. No entanto, para
L > 3 (cobertura total do terreno) observa-se que Kc diminuiu progressivamente do valor de pico (~1,05) tendendo assintoticamente a um valor mínimo ao redor de 0,7 com L > 6, mas o modelo linear superestima Kc grosseiramente; uma função empírica (Kc = 1,8 L-0,5) é apresentada apenas como tentativa inicial, visto que não há resultados experimentais para 3,5 < L < 5,5. Para ser operacional em condições comerciais é necessário estimar a área foliar por cafeeiro (LA, m2planta-1), e com base em um conjunto bem limitado de observações foi estimada em função da densidade de plantio (PD, plantas ha-1), i.e.,
LA = 88,38 – 8,63 Ln (PD). Como alternativa, L (< 3,4) pode ser calculado diretamente como uma função do volume da copa (V < 1,2 m3).
Palavras-chave: Coffea arábica L., evapotranspiração de referência, balanço hídrico do solo, densidade de plantio.
1. IntroductIon
A world-wide shortage of fresh water is pushing the expanding agricultural production systems to improve and minimize the water use in irrigations. Nowadays irrigation is considered as the largest single consumer of water for human purpose. Consequently, to become en-vironmentally sustainable an irrigated agronomic system needs to improve its management of water. Precision irrigations depend heavily on reliable estimates of water use by the plants on real-time. Crop evapotranspiration
(ETc) estimates are commonly computed through the adjustment of a reference evapotranspiration (ETo) by an empirical crop coefficient (Kc), that is, ETc = Kc ETo.
Under the same weather conditions of the crop ETo
can be estimated by many methods (Doorenbos and Pruitt, 1977; Allen et al., 1998) and the one most suitable for a region depends on the availability of wea-ther stations measurements.
are also presented to help the use of such approach in irrigations schemes of commercial coffee fields.
2. MaterIal and Methods
The experiment was performed on a sprinkler irrigated young coffee plantation in order to detect the effect of the growing plant leaf area on the crop coefficient (Kc). Arabic cultivar Mundo Novo IAC 388-17 grafted on Apoatã IAC 2258 was planted on a 2.5 m by 1.0 m spa-cing (4000 plants ha-1) on a Rhodic Kandiudalf clay tex-ture soil. The experimental site was located in Piracicaba, São Paulo, Brazil (22° 42′ S, 48° 39′ W, 511 m asl). To avoid soil water deficit weekly irrigations replaced the accumulated reference evapotranspiration (ETo, mm d-1) given by a Class A pan evaporation (EA, mm d-1) in a stan-dard weather station about 200 m away (ETo = EAKp). For each period the pan coefficient (Kp) was estimated by the equation of Snyder (1992) with a fixed grass buffer area (= 10 m), and averages wind speed and relative humi-dity at 2 m above the grass surface of the nearby weather station.
Field measurements began 15 months after transplan-tation (8/1998) and lasted until the coffee plants were 40 months old (9/2000). Soil water balance was performed taking soil samples for water content down to the 0.6 m depth (including 100% of the roots) in two symmetric po-sitions below 2 trees canopies and about 0.2 m from the tree trunk. This procedure was repeated after 3 to 5 days to compute the average water used (ETc) by the trees during the time interval. The time interval was determined by the weather forecast to avoid disturbing rainfalls. After the se-cond soil sampling all leaves of the two trees were collected and the total leaf areas were digitally measured by an area meter (LI-COR model 3100). Leaf area index (L) at each time was calculated taking the crop spacing (2.5 m2) as the available ground area for the tree.
For each period the average ETc (L tree-1 d-1) was assu-med to be equal to the change in the volumetric soil water content (m3 m-3 d-1) times the soil volume (m3). Soil volu-me varied with crop age and it was defined by the surface area covered by the canopy times de 0.6 m depth as roots of frequently irrigated coffee trees seldom go deeper than such depth (Favarin et al., 2001). The coffee crop was kept free of weeds to ensure that the soil water depletion was due mainly to the tree transpiration. To compute the crop coefficient (Kc) values the ETc was converted to mm d-1 (i.e., L tree-1 d-1/m2 of ground tree-1 = L m-2 of ground d-1 = mm d-1) considering the crop spacing.
Results from Gutiérrez and Meinzer (1994a) ob-tained in Hawaiian coffee fields were incorporated in the analysis in order to have Kc values for crops with L
up to 7.5. Re-analysis of available literature data and sults, even with other species, were incorporated and
re-Kc integrates both tree transpiration and soil evaporation. The FAO guidelines for computing crop water require-ments recommends fixed values for two conditions of coffee cultivations, that is, Kc = 0.9 if kept free of weeds, otherwise Kc = 1.1 (Allen et al., 1998). However, for ara-bic coffee trees growing in a high altitude tropical climate of Ruiru, Kenya, monthly mean values of Kc varied from
0.5 (during dry season) to 0.8 (during rainfall season) with ETo measured by a sunken pan (Pereira, 1957). For the same location Blore (1966) found Kc = 0.86 taking 10-day averages during the wet season without soil water deficits.
An approach used in Zimbabwe allows Kc to vary with age/size/planting arrangement of trees as it is defined as the ratio of the canopy area to the planted area (Carr, 2001). Camargo and Pereira (1994) recommend that
Kc be estimated as 1.2 times the fraction of ground
sha-ded by coffee trees around noontime to allow for values above 1.0, the limit for completely shaded ground area, and for seasonal leaf area changes. Similarly, the water use for a grapevine orchard (Williams and Ayars, 2005) and for an isolated peach tree (Goodwin et al., 2006) was found to be linearly related to the shaded area casted on the ground beneath the canopy around noontime. For grapevines Kc was linearly related to the leaf area index (L) up to 4.5 (Williams et al., 2003; Williams and Ayars, 2005; Netzer et al., 2009). Theoretically it is more cor-rect to use L then shaded area as it represents the ratio of the total canopy leaf area to the planted area (Ritchie and Burnett, 1971; Fuchs et al., 1987; Al-Kaisi et al., 1989). Even though more difficult to operate in real-ti-me irrigations schereal-ti-mes this approach considers the total effective transpiring leaf area.
For a young and growing coffee crop with 4 000 plants ha-1 it has been found by Villa Nova et al. (2002) that Kc is well represented by a fixed proportion of L (up
to 3.4), that is, Kc = 0.347 L. However, the nowadays
co-ffee cultivations tend to have high planting rates (hedge-rows) and sometimes L approaches extremely high values (> 7.5); obviously, under such growing system such linear relationship will give unrealistic Kc values (= 2.6). It will be shown here that Kc = 0.347 L is theoretically sound as the 0.347 coefficient can be deduced from the assump-tion that water use per unit leaf area is similar for different species under the same atmospheric demand (ETo).
interpreted to substantiate the discussion and to define thresholds. Graphical and statistical comparisons were performed to substantiate the discussion of the results whenever enough data are available.
3. results and dIscussIon
Results obtained during the Piracicaba experiment are summarized in table 1. The water use (ETc) increased from 0.2 mm d-1 to about 4 mm d-1 as the coffee trees aged from 15 to 40 months-old. At the beginning the co-ffee trees were very small and each one had about 0.67 m2 of leaf area (LA); but, at the end of the experiment they had grown up to over 7 m2 per tree. The leaf area in-dex (L) varied from 0.27 up to 3. During such period Kc
increased continuously from 0.1 to about 1.0 associated with the increase in LA. Both, Kc and LA increased pro-portionally by a factor of 10.
As the transpiring area increases the water use has to increase proportionally in the same weather conditions if soil water is not limited. This was observed in a short-term (6-day) de-branching experiment with a peach tree (Goodwin et al., 2006). One way to eliminate the effect of the tree size on the transpiration rate is to express the water use on a unit leaf area basis (ETLA), or leaf water effi-ciency (Hatton et al., 1998). This way it can be seen that, regardless of the coffee tree size (leaf area), ETLA had simi-lar values during periods with simisimi-lar ETo. For instance, comparing periods when the trees had very distinctive leaf areas (e.g., at 15 and 25 mo-old) but were under similar
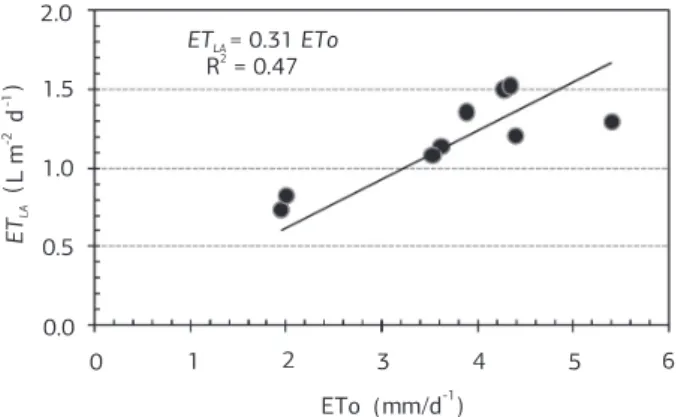
ETo values (1.95 and 2.0 mm d-1, respectively) they had almost identical values of ETLA (i.e., 0.75 and 0.82 L m-2 leaf area d-1). The same occurred at ages 17 and 35 mo-old when ETo of 3.62 and 3.53 mm d-1 resulted, respec-tively, in ETLA of 1.14 and 1.09 L m-2 d-1. Consequently, a simple linear regression analysis forced through the origin (Figure 1) shows that a linear equation describes conveniently the results, i.e., ETLA = 0.31 (± 0.05) ETo
(R2 = 0.47; n = 9; the largest ETo value disturbed R2 but not the b coefficient). This indicates that the water use per unit leaf area was about 1/3 of ETo.
It is interesting to note that the present results is substantiated by those obtained previously with different plant species such as grapefruit in Israel (Cohen, 1991), grapevine grown in California, USA (Fig 9 in Williams and Ayars, 2005) and in Israel (Fig 4 in Netzer et al., 2009), apple, olives, walnut, Asian pear, and grapevines grown in New Zealand and Spain (Pereira et al., 2006; Fernández et al., 2008), and Tahiti acid lime in Brazil (Pereira and Villa Nova, 2009). Such results with very distinctive crops show that ETLA becomes independent of plant size and tend to merge in a unique linear rela-tionship of ETo. Indeed there was a very narrow range of the regression coefficients (0.34 to 0.36) for each tree (Pereira et al. 2006; Pereira and Villa Nova, 2009).
Another important aspect to observe is that the empi-rical regression coefficients discussed above can be derived theoretically if it is assumed that the water use per unit leaf area of the irrigated trees (ETLA) is equal to the reference evapotranspiration (ETo) also expressed per unit leaf area of the reference surface (Lo), i.e., ETLA = ETo/Lo (Villa Nova et al., 2002; Pereira et al., 2006). The reference surface was defined by Allen et al. (1998) as a hypothe-tical grass field with constant Lo = 2.88. Consequently, the most likely value for the linear regression coefficient is 2.88-1 = 0.347. Therefore, Kc = 0.347 L, as proposed by Villa Nova et al. (2002), is theoretically sound for orchard
Figure 1. Linear regression between water use per unit leaf area
(ETLA) and reference evapotranspiration (ETo).
-1
-2
-1
( )
(
)
Table 1. Time variation of water use (ETc), reference evapotranspiration (ETo), crop coefficient (Kc), leaf area (LA), leaf area index (L), and
water use per unit leaf area (ETLA) of young irrigated arabic coffee trees in Piracicaba (SP) Brazil
Crop Age (months)
ETo
(mm d-1)
ETc
(mm d-1)
Kc
---LA
(m2 tree-1)
L
---ETLA
(L m-2 d-1)
15 1.95 0.20 0.10 0.67 0.27 0.75
17 3.62 0.66 0.18 1.45 0.58 1.14
20 5.40 0.87 0.16 1.69 0.68 1.29
22 4.28 1.62 0.38 2.71 1.08 1.49
25 2.00 1.50 0.75 4.55 1.82 0.82
28 4.34 2.80 0.65 4.61 1.84 1.52
30 4.40 2.81 0.64 5.86 2.34 1.20
35 3.53 3.68 1.04 8.53 3.41 1.09
and isolated trees (Pereira et al., 2006; Fernández et al., 2008).
However, for coffee plantations such linear model for
Kc is limited to L≤ 3 as shown in figure 2. Such limitation becomes evident only after inclusion in the analysis of the results of Gutiérrez and Meinzer (1994a) obtained in drip-irrigated commercial coffee fields in Hawaii where L
values were up to 7.5. Considering both sets of data, as L
grew above 3, Kc values decreased from a peak (~ 1.05) tending asymptotically to a low value around 0.7 for
L < 6. Due to a lack of data for the interval 3.5 < L < 5.5 the equation Kc = 1.8 L-0.5 is suggested here merely as an attempt to provide an empirical description of the rela-tionship (no statistics).
It can be inferred that the Kc = 0.86 for Ruiru’s co-ffee described by Blore (1966) was probably for L ≈ 4.
This last figure can also be estimated by the empirical re-lationship presented below associating leaf area per plant (~26 m2) with the number of plants per ha (2.7 m by 2.7 m ≈ 1371 plants ha-1). As L increases above 3 part of the canopy becomes self-shaded reducing the amount of leaves exposed directly to the solar radiation reducing the transpirative power of the canopy. This effect was
Figure 2. Coffee crop coefficient (Kc) as affected by leaf area index
(L). G&M94 = results from Gutiérrez and Meinzer (1994a).
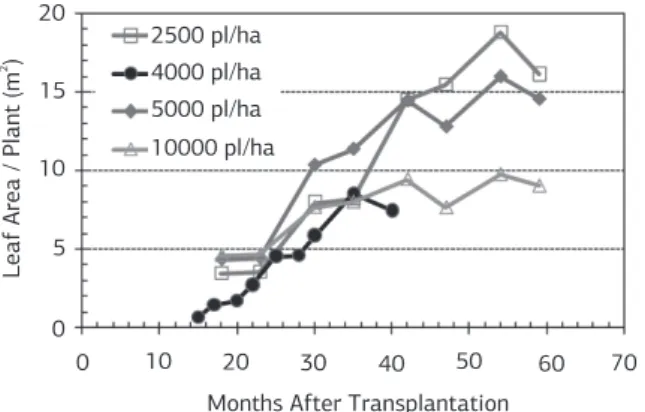
Figure 3. Time variation of the leaf area per plant of coffee plantations with different planting density. (Adapted from Valencia, 1973; including data from table 1).
demonstrated experimentally in a grapevine by Williams and Ayars (2005) when a sudden artificial raise of the leaf curtain, while L remained the same, abruptly incre-ased the water use from 42 L d-1 to over 60 L d-1 and Kc jumped from 0.9 to 1.3. Also in grapevines Netzer et al. (2009), in Israel, observed a leveling and even a small reduction in water use at L > 4 with a corresponding
de-crease in Kc.
For the Hawaiian coffee plantations Gutiérrez and Meinzer (1994a) found that for L > 4 tree transpiration became the dominant term in the water use, and that soil evaporation was negligible for L > 6.7. As the coffee ca-nopy grew and shaded the ground most of the day less solar radiation reached the ground decreasing the soil eva-poration and increasing transpiration. Such behavior was observed micrometeorologically in terms of energy balan-ces along the growing season (Gutiérrez and Meinzer, 1994b). Their results show that ETc consumed about 40% of the available net radiation for L < 4, but the proportion jumped suddenly to around 60% for L > 4. It was conclu-ded that the mature coffee hedgerows at high L behaved more like closed forest canopies than widely spaced annu-al crops. Indeed, results from Tausend et annu-al. (2000) with three contrasting coffee canopy architectures indicate that aerodynamically the canopy tends to become less coupled to the atmospheric conditions as L approaches 4. In other
words, the turbulence within the canopy decreases and weakens the interaction with the atmosphere. Such results are substantiated theoretically with numerical simulations of canopy flows showing that the aerodynamic roughness of the plant canopy decreases with increase in L above a threshold (Shaw and Pereira, 1982). Based on the many converging results discussed above it is here inferred that the roughness of coffee plantation decreases substantially for L > 3.
To become operational the present Kc model needs an
easy way to estimate the coffee tree leaf area. Leaf areas of co-ffee plantations are rarely reported but a very few displaying time variations along the seasons are available for arabica cv. Caturra (Valencia, 1973), and Apoatã IAC-2258 (Villa Nova et al., 2002) and they are summarized in Figure 3. Regardless of the cultivar the leaf area growth after trans-plantation to the field shows the same pattern along the time. Maximum leaf area per plant tends to be reached after 3 to 5 years and it is determined by the planting den-sity (PD, number of plants per ha). Data from Valencia
extended for another growing season but the maximum leaf area per plant did not double and reached about 15 to 16 m2. For another 50% reduction in the number of trees (2500 plants ha-1) the leaf area increased even less achieving between 16 and 19 m2.
Considering that the maximum leaf area (LA, m2 tree-1) for coffee trees is reached around 60 mo-old (Figure 3) it was possible to come up the following em-pirical relationship of planting density (PD, plants ha-1):
LA = 88.38 – 8.63 Ln (PD). (Note: no statistical signifi-cance due to small number of data points). For the sake of comparisons with the restricted data set now available such equation predicts 21 m2 for 2500, 15 m2 for 5000, and 9 m2 for 10000 plants ha-1. For the independent sets (not used in the equation fit) it predicts 17 m2 for 4000 plants ha-1, a maximum value very close to the 15.6 ± 3.3 m2 reported by Gutiérrez and Meinzer (1994a) for an Yellow Catuaí field. For PD = 816 plants ha-1 (3.5 m by 3.5 m) the predicted leaf area is about 31 m2, a value very close to 32 m2 (average of 7 trees) reported by Franco and Inforzato (1950) for 40-yr-old arabica cv. Bourbon at the end of the rainy season in Campinas, SP, Brazil.
Another empirical approach relating leaf area index (L) with several dimensions of the coffee canopy is repor-ted for the cv. Apoatã IAC-2258 (see details in Favarin et al., 2002). Assuming a conical shape the canopy volume
(V = π h D2/12; h is the depth of the foliage, inm; D is
canopy base diameter, in m) was a good estimator of L
for the present data set (0.27 < L < 3.4; Table 1), i.e.,
L = 0.0134 + 2.74 V (R2 = 0.99, n = 9). Consequently, for L > 3.4 (V > 1.2 m3) this equation remains to be tested.
acknowlegMents
This work was partially supported by the Conselho Nacional de Desenvolvimento Científico e Tecnológico(CNPq).
reFerences
AL-KAISI, M.; BRUN, L.J.; ENZ, J.W. Transpiration and evapotranspiration from maize as related to leaf area index. Agricultural and Forest Meteorology, v.48, p.111-116, 1989.
ALLEN, R.G.; PEREIRA, L.S.; RAES, D.; SMITH, M. Crop evapotranspiration: guidelines for computing crop water requirements. Rome: FAO, 1998. 300p. (Irrigation and Drainage Paper, v.56)
BLORE, T.W.D. Further studies of water use by irrigated and unirrigated Arabica coffee in Kenya. Journal of Agricultural Science, v.67, p.145-154. 1966.
CAMARGO, A.P.; PEREIRA, A.R. Agrometeorology of the coffee crop. Geneve, Switzerland, WMO/TD 615, 1994. 90p. (CAgM Report No. 58)
CARR, M.K.V. The water relations and irrigation requirements of coffee. Experimental Agriculture, v.37, p.1-36, 2001.
COHEN, Y. Determination of orchard water requirement by a combined trunk sap flow and meteorological approach. Irrigation Science, v.12, p.12-93, 1991.
DOORENBOS, J.; PRUITT, W.O. Guidelines for predicting crop water requirements. Rome: FAO, 1977. 179p. (Irrigation and Drainage Paper 24)
FAVARIN, J.L.; VILLA NOVA, N.A.; ANGELOCCI, L.R.; DOURADO-NETO, D.; BERNARDES, M.S. Estimating of coffee plant water consumption as function of climatic parameters. Revista Brasileira de Agrometeorologia, v.9, p.235-240, 2001.
FAVARIN, J.L.; DOURADO-NETO, D.; GARCIA Y GARCIA, A.; VILLA NOVA, N.A.; FAVARIN, M.G.G.V. Equations for estimating the coffee leaf area index. Pesquisa Agropecuária Brasileira, v.37, p.769-773, 2002.
FERNÁNDEZ, J.E.; GREEN, S.R.; CASPARI, H.W.; DIAZ-ESPEJO, A.; CUEVAS, M.V. The use of sap flow measurements for scheduling irrigation in olive, apple and Asian pear trees and in grapevines. Plant and Soil, v.305, p.91-104, 2008.
FRANCO, C.M.; INFORZATO, R. Quantidade de água transpirada pelo cafeeiro ao sol. Bragantia, v.10, p.247-257, 1950.
FUCHS, M.; COHEN, Y. MORESHET, S. Determining transpiration from meteorological data and crop characteristics for irrigation management. Irrigation Science, v.8, p.91-99, 1987.
GOODWIN, I.; WHITFIELD, D.M.; CONNOR, D.J. Effects of
tree size on water use of peach (Prunus persica L. Batsch). Irrigation
Science, v.24, p.59-68, 2006.
GUTIÉRREZ, M.V.; MEINZER, F.C. Estimating water use and irrigation requirements of coffee in Hawaii. Journal of American Society of Horticultural Science, v.119, p.652-657, 1994a.
GUTIÉRREZ, M.V.; MEINZER, F.C. Energy balance and latent heat flux partitioning in coffee hedgerows at different stages of canopy development. Agricultural and Forest Meteorology, v.68, p.173-186, 1994b.
HATTON, T.; REECE, P.; TAYLOR, P.; MCEWAN, K. Does leaf water efficiency vary among eucalypts in water-limited environments? Tree Physiology, v.18, p.529-536, 1998.
NETZER, Y.; YAO, C.; SHENKER, M.; BRAVDO, B.A.; SCHWARTZ, A. Water use and the development of seasonal crop coefficients for Superior Seedless grapevines trained to an open-gable trellis system. Irrigation Science, v.27, p.109-120, 2009.
PEREIRA, H.C. Field measurements of water use for irrigation control in Kenya coffee. Journal of Agricultural Science, v.49, p.459-467, 1957.
PEREIRA, A.R.; VILLA NOVA, N.A. Transpiration of irrigated Tahiti acid lime trees with different canopy leaf areas, reference evapotranspiration and water balance for precision irrigation schemes. In: BENKEBLIA, N; TENNANT, P (Ed.). Citrus.
Tree and Forestry Science and Biotechnology3 (Special Issue 1),
p.87-91, 2009.
RITCHIE, J.T.; BURNETT, E. Dryland evaporative flux in a subhumid climate: II – plant influences. Agronomy Journal, v.63, p.56-62, 1971.
SHAW, R.H.; PEREIRA, A.R. Aerodynamic roughness of a plant canopy: a numerical experiment. Agricultural Meteorology, v.26, p.51-65, 1982.
SNYDER, R.L. Equation for evaporation pan to evapotranspiration conversions. Journal of Irrigation and Drainage Engineering, v.118, p.977-980, 1992.
TAUSEND, P.C.; MEINZER, F.C.; GOLDSTEIN, G. Control of transpiration in three coffee cultivars: the role of hydraulic and crown architecture. Trees, v.14, p.181-190, 2000.
VALENCIA, G.A. Relación entre el índice de area foliar y la productividad del cafeto. Cenicafe, v.24, p.79-89, 1973.
VILLA NOVA, N.A.; FAVARIN, J.L.; ANGELOCCI, L.R.; DOURADO-NETO, D. Estimative of the coffee crop coefficient as function of the weather and plant parameters. Bragantia, v.61, p.81-88, 2002.
WILLIAMS, L.E.; AYARS, J.E. Grapevine water use and the crop coefficient are linear functions of the shaded area measured beneath the canopy. Agricultural and Forest Meteorology, v.132, p.201-211, 2005.