CARLOS ALBERTO PINHEIRO BAPTISTA
Chemical Approaches to
Ubiquitous Computing
Dissertação apresentada para obtenção do
Grau de Doutor em Química,
perfil de Química-Física,
pela Universidade Nova de Lisboa,
Faculdade de Ciências e Tecnologia.
iii
CARLOS ALBERTO PINHEIRO BAPTISTA
Chemical Approaches to
Ubiquitous Computing
v
Resumo
Nos capítulos 2 e 3 descreve-se o estudo de sistemas cromogénicos em solução, sensíveis a diferentes estímulos. A rede de equilíbrios químicos do 6-hidroxiflavílio foi caracterizada pela formação de uma forma quinoidal da chalcona. A trans-6-hidroxichalcona é
relativamente estável em soluções ácidas e exibe um processo electroquímico quase-reversível, o que permite introduzir pela primeira vez um estímulo eléctrico nos flavílios. Fotocromismo e electrocromismo permite transitar de um estado incolor a amarelo de soluções de flavílio (capítulo 2). Um sistema supramolecular foi desenvolvido com base em três componentes: Fe(III)/Fe(II), Cristal Violeta Lactona (CVL) e um spiropirano (SPI); este sistema apresenta quatro estados ópticos: incolor, azul, magenta e amarelo. Estes estados estão interconectados e controlados por luz e electricidade. O sistema goza da fina selectividade do complexo Fe(III)/Fe(II) com o CVL e o SPI. A electricidade controla a formação dos complexos corados entre os iões Fe(III)/Fe(II) com o CVL (ionocromismo) e o SPI. A luz opera o processo fotocrómico do composto SPI (Capítulo 3).
Nos capítulos 4, 5 e 6 sistemas cromogénicos electrocrómicos em meio líquido e no estado sólido são descritos. A cor dos filmes electro-polimerizados sobre eléctrodos flexíveis de Azul da Prússia (PB) e de polímeros de complexos de Cu(II), Ni(II) e Pd(II) com ligando
salen foi caracterizada por colorimetria. A nova família de materiais electrocrómicos com
base nos complexos de salen apresentou transições de cor entre o verde/amarelo (Pd, Ni) e
roxo/amarelo (Cu), e um coeficiente de coloração na ordem de grandeza (150-200cm2/C) dos valores obtidos com polímeros orgânicos como o PEDOT (Capítulo 4). A performance relativa dos dispositivos electrocrómicos (ECD) em função do meio electrólito foi estudada. Um electrólito polimérico sólido (SPE) e um gel electrólito (GE) foram usados para comparação. Os ECD baseados em SPE mostraram-se inadequados para aplicações como ecrãs, dado o seu longo tempo de transição (na ordem dos minutos). O contrário acontece com ECD baseados em GE, tempos de transição abaixo do segundo foram registados. As diferenças obtidas estão relacionadas com as diferentes condutividades iónicas dos electrólitos testados; SPE (10-5–10-6 S/cm) e GE (10-2 S/cm) (Capítulo 5).
vii
Abstract
In chapters 2 and 3 dual-mode liquid state chromogenic systems are reported. The complex network of chemical reactions of the compound 6-hydroxyflavylium is characterized by the formation of the p-quinoidal chalcone. The trans-chalcone is metastable in very acidic
solutions and exhibits reversible redox reactions, allowing to introduce for the first time in the flavylium network an electrochemical input. Photochromism and electrochromism phenomena operates the system optical states between colourless and yellow (Chapter 2). The supramolecular system obtained by the combination of Fe(III)/Fe(II), Crystal Violet Lactone (CVL) and a spiropyran (SPI) leads to a four optical states system: colourless, blue, magenta and yellow; each independently addressable by light and electrical input. The system profits from fine speciation Fe(III)/Fe(II) complexes with CVL and SPI. Electrical stimulus controls the formation of the coloured adducts between iron ions with CVL (ionochromism) and the merocyanine form of SPI, while light stimulus operates the SPI compound (photochromism) (Chapter 3).
The chapters 4, 5 and 6 are devoted to the study of electrochromic systems and devices in the liquid and solid state. A colorimetric study of electrogenerated Prussian Blue (PB) and electrogenerated polymers based on salen-type complexes of Cu(II), Ni(II) and Pd(II)
deposited over transparent and flexible electrodes was carried out using the CIELAB colour system. The new family of electrochromic films showed colour transitions between green-yellow (Pd, Ni) and purple-green-yellow (Cu), with a coloration efficiency in the range of the values reported for the efficient electrochromic organic polymer like PEDOT. PB films showed high optical contrast between colourless and blue colour (Chapter 4). The relative performance of ECD based on solid polymer electrolyte (SPE) and gel electrolyte (GE) was investigated. The ECD based on SPE showed to be inappropriate for displays application due to its long switching times (minutes). In opposite to ECD based SPE, switching times lower than one second was recorded with ECD based on GE. The main differences are attributed to the different ionic conductivity of the electrolytes; SPE (10-5–10-6 S/cm), GE (10-2 S/cm) (Chapter 5).
ix
Abbreviature List
A Absorbance
Aλum Absorbance at λnm wavelength
Aλnm,n Absorbance at λnm wavelength after n write-erase cycles
α Electron transfer coefficient
Epa Anodic peak potential
K^a Apparent equilibrium constant between AH+ and A, Cc and B
K’ Apparent equilibrium constant between AH+ and CB
CRT Cathode ray tube
Epc Cathodic peak potential
CIELAB CIE-L*a*b*
x, y CELAB chromaticity coordinates
∆E*ab CIELAB colour difference
L* CIELAB coordinate relative to the luminance of the colour
a* CIELAB coordinate relative to the redness-greenness of the colour b* CIELAB coordinate relative to the yellow-blueness of the colour
MERO-c Cis-form of the merocyanine form
Cc Cis-chalcone
CE Coloration efficiency
φ(λ) Colour stimulus function
φ(λ) Colour stimulus function
x(λ), y(λ), z(λ) Colour-matching functions
CIE Comission international de l'éclairage
CB Conjugated bases (A, B, Cc and Ct)
CR Contrast ratio
CP Coordination polymers
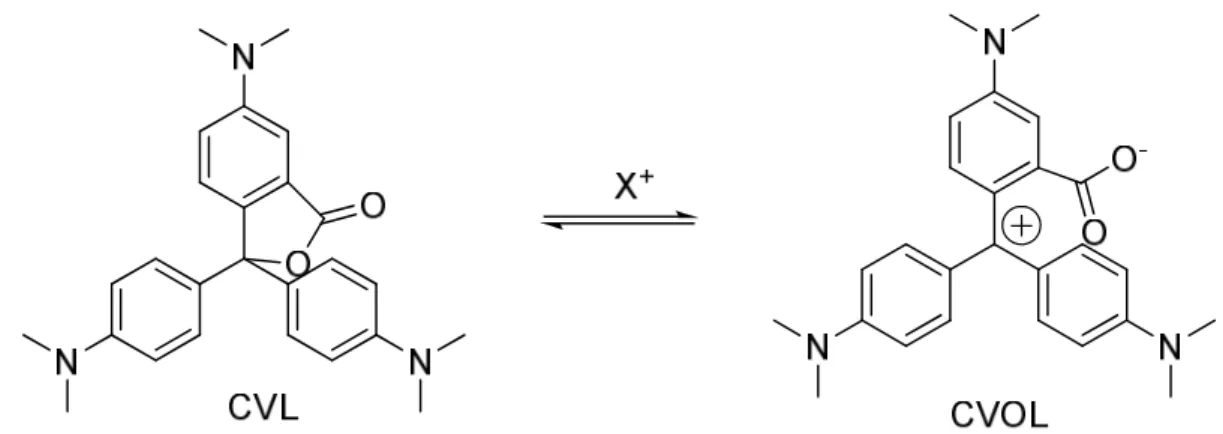
CVL Crystal violet lactone
I Current
CMYT Cyan, magenta and yellow, as well as a transparent state
DPGDA Dipropyleneglycol diacrylate
λd Dominant wavelength
λc,d Dominant wavelength of the complementary colour
DoD Drop-on-demand
DSSC Dye sensitized solar cells
ECD-T Ecd can be operated in the transmittance
x
C Electrical conductance
E Electrical potential
ρ Electrical resistivity
ECD Electrochromic device
e- Electron
e Elementary charge
Ka Equilibrium constant for the deprotonation of AH+
KCt(1) Equilibrium constant for the deprotonation of Ct
KCt(2) Equilibrium constant for the deprotonation of Ct
-Kh Equilibrium constant for the hydration of AH+ Ki Equilibrium constant for the isomerization of Cc Kt Equilibrium constant for the tautomerization of the B
Λ Equivalent conductivity
pc Excitation purity
AH+ Flavylium cation
FTO Fluorine-doped tin oxide
Tg Glass transition temperature
B Hemiketal
IP Impact printing techniques
IJ Ink-jet printing
IVCT Inter valence charge transfer
ui Ionic mobility of the specie i
Ct- Ionized trans-chalcone
ka Kinetic constant for the direct deprotonation reaction (formation of A) kh Kinetic constant for the direct hydration reaction
k-a Kinetic constant for the inverse deprotonation reaction (protonation of A) k-h Kinetic constant for the inverse hydration reaction (the dehydration of B) CIELAB L*a*b* tristimulus cie colour space
LSE Liquid state electrolyte
PEO-2 Low molecular weight peo-ppo
MERO Merocyanine form of the spiropyran
[M(salen)] Metal complex, m with salen ligand
poly[M(salen)] Metal complex, m with salen ligand polymer
M+ Metal ion
MV Methyl viologen
xi
Molar absorption coefficient
χX Molar fraction of the specie X
NCD Nanochromic display
NIR Near infrared region radiation
V- Negative voltage
z Net charge
NIP Non-impact printing techniques
NMR Nuclear magnetic resonance spectroscopy
N Number of charge carriers
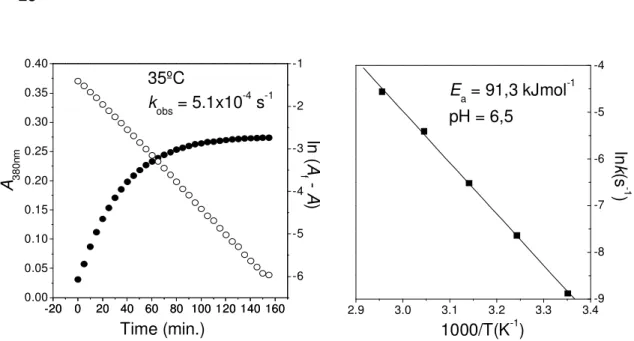
kobs Observed kinetic constant
OTE Optically transparent electrodes
OLED Organic light emitting diodes
MERO-oQ Ortho-quinoidal form of the merocyanine
PANI poly(acrylonitrile)
FOT group Photochemistry and supramolecular group
P-ECD Photoelectrochromic device
PMMA Poly(methyl methacrylate)
PEDT:PSS Poly(3,4-ethylenedioxythiophene)-poly(styrenesulfonate)
PEDOT Poly(ethylene dioxythiophene)
PEO-PPO Poly(ethylene oxide) and poly(propylene oxide) copolymer
p(TMC) Poly(trimethylene carbonate)
PVdF Poly(vinyliden fluoride)
PEO Polyethylene oxide polymer
PET Polyethylene terephthalate
PET-ITO Polyethylene terephthalate films coated with indium tin oxide
ADI Portuguese innovation agency
V+ Positive voltage
PB Prussian blue
PX Prussian brown
PW Prussian white
PY Prussian yellow
PVC Poly(vinyl chloride)
PVdF Poly(vinylidene fluoride)
i Quantum yield for a given process i
A Quinoidal base
xii
RGB Red, green and blue additive colour system
Rλnm Reflectance at λnm wavelength
Rλnm,n Reflectance at λnm wavelength after n write-erase cycles S(λ) Relative spectral power distribution of the illuminant
τ Response time
Voff Resting voltage
Rx Intensity of light reflected diffusely by the coloured state of the ECD
SCE Saturated calomel electrode
v Scan rate
Ag/AgCl Silver/silver chloride reference
SPE Solid polymer electrolyte
Kps Solubility constant
κ Specific electrical conductance or electrical conductivity
R(λ) Spectral reflectance factor
T(λ) Spectral transmittance factor
SEC Spectroelectrochemistry
BIPS Spiroindolinobenzopyran
SPI Spiropyran
T Temperature
MERO Merocyanine form
IJ Ink-jet printing
ECD-R Reflectance
ITO Tin-doped indium oxide
TiO2-DPGDA TiO2 dispersion in dipropyleneglycol diacrylate TiO2-W TiO2 dispersion in water
CX Total concentration of specie X
Ct Trans-chalcone
Tλnm Transmittance at lnm wavelength
Tλnm,n Transmittance at lnm wavelength after n write-erase cycles
TCO Transparent conductive oxide
TPM Triphenylmethane
x(λ), y(λ), z(λ) Tristimulus colour-matching functions
UC Ubiquitous computing
UV Ultra-violet radiation
UV-Vis Ultraviolet-visible spectroscopy
xiii
vs. Versus
η
V
Viscosity Voltage
λ Wavelength
xv
Table of Contents
Chapter 1 ... 1
General Introduction 1.1 Motivation ... 2
1.2 Chromogenic Systems and Applications (Background)... 3
1.2.1Electricity ... 5
1.2.2Light... 13
1.2.3Ions... 15
1.2.4Electricity and light or ions and light... 16
1.2.5 Temperature, polarity, mechanical pressure and mechanical friction ... 19
1.3 Industrial Printing Techniques... 19
1.4 Outline ... 21
1.5 Bibliography... 23
Chapter 2 ... 29
The chemistry of 6-hydroxyflavylium 2.1 Introduction... 30
2.1.1Flavylium compounds ... 30
2.2 Experimental details ... 38
2.3 Results and Discussion... 41
2.4 Conclusions ... 53
2.5 Bibliography... 55
Chapter 3 ... 59
Multiresponsive chromogenic systems operated by light and electrical inputs 3.1 Introduction... 60
3.1.1Leuco Dyes... 60
3.2 Experimental details ... 64
xvi
3.3.1Interaction between CVL and iron ions... 66
3.3.2Adding light stimulus: multi-responsive system ... 75
3.3.3Two external inputs, Three species, Four Colours ... 79
3.4 Conclusions ... 81
3.5 Bibliography... 83
Chapter 4 ... 87
Electrocolorimetry of electrochromic materials on flexible ITO electrodes 4.1 Introduction... 88
4.1.1 Electrochromic Coordination Polymers ... 88
4.1.2 Colorimetry ... 94
4.2 Experimental details... 100
4.3 Results and Discussion... 102
4.3.1Prussian blue... 102
4.3.2Salen-type complexes of Cu(II), Ni(II) and Pd(II)... 106
4.4 Conclusion... 115
4.5 Bibliography... 117
Chapter 5 ... 123
Non-liquid Electrolytes for Electrochromic Devices 5.1 Introduction... 124
5.1.1Electrolyte systems and application ... 124
5.2 Gel Electrolytes for ECD applications ... 130
5.2.1Experimental Details ... 130
5.2.2Results and Discussion... 132
5.3 A Solid Polymer Electrolyte for ECD ... 145
5.3.1Experimental Details ... 145
5.3.2 Results and Discussion... 149
5.4 General Conclusions... 158
xvii
Chapter 6 ... 165
Paper, textile and white board ECD 6.1 Motivation ... 166
6.2 Strategy and project execution organization ... 169
6.3 Results and Discussion... 172
6.3.1Electrochromic layer ... 172
6.3.2ECD Assembly with paper-, textile- and white board electrodes ... 176
6.3.3ECD characterization... 180
6.4 Conclusions ... 184
6.5 Bibliography... 187
Chapter 7 ... 189
Feasibility study for an electrochromic display built by ink-jet 7.1 Introduction... 190
7.1.1Ink-jet technique ... 191
7.2 Strategy and project execution organization ... 196
7.3 Results and Discussion... 197
7.3.1Printing the Electrochromic Layer ... 197
7.3.2Printing the Electrolyte Layer ... 198
7.3.3Demonstration of the ink-jet printed electrochromic cells ... 201
7.4 Conclusion... 203
7.5 Bibliography... 205
Chapter 8……….……….209
xix
Index of Figures
Figure 1.1 – Light interaction with matter; reflectance, scattering, absorption and transmittance ... 4
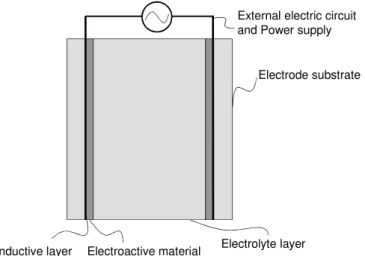
Figure 1.2 – Example of an electrochromic device with the “sandwich” like architecture. ... 6
Figure 1.3 – ECD in transmittance mode (A), and in reflectance mode (B)... 8
Figure 1.4 – Schematic view of the ECD from Acreo EC technology with a "side-by-side" architecture. ...12
Figure 1.5 – ECD architecture employed by NTera where the primary electrode is composed by a chemisorbed viologen derivative on the surface of TiO2 nanoparticles (coated PET-ITO) (1), a dispersion of light scattering TiO2 nanoparticles is incorporated in the electrolyte layer (2). ...13
Figure 1.6 – T-type photochromic compounds, spiropyrans (A), spirooxazines (B) and chromenes (C) ...14
Figure 1.7 – P-type photochromic compounds, fulgides (A) and diarylethenes (B)...14
Figure 1.8 – Acidochromism mechanism of the Methyl Red, the base form is colourless and at a pH = 4.4 the azonium for is red. ...15
Figure 1.9 – Dual-mode photochromism and electrochromism of the 1,2-bis(2-methyl-5,2’-dithiophen-3-yl)perfluorocyclopentene, the pale yellow ring-open form (A) is converted both by an electrical potential and by UV light to the coloured ring-closed form (B) ...17
Figure 1.10 – The spiropyrans bearing a monoaza-crown shows dual-mode photochromic and ionochromic properties. ...17
Figure 1.11 – Example of the operation of a P-ECD by light. Electrons are ejected from the photovoltaic layer (1) and reduction of the electrochromic WO3 layer will cause the darkening of the device...18
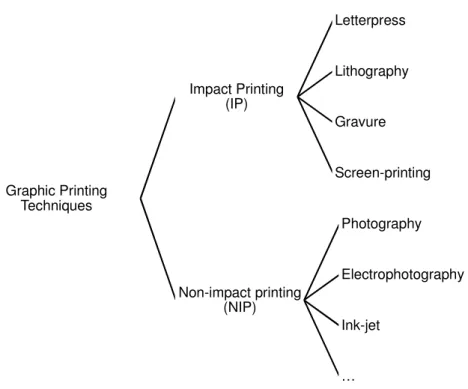
Figure 1.12 – Graphic printing techniques classified by the method ink is transferred to the printing substrate, adapted from ref.50...20
Figure 1.13 – Schematic draws of the physical printing plates for Letterpress (A), lithography (B), gravure (C) and screen-printing (D). ...20
Figure 2.1 - 2-phenyl-1-benzopyrylium (Flavylium) structure ...30
Figure 2.2 – Chemical network of 6-Hydroxiflavylium ...31
Figure 2. 3 – Dual-type photochromic system proposed by Pina et al.11...34
Figure 2.4 – Oxidation mechanism for different polyphenols (Kuromanin19, Kaempferol19 and Catechin20). ...36
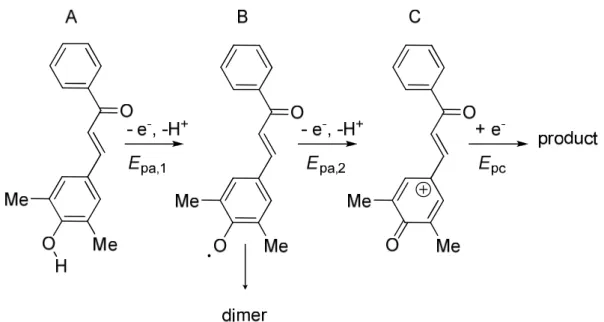
Figure 2.5 – Proposed two electrons, two protons oxidation mechanism of the 3,5-dimethyl-4-hydroxychalcone by Nicole Cotelle et al.21...37
Figure 2.6 - Spectral variations of 6-hydroxyflavylium perchlorate, 3.5x10⁻⁵M, as a function of pH (acidic region) at the thermal equilibrium. In order to decrease the reaction time, the solutions were kept at 40 °C for 7 hours and left to equilibrate for a day at room temperature...41
Figure 2.7 - Spectral variations of 6-hydroxyflavylium perchlorate, 3.5x10⁻⁵M, as a function of pH, resulting from a pH jump from 1, measured after 30 seconds. ...42
xx
Figure 2.9 - Decay trace of a direct pH jump from 1 to 9.65 (left); decay trace of a reverse pH jump from 6.1 to
2.33 (right). The initial solution at pH=6.1 was prepared from a stock solution at pH=1.0, and used
immediately, before formation of significant amounts of Ct (pseudo-equilibrium state). The decay of the A
form is observed during the direct pH jump, while the formation of the AH+ form is observed during the
reverse pH jump. ...44
Figure 2.10 - Kinetics of the zwitterionic base decay followed by stopped flow...44
Figure 2.11 – Proposed kinetic mechanism for the conversion between the form AH+, A and B, previously
described in the literature ...45
Figure 2.12 - Observed rate constants upon direct (pH=1 →→→→ pH>1, ) and reverse (pH=6.1 →→→→ pH<6.1, ) pH
jumps. ...47
Figure 2.13 – The cis-trans isomerization of 6-hydroxyflavylium perchlorate at pH=6.5 (left) and the Arrhenius
plot for the same reaction (right). ...48
Figure 2.14 - Rate constant of the cis-trans isomerization as a function of pH. ...48
Figure 2.15 - Irradiation at 313nm of a freshly prepared solution of 6-hydroxyflavylium perchlorate at pH=6.4.
Inset: absorbance changes at 380 nm. ...49
Figure 2.16 - Spectral variations occurring upon a titration of the trans-2,5-dihydroxychalcone under argon
atmosphere, at 25 °C. ...50
Figure 2.17 – Cyclic voltammograms of 2.9××××10-4 M trans-2,5-dihydroxychalcone at pH 1, at different scan
rates at 21°C (left). The working electrode was a glassy carbon electrode, the reference electrode was a
Ag/AgCl electrode and as counter-electrode a platinum wire. The experiments were carried out in
hydrochloric acid aqueous solution about pH1.3, containing 1MKCl as supporting electrolyte. Inset: plot of
the anodic peak current vs. square root of scan rate (v), a correlation of 0,99 was found. Comparison of
experimental (full line) and simulated (dots line) cyclic voltammograms of 2,9x10⁻⁴M 2,5-dihydroxychalcone
at pH 1, run at 0,1Vs-1 (right). Simulation was made using “GPES4.9 commercial voltammetric simulation
package from EcoChemie V.B.” with the following parameters: formal potential, E0 = 0,438V (vs. Ag/AgCl)
and electron transfer coefficient, αααα = 0,48...51
Figure 2.18 - Spectral variations that follow the oxidation (left), and reduction (right) of trans
-2,5-dihydroxychalcone in a mixture of ethanol (60%) and aqueous 0.2 M HCl (40%). The working electrode was a
platinum net electrode, the reference electrode was an Ag/AgCl electrode and as counter-electrode a
platinum wire. The supporting electrolyte was 1MKCl. ...52
Figure 2.19 – Electrochemical redox mechanism proposed for the trans-chalcone form of the
6-hydroxyflavylium...52
Figure 2.20 - Molecular orbital potential energy minima, calculated by semi-empirical method for the
4’-hydroxyflavylium...53
Figure 2.21 – Thermodynamics of the 6-hydroxyflavylium chemical network...53
Figure 3.1 – Ring opening of Crystal Violet Lactone. Left: closed ring Crystal Violet Lactone (CVL); Right: open
xxi
Figure 3.2 - (6-NO2,1’N-CH2CH2OH)-BIPS (SPIRO) and ring open merocyanine (MERO) and respective isomers
(MERO-c, MERO-t and MERO-oQ). ...62
Figure 3.3 - Merocyanine-metal chelate...63
Figure 3.4 – Chelate formation and decolouration chemical equilibrium adapted from ref.20. ...63
Figure 3.5 - Absorption spectra of 0.5 mM CVL in the presence of 1 mM Fe(II) (solid line) and 1 mM Fe(III) (dashed line). On the contrary to Fe(II), the oxidized form Fe(III) opens the lactone ring of CVL...66
Figure 3.8 - Spectroelectrochemical data of 300 μM of CVL in the presence of 1 mM of FeCl3: Chronoabsorptometry followed at the maximum absorbance (631nm) of CVOL (A); Chronoamperometry data (B); Square wave potential program (C); Picture shows the optical transitions of a mixture of 300μM of CVL and 1 mM of FeCl3 between anodic electrolysis (blue colour) and cathodic electrolysis (colourless). ...75
Figure 3.10 - Irradiation of the SPI (0.1 mM) in methanol solution and 0.1 M TBAP (left). The same in the presence of Fe(III) in 2-fold excess (0.2 mM) (right). ...77
Figure 3.11 - Cyclic voltammograms of Fe(III) (full line) and SPI (dashed line) in ethanol. Electrochemical potential required to operate the Fe(III)/Fe(II) redox process does not affect the SPI species. ...78
Figure 3.12 - Operation of the CMYT colour model based on the three component system: SPI (1 mM), CVL (35 µµµµM) and Fe(III) (35 µµµµM); methanol, 0.1 M TBAP. Transition between 1 and 2 is controlled by electricity, transitions between states 2 and 3 and states 3 and 4 are controlled by light. Pictures of the solutions corresponding to the states 1, 2, 3 and 4 from the left to the rigt...80
Figure 3.13 - Molar absorption spectra of the coloured species involved in the photoelectrochromic system in methanol. MERO (full line); MERO-Fe(III) (dotted line); CVOL-Fe(III) (dashed line). ...80
Figure 4.1 - 3D geometry of “soluble” Prussian Blue crystal; full circle: Fe(III), open circle: Fe(II) ...90
Figure 4.2 – General strucuture of salen-type complexes...92
Figure 4.3 – Proposed polymer strucuture of poly[M(salen)]31...92
Figure 4.4 – Schematic band structure of a dopped semi-conductor. λλλλ1: band-gap; dashed lines: charge carriers (polarons) ...94
Figure 4.5 – Visual illusion due to different contrast between the object and the surrounding. At the left side of the image the green strips are actually of the same colour than the blue strips on the right...95
Figure 4.6 - The CIE 1931 colour-matching functions (ploted with the data from ref.36)...96
Figure 4.7 – Chromaticity diagram and colorimetric information that can be extracted from it.40...99
Figure 4.8 - In situ cronocoulometry/cronoabsorptometry data for PB film deposited on PET/ITO in 0.2 M KCl aqueous solution as supporting electrolyte. Left: chronoabsorptometry recorded at 690nm (dashed line), CE (full line). Right: chronoamperometry (full line+full circle), square-wave switching between −0.2 and 0.6V (vs. Ag/AgCl), step duration of 40s (full line). ...102
xxii
Figure 4.10 - Chromaticity coordinates xy obtained by in situ chronocoulomery/chronoabsorptometry for PB
films deposited over PET/ITO. Films with 300s (open square), 600s (open circles) and 150s (open triangles)
deposition time. Note: all the potentials were measured using Ag/AgCl reference. ...105
Figure 4.11 - Salen-type complexes of Cu(II), Ni(II) and Pd(II): (A) [M(3-MeOsaltMe)], M=Ni or Cu and (B)
[X(3-Mesalen)], X=Pd. ...106
Figure 4.13 - In situ cronocoulometry/cronoabsorptometry data for Pd film deposited on PET/ITO in
acetonitrile 0.1 M TBAP as supporting electrolyte. Left: Left: chronoabsorptometry recorded at 765nm (full
line), CE (dots). Right: chronoamperometry (full line+full circle), square-wave switching between −0.2 and
0,6V (vs. Ag/AgCl), step duration of 50s (full line)...108
Figure 4. 14 - In situ cronocoulometry/cronoabsorptometry data for Cu film deposited on PET/ITO in
acetonitrile 0.1 M TBAP as supporting electrolyte. Left: chronoabsorptometry recorded at 620nm (full line),
CE (dots). Right: chronoamperometry (full line+full circle), square-wave switching between −0.15 and 1.4V
(vs. Ag/AgCl), step duration of 60s (full line)...109
Figure 4. 15 – In situ cronocoulometry/cronoabsorptometry data for Ni film deposited on PET/ITO in
acetonitrile 0.1 M TBAP as supporting electrolyte. Left: chronoabsorptometry recorded at 576nm (full line),
CE (dots). Right: chronoamperometry (full line+full circle), square-wave switching between 0 and 1.3V (vs.
Ag/AgCl), step duration of 65s (full line)...109
Figure 5.1 – Cation (sphere) transport mechanism in a polymer based electrolyte. Motion coupled to that of
the polymer chain (up) and transfer of a cation between chains (bottom). ...127
Figure 5.2 – Ionic conductivity (left) and equivalent ionic conductivity (right) of the gel electrolyte at different
salt content in M (the chemical concentration was calculated considering stoichiometric chemical quantity of
LiClO4 and the volume of acetonitrile in the respective mixture; mol LiClO4 divided by the volume of
acetonitrile) at 21ºC. ...134
Figure 5.3 – Ionic conductivity (κκκκ) of the clear gel electrolyte as a function of temperature. ...135
Figure 5.4 - Electrochemical window for gel polymer electrolyte determined by cyclic voltammetry. A two
electrode electrochemical cell was used with the electrolyte film sandwiched in between. The working
electrode was a PET-ITO and the counter electrode and reference electrode was used as a one electrode also
from PET-ITO; clear gel electrolyte (left) and opaque yellow gel electrolyte (right). ...136
Figure 5.5 – ECD-R in a symetric “sandwich-like” architecture...137
Figure 5.6 – Reflectance spectra of ECD-2 at different percentages of doped PEDOT as a function of the
applied electrical potential. Potentials are measure vs. PEDOT/ITO electrode. ...138
Figure 5.7 – Left: spectroelectrochemical data for the first cycle operated on the ECD-1 (open circle) and the
ECD-2 (open square) during the coloration process (+0.4V vs. PEDOT/ITO); Right: spectroelectrochemical data
for the first cycle operated on ECD-1 (open circle) and ECD-2 (open square) during the bleaching process
(-1.5V vs. PEDOT/ITO). The insets show a zoom-in for the respective plot, detail on the optical variation during
xxiii
Figure 5.8 – The write-erase cycling stability test data from ECD-1. Left: variation of the reflectance of the
device during write-erase cycling tests, first cycles (full line) and after 1200 cycles (open circle + full line).
Right: square-wave electrical potential used to operate the stability cycling tests of the device (dashed line),
and chronoamperometry data during the stability cycles (full line) ...140
Figure 5.9 – The write-erase cycling stability test data from ECD-2. Left: variation of the reflectance of the
device during write-erase cycling tests, first cycles (full line) and after 1200 cycles (dots). Right: square-wave
electrical potential used to operate the stability cycling tests of the device (dashed line), and
chronoamperometry data during the initial cycles (full line)...141
Figure 5.10 – Variation of the reflectance vs. the charge consumed by the ECD-1 (left) and ECD-2 (right). ...143
Figure 5.11 - Spectroelectrochemical data of the complementar PET/ITO/PB/SPE4/PEDOT/ITO/PET ECD in the
coloured state (+1 V vs. PEDOT, dashed line) and bleached state (−1.5 V vs. PEDOT, continuous line). Inset:
Absorbance data at 630nm for the PB/SPE4/PEDOT electrochromic cell as a function of the potential applied.
...151
Figure 5.12 - Cyclic voltammogram of the ITO/PB/SPE1/PEDOT/ITO electrochromic cell. The reported cell
voltage is that of PB with respect to PEDOT (vs. PEDOT)...152
Figure 5.13 - In situ chronocoulometry/ chronoabsorptometry data for PET/ITO/PB/SPE1/PEDOT/ITO/PET
electrochromic cell during short cycling tests; chronoabsorptometry recorded at 630nm (left),
chronoamperometry (right)...153
Figure 5.14 - Full switch in absorbance of the electrochromic cells before (black) and after (grey) 2500 short
cycles (write-erase cycling, conditions presented in Table 5.9); the figure in each column accounts for the
relative variation of full switch of absorbance at 630nm after 2500 short cycles = (ΔA2500 × 100/ΔAinitial) − 100,
see section 1.2.1 ECD parameters. The absorbance at 630nm for the coloured and bleached states for each
cell is the values of the top and at the bottom of each column, respectively. ...155
Figure 5.16 – The total ∆∆∆∆A at 630nm during the write-erase cycling test of the
PET/ITO/PB/SPE5/PEDOT/ITO/PET...157
Figure 6.1 – Schematic plan of the pipeline of the applied R&D work executed during the IDEIA projects,
YInvisible-Papel, YInvisible-Textil and YInvisible-Quadros. ...169
Figure 6.2 – Schematic view of the ECD model for the IDEIA projects. ...171
Figure 6.3 – Substrate-electrode preparation with an electrical contact. Cupper electrical wires were
connected to the TCO layer through conductive silver glue (left, textile-electrode sample). After the silver
glue is dried epoxy glue is used to seal and give structure to the contact between electrical wire and the
substrate-electrode (right, white board-electrode sample). ...172
Figure 6.4 – Prussian Blue film electrochemically deposited over a TCO coated white board (white board
electrode). The PB films are highly heterogeneous in all the electrode-substrates tested. ...173
Figure 6.5 – Picture of the three electrodes electrochemical cell. Working electrode is the PB modified
xxiv
Figure 6.6 –PEDOT:PSS deposited over paper-electrode (left, by spin-coating), textile-electrode (middle, with
a brush) and board-electrode (right, by spin-coating)...174
Figure 6.7 – Images of the optical transition of PEDOT:PSS layer deposited over the paper-electrode by
electrochemical oxidation (left) and electrochemical reduction(right). See experimental details in Table 6.4.
...175
Figure 6.8 – Images of the optical transition of PEDOT:PSS layer deposited over the textile-electrode by
electrochemical oxidation (left) and electrochemical reduction (right). See experimental details in Table 6.4.
...176
Figure 6.9 – Images of the optical transition of PEDOT:PSS layer deposited over the board-electrode by
electrochemical oxidation (left) and electrochemical reduction (right). See experimental details in Table 6.4.
...176
Figure 6.10 – Pictures of the bleached (left) and coloured (right) optical transition of an ECD based on
PEDOT:PSS modified paper-electrode. Electrochromic device architecture: Paper-electrode/PEDOT:PSS/white
opaque electrolyte/PEDOT:PSS/ITO-PET, where the primary electrode is the PET-ITO...178
Figure 6. 11 - Pictures of the bleached (left) and coloured (right) optical transition of an ECD based on
PEDOT:PSS modified paper-electrode. Electrochromic device architecture: Paper-electrode/PEDOT:PSS/white
opaque electrolyte/PEDOT:PSS/ITO-PET, where the primary electrode is the paper-electrode...178
Figure 6.12 - Pictures of the bleached (left) and coloured (right) optical transition of an ECD based on
PEDOT:PSS modified textile silicon coated-electrode. Electrochromic device architecture: Textile silicon
coated-electrode/PEDOT:PSS/yellow opaque electrolyte/PEDOT:PSS/ITO-PET where the primary electrode is
the PET-ITO...179
Figure 6.13 - Pictures of the bleached (left) and coloured (right) optical transition of an ECD based on
PEDOT:PSS coated Flectron N conductive textile. Electrochromic device architecture: Conductive
textile-electrode/PEDOT:PSS/white opaque electrolyte/PEDOT:PSS/ITO-PET, where the primary electrode is the
PET-ITO...179
Figure 6.14 – Pictures of the bleached (left) and coloured (right) optical transition of an ECD based on
PEDOT:PSS modified white electrode. Electrochromic device architecture: White
board-electrode/PEDOT:PSS/opaque electrolyte (white)/PEDOT:PSS/ITO-PET...180
Figure 6.15 – Variation of the total optical contrast of a paper-ECD during write-erase cycling test. ...182
Figure 6.16 – Pictures of the proof-of-concept paper-ECD. This device shows an electrochromic map of the
Lisbon downtown. The buttons on the bottom of the map will highlight a specific area of interest. The colour
contrast is obtained by the electrochemical control of the coloured and bleached states of the PEDOT layer
deposited over PET-ITO. The counter electrode is PEDOT coated paper-electrode. The opaque gels
electrolytes used were pink (Alfama) and yellow (Bairro Alto). To power the device small flat batteries were
xxv
Figure 7. 1 – ECD with a non-patterned electrochromic layer (up) and a patterned electrochromic layer as the
primary electrode. Pictures show the bleached and coloured states for both devices at the left and right side,
respectively. ...190
Figure 7.2 – Schematic view of different ink-jet print-head technologies. Continuous mode technology (A),
the drops are deflected by the electric field created between the two plate electrodes at the exit of the
nozzle. The deflection of the drops allows to control the position where the ink land. The deflected drops
(open circle) are collected back to the ink chamber. The non-deflected drops (full circle) land over the
printing substrate. DoD ink-jet technology (B and C). Thermal print-head (B) ejects drops by the rapid
vaporization of the ink at the surface of an electrode inside the ink chamber. Piezoelectric print-head in
bend-mode (C) expulses a jet of ink by the application of pressure in the ink chamber by the stimulus of the
piezoelectric ceramic plate. ...192
Figure 7. 3 – Piezoelectric print-head waveform ...194
Figure 7.4 – ECD proposed to assemble with the ink-jet printing technique ...196
Figure 7.5 - Representative OpticaTM images captured during PEDOT reliability studies ...198
Figure 7.6 – Electrolyte consisting in three stacked layers. Clear layer contains polymer, solvent and salt and
the white opaque layer contains solvent, salt and TiO2 nanoparticles. Polymer and TiO2 suspended particles
are not present in the same ink to avoid particle sedimentation (see text). ...199
Figure 7.7 – Schematic view of the process to assemble an ECD using ink-jet and lamination techniques. ...202
Figure 7.8 - Ink-jet printed ECD (7 x 7 cm) showing the coloured state (left) and bleached state (right)...202
Figure 7.9 – Schematic representation of the influence of the polymer weight on the ink drop formation.
From the left to the right the weight of the polymer dissolved in the ink-jet ink increases. For low molecular
weight polymers the drop are easily detached from the ink stream and small drops (satellites) are formed.
When the polymer weight is high the drops do not succeed to detach from the ink stream and a
xxvii
Index of Tables
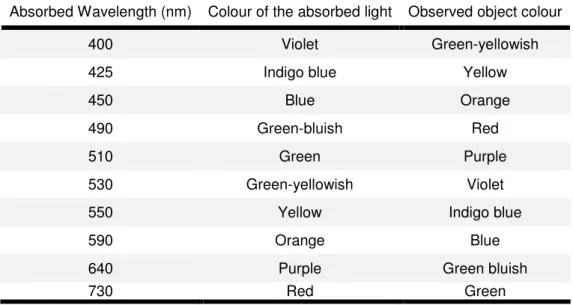
Table 1.1 – Colour perceived as a function of the wavelength of radiation ... 5
Table 1.2 – Chromogenic systems and related characteristics...19
Table 4.1 - Collected data from in situ choronocoulometry/chronoabsorptometry experiments of the PB films
deposited on PET/ITO in 0.2 M KCl aqueous solution ...104
Table 4.2 – Colorimetric coordinates collected for PB and PW films deposited over ...105
Table 4.3 - Collected data from choronocoulometry/chronoabsorptometry experiments for metal salen-type
films, after one cycle...110
Table 4.4 - In situ cronocoulometry/cronoabsorptometry of the salen-type metal...111
Table 4.5 - Dominant wavelength (λλλλd) for the electrochromic inorganic polymers...113
Table 5.1 – Ionic conductivity and equivalent conductivity for gel electrolytes with different percentage of
LiClO4 salt...133
Table 5.2 – Ionic conductivity of the clear and opaque gel electrolytes ...136
Table 5.3 – Ionic conductivity of the electrolyte layer in ECD*-1 and ECD*-2 ...137
Table 5.4 – Collected data from spectroelectrochemical experiments for ECD-1, measured before the
write-eras cycling test ...142
Table 5.5 – Collected data from spectroelectrochemical experiments for ECD-2, measured before the
write-eras cycling test ...142
Table 5.6 – Performance output of the ECD-1 and ECD-2 ...144
Table 5.7 - p(TMC)/PEO(X/Y)nLiClO4 electrolytes for application on prototype solid-state electrochromic
devices...150
Table 5.8 - Spectroelectrochemical data for the different electrochromic cells PB/SPE#/PEDOT. ...153
Table 5.9 - Short cycling conditions...154
Table 5. 10 - Coloration efficiency parameters for PB/SPE5/PEDOT before and after cycling test stabilities. 156
Table 6.1 – Raw materials used in each industry, RENOVA, Filobranca and Bi-Silque...169
Table 6.2 – Electrode substrates used during the IDEIA projects...171
Table 6.3 – Prussian Blue electrodeposition experimental conditions ...172
Table 6.4 – Electrochromism test of the PB layers by cyclic voltammetry, experimental details ...174
Table 6.5 - Electrochromism test of the PEDOT:PSS layers by cyclic voltammetry, experimental details...175
Table 6.6 - Electrochromism test of the PEDOT:PSS layers by chronoamperometry, experimental details ...175
Table 6.7 – Performance of the ECD based on Paper, textile and white board...180
Table 6.8 – Write-erase cycling test results for the ECD based on paper, textile and white board. ...181
Table 6.9 - Collected data from spectroelectrochemical experiments for paper-ECD, befor the write-erase
xxviii
Table 7.1 – General ink-jet ink parameters ...195
Table 7.2 - Formulation of PEDOT-F and respective characteristics...197
Table 7.3 – PEDOT-F jetting reliability monitored for 100 printing nozzles...198
Table 7.4- Formulation of the clear and opaque electrolyte ink...200
xxxi
Preface
The Ph.D. dissertation “Chemical Approaches to Ubiquitous Computing” results from the collaborative work I developed in the last four years as a joint Ph.D. student between the Photochemistry and Supramolecular Chemistry research group (FOT, from FCT-UNL) and YLabs (YDreams Research Division). This Ph.D. work was co-funded by YDreams and Fundação para a Ciência e a Tecnologia through a BDE scholarship (Bolsa de Doutoramento em Empresa). All the scientific work was carried out in the facilities of the FOT Group.
An undefined borderline between fundamental and applied research was the best strategy I could find to meet the challenges proposed by my supervisors A. Jorge Parola and J. Fernando Pina (from academia) and Ivan Franco (from YDreams). As a Ph.D. student, my main objective was to build a knowledge base that would lead to the creation and development of innovative technologies and projects for YDreams.
Back in 2004, YDreams approached the FOT Group with the intent of exploring chemistry-based solutions in the area of invisible tags. The successful collaboration from this first project originated the motivations for my Ph.D. plan. Since that time, chromogenic systems based on photochromic, thermochromic, ionochromic and electrochromic materials have been studied and integrated into real devices. The results pointed out that electrochromism is the most appropriate chemical phenomenon to develop interactive products.
In addition to the results presented in this dissertation, the work developed since that time created scientific knowledge, intellectual property, new ideas and challenges and, most importantly, the motivation to grow and continue. All the know-how created in the field of chromogenic systems and devices is now materialized in the most recent YDreams spin-off – YDreams Interactive Surfaces.
Today, the R&D team in the laboratory from YDreams Interactive Surfaces is working on its first generation of chromogenic products to bring them into the market.
xxxii
“Invisible Computing makes a splash at CES”
Associated Press, Las Vegas, February 18th, 2013
The booth of Invisible Network (IN), a consortium of leading Portuguese companies and
research teams, made a splash at the Consumer Electronics Show in Las Vegas with a new
generation of interactive products based on traditional substrates used as screens (cork,
paper, plastic, textile, wood, glass, concrete, leather and ceramics) and electrochromic inks
(that change color with the use of an electrical current triggered by user interaction).
YDreams Interactive Surfaces, IN leader, used the term “invisible computing” to define the
processes of activating and de-activating pre-programmed information layers, displaying
animations and performing simple computation operations using electrochromic inks. These
inks are deposited onto the different target substrates using ink-jet printing, along with
conductive oxides, energy sources, and other electronic, chemical or biological sensors and
processors. “Invisible computing” requires less energy, provides imagery with higher
resolution and contrast and is faster than conventional computing for trivial visualization
processes.
Examples of more than thirty “invisible computing” surfaces and objects displayed at the IN
booth included an interactive floor flashing way-finding information, a special edition of Time
magazine with interactive graphics, ceramic white boards where calendars and calculators
could be activated and de-activated, plastic bottles that incorporate information displays,
interactive jeans, tables with interactive games, bottles of wine that offered interactive
information and color-changing concrete panels.” by Prof. António Câmara, private
communication.
I wish to thank my scientific supervisors A. Jorge Parola, J. Fernando Pina and the entire FOT Group not only for the facilities but also for the scientific support during the last four years that still continues. Prof. António Câmara for the opportunity to take part on the development of his visionary concepts. YDreams team in special to Edmundo Nobre and my co-supervisor Ivan Franco for the trust deposited in my work.
1
Chapter 1
2
1.1 Motivation
“The technology required for ubiquitous computing comes in three parts: cheap and low-power computers that include equally convenient displays, a network that ties them all together, and software systems implementing ubiquitous applications.” in “The Computer for the 21st Century” by Mark Weiser.1
Mark Weiser’s vision of computing and society predicts the so-called third wave of computing - ubiquitous computing (UC). Mark Weiser resumes the relationship between computers and society in three main eras related with technology development and usability. In the first era, one computer was shared by several people – mainframe era. In the second era, one
computer belongs to one person – personal computer era.2 Finally, the upcoming era will be
the UC era, where computers will spread all around us and the computer to person ratio will be much larger than ever before.
Presently we are living in the personal computing era, however, the decline in laptop prices,
the proliferation of small and mobile devices equipped with strong processors and the dissemination of the internet are preparing our society towards UC. In a not so futuristic scenario, customized computers will integrate our surrounding embedded in the objects of our daily life. Functionalities will be added to common objects, they will turn more interactive and smart. Information will be available without any conscious input from the user; computers will integrate symbiotically our environment and costumes in such a way that they become invisible.
Convenient, cheap and low-power consumption displays are some of the challenges predicted by Mark Weiser to the development of UC. The information can be processed in a completely different physical place from the end-user, the computer can be off-site (for example, weather forecast); however, communication of the results must happen in loco.
Processing information without an effective communication is useless.
Visual communication is one of the most primitive ways humankind uses to communicate and record information. The oldest evidences of visual communication are from ca. 40000
years ago3 in the form of paintings in caves and still have an enormous presence in our society. Pictograms are still the best way to produce effective communication; a good example is traffic signs. On the other hand, colours by themselves are also able to transmit information or feelings.
3
are bulky size, high weight and energy demanding, plasma technology is also a power consuming technology ant not liable to miniaturization.4 Companies like Siemens, Fujitsu, Xerox, DuPont, Sony, Siemens and Phillips are investing significant resources in the development of transparent, flexible and energy efficient displays using alternative technologies. The most recent examples are based on the organic light emitting diodes (OLED), electrophoretic suspended particles displays, electro-wetting displays and electrochromic displays.4 The strategy adopted by such companies is always based on the highly technology demanding matrix of pixels to reach video and image on demand capabilities. However, we believe that this is neither the only nor the most successful way to reach information ubiquity.
At the same time as computers will spread around us, their complexity and multi-function capacity should inversely decrease. It is a waste of resources and energy to use powerful processors to run simple tasks for specific situations. Ubiquitous computing should be shaped for minimal architecture to process customized information. For sure, we do not want our cup of coffee to perform mathematical calculus! The same holds for the displays technology. António Câmara (CEO of YDreams Company) identified a technological gap between static information displays, like an advertisement poster, and state-of-the art displays.
“Chemical Approaches to Ubiquitous Computing” is a Ph.D. project that aims to study and develop low information content displays based on chemical solutions. A brief exposure of the chemical and technology background involved in this work is presented in this chapter; at the end, an outline of the work is presented.
1.2 Chromogenic Systems and Applications (Background)
For a long time chromogenic compounds and materials have been studied and explored in different scientific fields like, analytical chemistry (e.g. acid-base titration, complexometric
titration), physical chemistry5, smart materials6 and even in art.7 As a general definition chromogenic systems are those which produce (-gen, from Latin genus = produce) colour
(chromo-, from Greek khr ma = colour). IUPAC does not define the term chromogenic and
4
Since Isaac Newton’s experiments about optics, colours are known as the elementary components of light. In 1704 Newton’s conclusions about light and colour abolished the basic fundamentals that ruled colour knowledge since Aristotle and set a new age for colour science and optics.8 Light interaction with bulk matter can result in reflection, scattering, absorption and transmission of light (see Fig.1.1). Depending on the light and the nature of the object, several of these phenomena can happen at the same time.
Light
Reflectance
Transmittance Reflectance
Absorption
Scattering Scattering
Object
Figure 1.1 – Light interaction with matter; reflectance, scattering, absorption and transmittance
Colour genesis is explained by physical and chemical mechanisms. Kurt Nassau9 gives a more detailed classification of colour generation based on these two mechanisms: i) vibration and simple excitations of electrons; ii) electronic transitions involving ligand field effects; iii) transitions between molecular orbital; iv) transitions involving energy bands; v) geometrical and physical optics. Physical optics are responsible for the blue sky, rainbows, red sunset, iridescent colours in fauna and for the spectral decomposition of white light by a prism. Geometrical and physical optics deal whit the different interactions between light and bulk material - refraction, scattering and interference.
Chemical colour results from the perfect match in energy between the visible electromagnetic radiation (380 - 780nm) with electrons and their electronic energy levels in chemical species. Electromagnetic wavelengths lower than ultra-violet radiation (UV, <200nm) are too energetic and molecular structures are usually irreversibly destroyed or altered. On the other hand, electromagnetic radiation with wavelengths higher than 780nm up to the near infrared region radiation (NIR) can still interact with several kinds of compounds (strongly conjugated organic molecules, some metal complexes with d-d or f-f transitions); however, we humans are not able to see this interactions.
5
Table 1.1 – Colour perceived as a function of the wavelength of radiation
Absorbed Wavelength (nm) Colour of the absorbed light Observed object colour
400 Violet Green-yellowish
425 Indigo blue Yellow
450 Blue Orange
490 Green-bluish Red
510 Green Purple
530 Green-yellowish Violet
550 Yellow Indigo blue
590 Orange Blue
640 Purple Green bluish
730 Red Green
The next sections are organized in function of the extend stimulus that leads to colour change and describe the most relevant chromogenic application for each area.
1.2.1 Electricity
Electrochromic materials have the ability to change reversibly its colour properties (coloration/bleaching) when submitted to a determined electric potential. Electrochromism can occur either by an electron-transfer process (redox electrochromism) or as a response to strong enough electric potential (non-redox electrochromism).
Originally, the term electrochromism was attributed to the shift of the UV-Vis bands due to the presence of a strong electric field - Stark effect.10 The Stark effect is a non-redox electrochromic phenomenon.11 Nevertheless, the majority of the reported electrochromic systems are redox electrochromism (see Eq.1.1). In the following text, the term electrochromism is always related to the redox electrochromism.
Oxidized form (colour A) + electron(s), e- Reduced form (colour B) Eq. 1.1
6
electrochromes are: methyl viologen (MV)13, tungsten oxide (WO
3)14, Prussian Blue (PB)15 and the semiconductor polythiophene derivative PEDOT (poly(ethylene dioxythiophene).16
Electrochromic Devices
An electrochromic device (ECD) can be regarded as an electrochemical cell where colour changes occur upon electrochemical reactions of two or more redox active electrochromic materials electrically connected by an external circuit and physically separated by an ionic conducting layer (electrolyte layer), see Fig.1.2. The electrochromic material must be in contact with the electrode and with the electrolyte layer to exchange both electrons and ions, respectively. ECD performance is greatly influenced by both the electron exchange and ions exchange kinetics and ultimately controlled by the slowest process. The colouration and bleaching processes are controlled by the amount of the overvoltage and polarity applied at the electrode terminals.
Conductive layer Electroactive material
Electrode substrate
Electrolyte layer
External electric circuit and Power supply
Figure 1.2 – Example of an electrochromic device with the “sandwich” like architecture.
An ECD requires two electroactive materials and at least one of them must be electrochromic. The electrochemical reduction in one of the electrodes is balanced electrically by the electrochemical oxidation at the second electrode. In a second implementation, both electroactive materials can be electrochromic, resulting in either a complementary configuration or a symmetrical configuration.
7
On the other hand, symmetrical configuration results when the same electrochromic material is used at both electrodes. An opaque layer is within the electrolyte layer to mask the colouration process occurring at the second electrode. The symmetric cell presents a non-synchronised colouration and bleaching response from the two electrodes, while one is coloured the other is bleached and vice-versa.
To observe successfully the colour transition of ECD at least one of the electrodes substrate must be optically transparent. The most common electrodes substrates are glass (non-flexible applications) or a plastic film (the most common are the polyethylene terephthalate, PET and polyethylene naphthalate, PEN used for flexible applications) coated with a thin film of a transparent conductive oxide (TCO); tin-doped indium oxide (ITO) or the fluorine-doped tin oxide (FTO). Several substrate-TCO alternatives are commercially available whereas glass-ITO, PET-ITO and FTO-ITO are the most reported in the literature. As defined by Rosseinsky et al11 the electrode where the colour transition is observed should be called the
primary electrode and the second the counter-electrode. In this case, the primary electrode must always be optically transparent while the counter-electrode can be either completely transparent or reflective.
8
ECD can be operated in the transmittance (ECD-T) or in the reflectance (ECD-R) mode (see Fig.1.3).
Incident light
Incident light
Emergent light (Transmittance)
Emergent light (Reflectance)
A
B Incident light
Incident light
Emergent light (Transmittance)
Emergent light (Reflectance)
A
B
Figure 1.3 – ECD in transmittance mode (A), and in reflectance mode (B)
The ECD-T requires that both the primary and the counter-electrodes are optically transparent. On the other hand, the ECD-R only requires one optically transparent electrode; the other electrode can be made of a thin metallic reflective film, like graphite, gold or platinum alloys. The incorporation of a light scattering layer over the counter-electrode or within the electrolyte layer improves the reflectance characteristics of the ECD-R (see Fig.1.5). A large variety of ECD combinations can be explored depending on the specific application. As an example, ECD-R the reflective layer can take different colour appearance and create new colour combinations with the colours of the electrochromic materials.
9
ECD Parameters
The full characterization of an ECD includes determination of parameters such as: contrast ratio (CR), response time (τ), write-erase efficiency, stability towards cycling tests, power
consumption and coloration efficiency (CE).11
CR is a measure to denote the intensity of colour formed, as seen by eye (see Eq.1.2).
x R
R0
=
CR Eq. 1.2
Where Rx is the intensity of light reflected diffusely by the coloured state of the device, and R0 is the intensity of reflected light from a non-shiny white card.11
The write-erase efficiency corresponds to the fraction of the originally formed coloration that can be subsequently electro-bleached. For complete reversible electrochromes, the value should be 100%. The write-erase efficiency is however related with the time during which electric potential is applied, slower systems will require longer time to recover completely the initial state. Considering the application requirement the systems may or may not be able to recover completely the original state. Great variability of experimental conditions have been reported to calculate the write-erase efficiency of electrochromic systems, the results reported are not directly comparable.
Power consumption can be calculated for both coloration and bleaching process by Eq.1.3.
∆
= tf
t I t dt
E
0
) (
V Eq. 1.3
Where ∆V is the amount of electrical potential applied to the ECD and I(t) is the current spent
during the cycle.
The stability of the ECD to the number of electrochemical cycles (write-erase cycles or cycling) represents the number of cycles that can be performed before significant extent of degradation has occurred. The maximum colour variation of a specific R and the
ECD-T (Full switch), between the bleached and the coloured states, is measured at the beginning
of the cycling experiment at a specified wavelength (λnm): ∆%Rλnm,0, ∆%Tλnm,0, respectively. A double potential step voltage function is applied to ECD in order to operate a full cycle (i.e. a
Full switch): write-erase (colouration-bleaching) and vice versa. The comparison of the
maximum colour variation (100% of Full switch) after the operation of n cycles, ∆%Rλnm,n or
10 0 , , % 100 % 100 nm n nm R R variation colour of loss % λ λ ∆ × ∆ −
= Eq. 1. 4
The CE of the electrochromic system is defined by Reynolds et al.21 as follows in Eq.1.5 and 1.6, for ECD-T and ECD-R respectively:
' , ,
Q
A
CE
x nmn∆
∆
=
λ Eq. 1.5'
% , ,
Q
R
CE
x nmn∆
∆
=
λ Eq. 1.6where ∆%Rx,λnm,n and ∆%Tx,λnm,n is the x percentage of full swithc. i.e. the fraction of ∆%Rλnm,n and ∆%Tλnm,n respectively, and Q’ is the amount of charge per unit of active electrochromic area passed during the respective period of time.
Spectroelectrochemistry
Spectroelectrochemistry (SEC) is the most useful characterization procedure for electrochromic materials and devices. SEC combines electrochemistry and spectroscopy techniques. In a specially designed electrochemical cell, a redox active compound is oxidised or reduced. The products of the redox transformation are monitored in situ by spectroscopic
techniques. In the particular case of chromogenic systems, the UV-Vis spectroscopy is used. In the case of electrochromic films deposited over PET-ITO electrodes, the three electrodes electrochemical cell is mounted in the UV-Vis spectrophotometer cuvette. On the other hand, ECD are directly inserted in the spectrophotometer sample compartment in a perpendicular geometry with the beam of light. The diffuse reflection of the ECD-R is recorded by an integrating sphere.
The electrochromic systems can be controlled both by potentiostatic and potentiodinamic techniques; at the same time, the UV-Vis data is recorded either in absorbance or in reflectance mode. The typical outcome of the SEC experiments is the absorbance (chronoabsorptometry, ∆A or ∆%T) or reflectance (∆%R) evolution of the system. On the
11
Commercial applications
Electrochromic materials have been attracting considerable attention due to their potential applications as controlled optical filter and visual displays. Product applications are self-darkening rear-view mirrors, smart windows, electronic paper and smart labels. Despite the first patent describing the application of an electrochromic effect dates from 192922, the number of successful commercial applications of ECD is reduced. Actually, the only known profitable ECD application is the best-selling electrochromic rear-view mirror from Gentex.
Self-darkening rear-view mirror and windows
The auto-dimming rear-view mirrors reduce the inconvenient and sometimes dangerous headlight glare from the vehicles travelling behind, disturbing the driver. Gentex is the company leading the auto-dimming automotive market.23 The scientist responsible for the invention of the electrochromic rear-view mirror is the chemist Dr. Harlan Byker. Today Dr. Harlan Byker is president and owner of the Pleotint Company (developing thermochromic windows).
The rear-view mirrors from Gentex incorporate a light sensor that detects when headlight glare occurs and triggers the electrical potential of the ECD built in the rear-view. The ECD architecture is based on the reflective mode (ECD-R) and the redox active material are dissolved in the liquid electrolyte layer. The electrical potential promotes the electrochemical colouration of the primary electrode and the colouration of the counter-electrode using a complementary colouring electrochromic material. When the electrical potential is removed, both electroactive materials will diffuse away from the electrodes. The recombination of the oxidised and reduced species will promote the bleaching process chemically. The bleaching time will be controlled by the diffusion of the electrochromic species, however, the process can also be accelerated if an opposite electrical potential (compared to the one used to trigger colouration) is imposed between the electrodes for a short period of time.
A second application of self-coloured ECD has been applied for “smart-windows”.24 Smart windows were applied in special architectural projects like the switchable glazing applied in the Stadtsparkasse Dresden am Altmarkt in Dresden and also for first class airplane passenger windows in the “Dreamliner” Boeing aircraft.25 At present, SAGE Electrochromics, Inc. is the only manufacturer selling electrochromic insulating glass units.26
Displays
12
viewing angle, natural contrast (comparable to pigments used in conventional inks) and power saving technology. Actual ECD display products can be relatively bent without damaging the screen and the thicknesses are around hundreds of nanometres.
It is worth to note that in non specialized literature, electrochromism is often confused with competing technologies for flexible displays such as: electrophoretic technology from E-Ink27, or the Avesso displays based on acidochromic compounds28 and electrowetting technology from Liquivista.29
PaperDisplay
PaperDisplay’s products are based on Acreo's EC technology that uses functional printing inks in conventional printing equipment to achieve low cost visualization displays based on photographic paper.
PaperDisplay presents a colour transition between light-blue and dark-blue corresponding to the neutral and doped states of the organic semiconductor PEDOT. The display is built over photographic paper coated with PEDOT electrochromic material from Agfa - Orgacon. In opposition to “sandwich” like ECD architecture (see Fig.1.2), Acreo EC technology adopts a horizontal architecture where the two electrodes are deposited on the same plane – horizontal architecture (see Fig.1.4).
Electrolyte
PEDOT:PSS
Photographic paper
Figure 1.4 – Schematic view of the ECD from Acreo EC technology with a "side-by-side" architecture.
The electrodes 1 and 2 lay down on the same plane, side by side electrically separated but connected by the electrolyte layer. Acreo technology does not require a metallic or semi-metallic electric conductive layer. A special conductive grade of the PEDOT:PSS layer is used as the electrochromic layer and electrode, at the same time.
13
NTera
NTera developed electrochromic displays with the trademark NanoChromic Display (NCD). The ECD architecture used is based on the “sandwich” like architecture working in a reflective mode (see Fig.1.5).
1 2
Figure 1.5 – ECD architecture employed by NTera where the primary electrode is composed by a chemisorbed viologen derivative on the surface of TiO2 nanoparticles (coated PET-ITO) (1), a
dispersion of light scattering TiO2 nanoparticles is incorporated in the electrolyte layer (2).
The electrochromic layer (see Fig. 1.5, 1) is made with a phosphonated viologen derivative
that is adsorbed to titanium dioxide (TiO2) nanoparticles. This strategy is similar to the one proposed in dye sensitized solar cells (DSSC) by Grätzel.33 This strategy has the advantages of, i) increase the concentration of electrochromic molecules pre electrode area and ii) avoids diffusion of the electrochrome away from the electrode. The NCD is based on transparent plastic and the semi-metal conductive layer is fluorine-doped tin oxide.11 The reflective mode was used to improve the CR. The light scattering layer is also composed by TiO2 nanoparticles within the electrolyte layer.
NCD are also built by printing techniques such as screen-printing, flexography and ink-jet. The NTera company is the only known fabricant commercializing screen-printable inks that allow to build an ECD based on the NanoChromic technology.34
1.2.2 Light
14
Eq. 1.7
Eq. 1.8
Accordingly to the photochemical backward reaction, systems can be classified in T-type, P-type or both at the same time. Considering a photochemical reactive species, A which is photochemically converted to B, the backward reaction can be controlled either thermally (T-type system, Eq. 1.7) or by light excitation (P-(T-type system, Eq. 1.8) and depending on the activation energy for the backwards reaction (B to A) and on the operation temperature both processes can take place.
Spiropyrans, spirooxazines and chromenes are examples of T-type photochromic systems (see Fig.1.6), while fulgides and diarylethenes are characterized to be P-type photochromic (see Fig.1.7).36
Figure 1.6 – T-type photochromic compounds, spiropyrans (A), spirooxazines (B) and chromenes (C)
Figure 1.7 – P-type photochromic compounds, fulgides (A) and diarylethenes (B)
hν
A (colourless) B (coloured)
∆
hν
A (colourless) B (coloured)