Licenciada em Engenharia Biológica
Monitoring and modelling of membrane
bioreactors for wastewater treatment
incorporating 2D fluorescence spectroscopy
Dissertação para obtenção do Grau de Doutor em Engenharia Química e Bioquímica,
Especialidade em Engenharia Bioquímica
Orientador: Maria da Ascensão Miranda Reis, Professora Associada com Agregação, FCT-UNL
Co-orientador: João Goulão Crespo, Professor Catedrático, FCT-UNL
Co-orientador: Gilda Carvalho, Investigadora de Pós-doutoramento, IBET e REQUIMTE
Júri:
Presidente: Doutora Maria Rosa Santos de Paiva
Vogais: Doutor Torove Leiknes
Doutor João Paulo Serejo Goulão Crespo
Doutora Maria da Ascensão Carvalho Fernandes Miranda Reis Doutor João Pedro Martins de Almeida Lopes
Doutora Gilda de Sousa Carvalho Oehmen
Doutor António Manuel Pedro Martins
Monitoring and modelling of membrane bioreactors for wastewater treatment incorporating 2D fluorescence spectroscopy
Copyright © Cláudia Filipa Reis Galinha Loureiro, Faculdade de Ciências e Tecnologia da Universidade Nova de Lisboa, Universidade Nova de Lisboa
A Faculdade de Ciências e Tecnologia e Universidade Nova de Lisboa têm o direito, perpétuo e sem limites geográficos, de arquivar e publicar esta dissertação através de exemplares impressos reproduzidos em papel ou de forma digital, ou por qualquer outro meio conhecido ou que venha a ser inventado, e de a divulgar através de repositórios científicos e de admitir a sua cópia e distribuição com objectivos educacionais ou de investigação, não comerciais, desde que seja dado crédito ao autor e editor.
i
AGRADECIMENTOS
Em primeiro lugar, gostaria de agradecer aos orientadores deste meu trabalho. À São e ao João Paulo pela oportunidade que me deram em trabalhar com os dois. Agradeço imenso o trabalho que me propuseram, e o apoio, optimismo e rigor com que me orientaram ao longo destes anos. À Gilda, mais do que minha orientadora, sempre ao meu lado, desde o primeiro dia; o meu muitíssimo obrigado.
Gostaria também de agradecer às pessoas que me ajudaram a desenvolver o presente trabalho. À Carla Portugal, não só pela ajuda com a fluorescência, mas também pelo indiscutível bom humor. Ao Rui Oliveira, que me iniciou na modelação e aconselhou quando foi preciso. Ao Giuseppe Gugliemi, pela sua imprescindível colaboração neste trabalho, e dedicação, mesmo em tempos mais conturbados.
Agradeço ainda todo o apoio científico e pessoal que recebi dos membros do BioEng, os que estão e os que estiveram. Em especial, à Rita Ricardo, companheira desde o início desta nossa jornada, e com quem aprendi imenso, à Filipa Pardelha e à Rita Moita pela companhia e apoio diários que me têm dado, à Andreia Teixeira pelos momentos de boa disposição, à Ana Lanham, pelo entusiasmo contagiante e motivação constante.
Aos meus pais, que sempre me incentivaram e apoiaram, com infinita paciência. À
minha irmã, que muito cedo plantou em mim o “bichinho das ciências”.
E finalmente, ao Bruno, que esteve sempre a meu lado e me apoiou incondicionalmente.
Ao Guilherme
iii
RESUMO
Os biorreactores de membranas (MBRs, ‘membrane bioreactors’) para o tratamento de
águas residuais combinam o processo de lamas activadas com um passo de filtração para obtenção de um efluente limpo, livre de sólidos. Os MBRs representam uma tecnologia em expansão no tratamento de águas residuais sobretudo devido ao reduzido espaço que requerem e à elevada qualidade do efluente obtido. No entanto, a colmatação das membranas pode reduzir o desempenho do MBR. Por este motivo, no presente trabalho, pretendeu-se estudar a monitorização dos MBRs, com o objectivo de minimizar o número de parâmetros de monitorização necessários para descrever o desempenho do processo e obter uma monitorização em tempo real com recurso mínimo a técnicas laboratoriais demoradas. Para este fim, estudou-se a aplicabilidade da fluorescência bidimensional em meios biológicos complexos, tais como as lamas activadas utilizadas para o tratamento de águas residuais. A fluorescência bidimensional mostrou ser uma técnica abrangente, capaz de recolher informação relevante sobre o estado do sistema em tempo real. Devido à complexidade da informação contida nos espectros de fluorescência, usaram-se técnicas de estatística multivariada, tais como análise de componentes principais e projecção de estruturas latentes (PLS, ‘projection to latent structures’), para extrair a informação dos espectros e correlacioná-la com parâmetros de operação e de desempenho do MBR. O uso de modelos estatísticos permitiu a previsão de parâmetros chave para o desempenho do MBR usando somente dados de processo impostos ou facilmente adquiríveis em tempo real. Adicionalmente, a modelação estatística foi combinada com um modelo mecanístico, numa estrutura híbrida, de forma a melhorar a previsão mecanística. Este estudo demonstrou ser possível usar modelos PLS para incorporar dados de fluorescência obtidos em tempo real, de modo a melhorar a previsão mecanística sem requerer análises laboratoriais adicionais.
Palavras-chave: Biorreactor de membranas; tratamento de águas residuais;
v
ABSTRACT
Membrane bioreactors (MBRs) for wastewater treatment combine an activated sludge process with a filtration step for solids separation. The application of MBRs for wastewater treatment is growing worldwide due to their compactness and high effluent quality. However, membrane fouling, mostly associated to biologic products, can reduce MBR performance. Therefore, the present study aimed at improving the monitoring of MBRs with simultaneous reduction of the analytical effort. Regarding this objective, the applicability of 2D fluorescence spectroscopy as a monitoring tool in complex biological media, such as activated sludge systems for wastewater treatment, was evaluated. It was shown that 2D fluorescence spectroscopy is a comprehensive technique, able to assess the system status at real-time. Due to the complexity of fluorescence interactions in 2D fluorescence spectroscopy, multivariate statistical analysis, such as principal components analysis (PCA) and projection to latent structures (PLS), was used to extract the information contained in fluorescence spectra and correlate it with operating and performance parameters of an MBR. Through this modelling approach, it was possible to predict key performance parameters of an MBR based only on on-line monitoring data (including 2D fluorescence) or in combination with few additional imposed operating parameters. Additionally, a modelling hybrid approach was developed to improve the predictions of a mechanistic model for MBR performance. It was found that PLS models can be used to incorporate on-line data from 2D fluorescence spectroscopy in order to improve the mechanistic prediction without additional laboratory analysis.
Keywords: Membrane bioreactor; wastewater treatment; monitoring; 2D fluorescence
vii
CONTENTS
1. Introduction………. 1
1.1. Motivation and work objectives………….………. 1
1.2. Research strategy and thesis outline……….. 2
2. State of the art………. 7
2.1. Biological wastewater treatment………….……… 7
2.1.1 Biological removal of nutrients..………. 8
2.1.2. Conventional activated sludge systems…...……… 8
2.2. Membrane bioreactors ……….……….……… 9
2.2.1. Configurations of membrane bioreactor….……… 10
2.2.2. Filtration process in MBRs………. 11
2.3. Monitoring ……….………. 15
2.3.1. Conventional monitoring of wastewater treatment plants…… 15
2.3.2. Monitoring membrane bioreactors………..…… 15
2.4. Modelling MBRs…….……….………. 20
2.4.1. Activated sludge model……… 20
2.4.2. Statistically-based tools……… 22
3. Real-time monitoring of membrane bioreactors with 2D fluorescence data and statistically-based models………...….……… 25
3.1. Introduction………...….………. 26
3.2. Methods…………..…….…..………..……… 28
3.2.1. Membrane bioreactor………..……….. 28
3.2.2. 2D fluorescence spectroscopy……….……….. 28
3.2.3. Data collection……… 29
3.2.4. Multivariate data analysis………. 29
3.3. Results and discussion……….……… 31
3.3.1. PLS models based on 2D fluorescence spectroscopy…. 31 3.3.2. Principal component analysis of operational and performance parameters ……….……….………... 34
viii
4. 2D fluorescence as a fingerprinting tool for monitoring wastewater treatment
systems………...…. 39
4.1. Introduction………...………. 40
4.2. Materials and Methods………..………… 42
4.2.1. Water and wastewater samples and aqueous solutions used for 2D fluorescence analysis……….……. 42
4.2.2. Membrane bioreactor set-up and operation ……… 43
4.2.3. Acquisition of 2D fluorescence spectra……… 43
4.2.4. Mathematical data deconvolution ……… 44
4.3. Results and Discussion……… 44
4.3.1. Discriminating water samples of different nature with 2D fluorescence spectroscopy ………..… 44
4.3.2. Assessment of interference effects on protein fluorescence spectra ……….... 49
4.3.3. Use of multivariate statistical analysis to extract quantitative information from EEMs ……….. 51
4.4. Conclusions………...……. 53
5. Multivariate statistically-based modelling of a membrane bioreactor for wastewater treatment using 2D fluorescence monitoring data……….… 55
5.1. Introduction……….……… 56
5.2. Materials and methods……….……… 58
5.2.1. Membrane bioreactor set-up and operation……… 58
5.2.2. Sampling and chemical analysis……….. 60
5.2.3. 2D fluorescence spectra……… 60
5.2.4. Development of PLS models……….. 61
5.3. Results and discussion……….……….…… 63
5.3.1. Modelling of transmembrane pressure……… 65
5.3.2. Modelling of chemical oxygen demand (total and soluble) in the permeate………....……….……. 68
5.3.3. Modelling of nitrogen in the permeate……… 74
5.3.4. Modelling of total phosphorus in the permeate………. 76
ix
5.4. Conclusions………...…….. 78
6. Development of a hybrid model strategy for monitoring membrane bioreactors... 81
6.1. Introduction……….……… 82
6.2. Materials and methods………..……… 84
6.2.1. Membrane bioreactor set-up and operation ……… 84
6.2.2. Sampling and chemical analysis……….. 85
6.2.3. 2D fluorescence spectra……….... 86
6.3. Hybrid model development……….……… 86
6.3.1. Development of the ASM ………..…… 86
6.3.2. Development of PLS models………..… 87
6.4. Results and discussion……….……… 90
6.4.1. Activated sludge models…….……… 90
6.4.2. Hybrid Modelling……… 92
6.5. Conclusions……….……….………. 99
7. Conclusions and future work……… 101
7.1. Final overview and conclusions………...… 101
7.2. Suggestions for future work………... 103
xi
LIST OF FIGURES
2.1. Side-stream and submerged MBR configurations………...……… 10
2.2. Classification of membranes and characteristic retained compounds, based on
membrane separation ranges and particle sizes, respectively……….… 11
3.1. Representation of the pilot MBR located in at the Lavis wastewater treatment plant
(Trento, Italy)………..……… 28
3.2. Prediction of total permeate COD based on 2D fluorescence spectra acquired in the
permeate……… 31
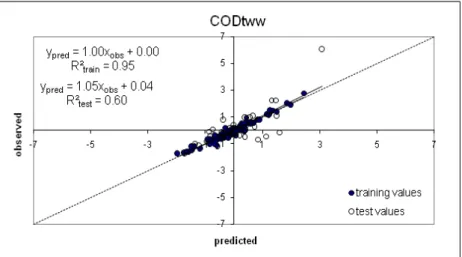
3.3. Prediction of total wastewater COD based on 2D fluorescence spectra acquired in
the wastewater………. 32
3.4. Coefficient values of the PLS model for prediction of total COD in wastewater
plotted in function of the respective variable position in fluorescence matrices….. 33
3.5. Coefficient values of the PLS model for prediction of total COD in permeate
plotted in function of the respective variable position in fluorescence matrices…… 33
3.6. Loadings plots for PC1, PC2 and PC3 obtained from PCA of the process and
operating parameters used to characterise the pilot MBR……….… 35
4.1. 2D fluorescence spectra of a) spring water collected in Alenquer, Portugal; b)
surface water collected from the river Tagus, Portugal; and c) domestic wastewater
collected at the entrance of a WWTP in Almada, Portugal……….. 45
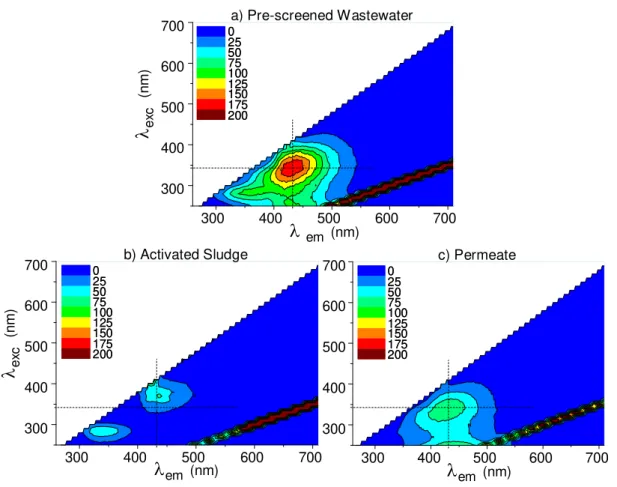
4.2. 2D fluorescence spectra of a) influent pre-screened wastewater, b) activated sludge
and c) effluent permeate collected in the WWTP of Lavis in Italy at the 7th day of
operation……….……… 46
4.3. 2D fluorescence spectra of a) influent pre-screened wastewater, b) activated sludge
and c) effluent permeate collected in the WWTP of Lavis in Italy at the 23rd day of
operation………. 47
4.4. 2D fluorescence spectra of a) a BSA solution with a concentration of 10 mg L-1, (b)
a commercial humic acid solution (10 mg L-1) and c) a mixed solution of humic acid
and BSA, both at 10 mg L-1……….… 48
4.5. Example of fluorescence interference effects in surface water: EEM of a BSA
solution (10 mg L-1) in a) deionised water and b) prepared with surface water..….. 51
4.6. Observed values of COD in the permeate represented vs the corresponding values
xii
5.1. TMP prediction: a) without fluorescence data; b) with permeate fluorescence data.
Regression coefficients of model inputs for TMP prediction: c) without fluorescence
data; b) with permeate fluorescence data ...………..………. 66
5.2. TMP prediction without fluorescence and without the outlier data: a) model fitting; b) regression coefficients of model inputs for TMP prediction……… 67
5.3. Prediction of the total COD in the permeate (CODtp): a) without fluorescence data; b) with permeate fluorescence data. Regression coefficients of model inputs for CODtp prediction: c) without fluorescence data; b) with permeate fluorescence data…… 69
5.4. Prediction of the soluble COD in the permeate (CODsp): a) without fluorescence; b) with permeate fluorescence and on-line parameters. Regression coefficients of model inputs for CODsp prediction: c) without fluorescence; b) with permeate fluorescence and on-line parameters………...………. 71
5.5. Prediction of the total nitrogen in the permeate (Ntp): a) without fluorescence; b) with 3 components of permeate EEMs compression. Regression coefficients of model inputs for Ntp prediction: c) without fluorescence; b) with 3 components of permeate EEMs compression……….………..….. 73
5.6. Prediction of total nitrogen in the permeate (Ntp): a) with 10 components of permeate EEMs compression; b) with 10 components of permeate EEMs compression plus their quadratic and interaction terms……… 74
5.7. Prediction of: a) NOx in the permeate with 10 components of permeate EEMs compression plus their quadratic and interaction terms; b) total phosphorus in the permeate (Ptp) with 6 components of all EEMs compression plus their quadratic and interaction terms; c) MLSS with 10 components of sludge EEMs compression plus their quadratic and interaction terms.……….………… 76
6.1. Different input combinations used in PLS modelling for prediction of MLSS, CODp and NOxp residuals from ASM………. 89
6.2. ASM3e prediction of a) Mixed liquor suspended solids, b) COD in the permeate and c) Nitrite and nitrate concentration in the permeate. The predicted values are plotted against the observed values for 130 experimental observations obtained throughout the validation period………..……… 91
6.3. MLSS prediction by hybrid models.……….………. 94
6.4. COD in the permeate prediction by hybrid models……… 96
xiii
LIST OF TABLES
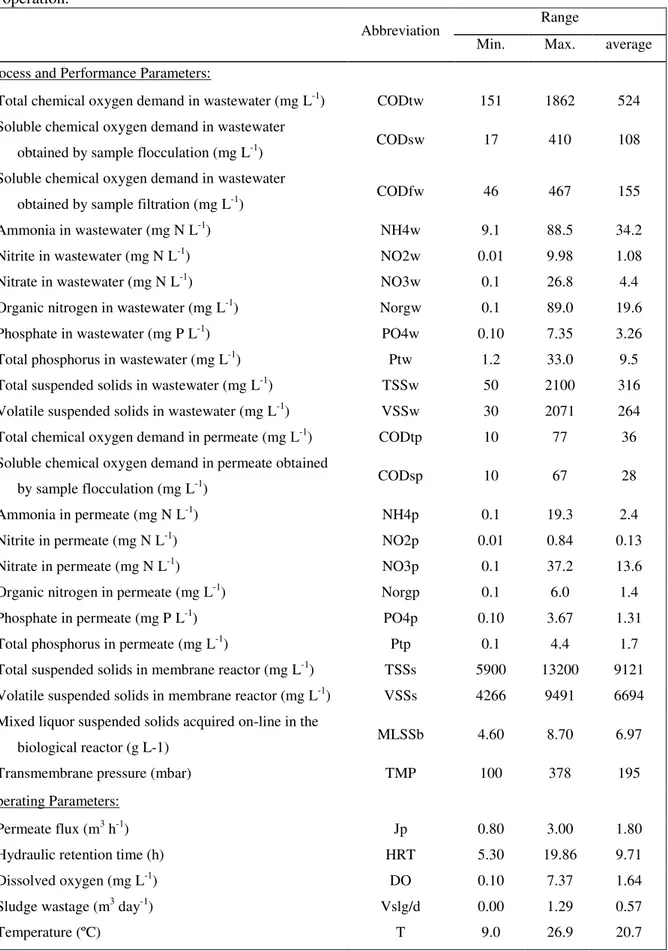
3.1. Monitoring parameters and respective range of values assessed during MBR
operation………...………….. 30
4.1. Decrease in fluorescence intensity at exc = 280 nm and em = 345 nm (maximum
emission of BSA) of a standard BSA solution in comparison with solutions prepared
with either commercial humic acids (at 10 mg L-1), or real water/wastewater
samples………...… 50
5.1. Operating and analytical data collected during the 10 months of MBR operation,
and input and output parameters used in PLS modelling……….. 59
5.2. Statistical parameters for the selected PLS models……….. 64
6.1. Range of values of wastewater characteristics and mixed liquor suspended solids
during both calibration and validation periods of the ASM……… 85
xv
ABBREVIATIONS
ASM Activated sludge models
ASM Activated sludge models
ASM3e Extension of activated sludge model number 3
BOD5 5-day biological oxygen demand at five days
BSA Bovine serum albumin
CAS Conventional activated sludge
CLSM Confocal laser scanning microscopy
Cn nnd compression component of fluorescence
COD Chemical oxygen demand
CODfw Chemical oxygen demand after filtration in wastewater
CODsp Soluble chemical oxygen demand, after flocculation, in the permeate
CODsw Soluble chemical oxygen demand, after flocculation, in wastewater
CODtp Total chemical oxygen demand in the permeate
CODtw Total chemical oxygen demand in wastewater
CST Capillary suction time
DO Dissolved oxygen
EEMs Excitation-emission matrices
EPS Extracellular polymeric substances
ESEM Environmental scanning electron microscopy
FTIR Fourier transform infrared spectroscopy
FT-NIR Fourier transform near infrared
HP-SEC High performance size exclusion chromatography
HRT Hydraulic retention time
IPW Iterative predictor weighting
ISE Iterative stepwise elimination
IWA International Water Association
Jp Permeate flux
LV Latent variables
MLSS Mixed liquor suspended solids
MLSSb Mixed liquor suspended solids, acquired on-line, in the biological tank
NH4p Ammonia in the permeate
NH4w Ammonia in wastewater
NMR Nuclear magnetic resonance
NO2p Nitrite in the permeate
NO2w Nitrite in wastewater
NO3p Nitrate in the permeate
NO3w Nitrate in wastewater
Norgp Organic nitrogen in the permeate
Norgw Organic nitrogen in wastewater
PARAFAC Parallel factor analysis
PC Principal component
xvi
PLS Projection to latent structures
PO4p Phosphate in the permeate
PO4w Phosphate in wastewater
Ptp Total phosphorus in the permeate
Ptw Total phosphorus in wastewater
RMSEP Root mean square error of prediction
SEC Size exclusion chromatography
SEM Scanning electron microscopy
SMP soluble microbial products
SRT Solid retention time
SS Readily biodegradable substrate
SVI Sludge volume index
T Temperature
TMP Transmembrane pressure (mbar)
TOC Total organic carbon
TSSs Total suspended solids in the sludge
TSSw Total suspended solids in wastewater
Vslg/d Volume of sludge purged per day
VSSs Volatile suspended in the sludge
VSSw Volatile suspended solids in wastewater
WWTP Wastewater treatment plant
XSTO Storage compounds
YH,S Heterotrophic direct growth on readily biodegradable substrate
YH,STO Heterotrophic growth on stored substrates
YSTO Conversion of readily biodegradable substrate into storage compounds
µA20 maximum growth rate of autotrophs
µH,S20 maximum growth rate of heterotrophs on readily biodegradable substrate
1
Chapter
1
I
NTRODUCTION1.1. MOTIVATION AND WORK OBJECTIVES
Membrane bioreactor (MBR) technology is increasingly applied in wastewater treatment plants, mainly due to their small footprint and high effluent quality. The increasing demand for MBR technology requires the development of adequate monitoring and control techniques, particularly in view of the high operational costs associated to membrane fouling. Extracellular polymeric substances (EPS) are recognised as major fouling agents in MBRs. EPS and cells may deposit and/or adsorb at the membrane surface and within the pores causing fouling. Therefore, monitoring and control during MBR operation is essential. Additionally, adequate and easy operating monitoring tools for MBR will further increase confidence and acceptance of MBR technology, which has been pointed out as one of the main factors influencing the MBR market (Judd, 2006).
2
2D fluorescence spectroscopy is a sensitive, on-line, non-invasive technique that can provide rapid information about the composition of complex biological media. Biological wastewater treatment media contain high quantities of natural fluorophores, such as amino acids (e.g. tyrosine, tryptophan and phenylalanine), vitamins, coenzymes and humic compounds. Furthermore, EPS are composed by large amounts of proteins and aromatic organic substances, making fluorescence a powerful technique to monitor their production in MBRs. Thus, the excitation-emission matrices (EEMs) obtained by scanning a range of spectra wavelengths can cover a wide diversity of natural fluorophores, capturing the physiological activity of a biological system as a fingerprint. 2D fluorescence is thus a promising technique for MBR monitoring, able to capture fingerprinting information about the state of the biological system, including EPS. However, it generates a large amount of complex data that requires mathematical analysis to be fully interpreted.
Multivariate statistical modelling is able to correlate large sets of data, integrating different types of monitoring data, for prediction of performance parameters. The present work is focused on the improvement of MBRs monitoring, through the combination of a comprehensive technique, such as the 2D fluorescence spectroscopy, with the appropriated mathematical tools to extract quantitative information from EEMs.
The main objectives of this thesis can then be defined as: i) monitoring the performance of MBRs for domestic wastewater treatment with minimal off-line analytical effort, ii) use of 2D fluorescence spectroscopy to monitor MBRs under a large range of operating conditions and iii) modelling the performance of a MBR operated at pilot scale for domestic wastewater treatment.
1.2. RESEARCH STRATEGY AND THESIS OUTLINE
3 fluorescence spectra. Multivariate statistical tools, based on principal component analysis and projection to latent structures, were selected to model, alone or in combination with a simple mechanistic model, key performance parameters of a MBR for domestic wastewater treatment. The final purpose of this work is the development of an effortless and real-time monitoring technique for biological wastewater treatment systems, such as MBRs. The approach used is supported in the belief that 2D fluorescence spectroscopy can be used as a fingerprinting monitoring technique of a MBR and that multivariate statistical analysis are able to extract the quantitative information enclosed in the fluorescence spectra, improving the overall acceptance of MBRs in the wastewater treatment market.
This Thesis is divided into seven chapters following the work performed during this PhD project. Each chapter includes an introduction with a short review of the specific state of the art related with each chapter subject, describes the materials and methods used in that chapter, and discusses the results and main conclusions obtained. The methodology used in each individual chapter is detailed in the context of the respective subject. The work performed during this PhD has resulted in four scientific articles, presented in Chapters 3, 4, 5 and 6, respectively. The articles related to Chapters 3 and 4 are already published in peer reviewed international journal, and the articles related to Chapters 5 and 6 were recently submitted for publication.
Chapter 1 describes the motivation for this PhD project and defines the work objectives. Additionally, Chapter 2 presents the actual state of the art as a context for the work developed in this thesis.
4
characterisation and to reduce the time frame necessary to obtain monitoring results. This approach alone could not provide robust enough correlations to enable the elimination of parameters for process description. Additionally, it was hypothesised that the information captured by 2D fluorescence spectroscopy could replace some of the analytical and operating parameters, since this technique was able to successfully describe influent and effluent total COD. It was then proposed that a combined modelling of 2D fluorescence data and selected performance/operating parameters should be further explored for efficient MBR monitoring aiming at real-time process control.
In Chapter 4, 2D fluorescence spectroscopy was further investigated in view of the numerous contributions of different compounds in fluorescence spectra. In this chapter it is investigated the occurrence of interference effects (such as quenching and inner filter effects) due to the presence of multiple species in complex biological media, such as natural water matrices, wastewaters and activated sludge. It is shown that the response of fluorescence to a large range of interferences does not represent a problem but a source of information if adequate mathematical tools are used. A statistical multivariate analysis based in a combination of principal component analysis (through the use of PARAFAC function) and PLS modelling is proposed to extract relevant information from 2D fluorescence data. This chapter demonstrates the potential of using 2D fluorescence spectroscopy as a status fingerprint, and how statistical multivariate data analysis can be used to correlate EEMs with selected performance parameters for monitoring of biological systems.
5 This work demonstrates the applicability of 2D fluorescence and statistically-based models to simultaneously monitor multiple key MBR performance parameters with minimal analytical effort.
In Chapter 6, the MBR performance was modelled using a hybrid approach based on the activated sludge model number 3 (ASM3) combined with PLS to predict the residuals of the ASM. The objective of the modelling strategy used in this chapter was to improve the prediction ability of a plain and easy to implement ASM, with minimal additional monitoring effort. Hybrid models were developed to predict three MBR performance parameters: MLSS, COD in the permeate and nitrite and nitrate concentration in the permeate. PLS modelling of ASM residuals was performed using three different input strategies: 1) analytic and operating data; 2) operating data plus 2D fluorescence spectroscopy; 3) all the data. With the first input strategy, PLS modelling was used to investigate what type of information is missing in the ASM modelling. In the second input strategy, the incorporation of updated data from 2D fluorescence spectroscopy aimed the improvement of the ASM prediction at real-time. Finally, the third input strategy incorporated all the collected data in an attempt to find the best prediction possible of the outputs. In this study demonstrates that 2D fluorescence spectroscopy is a comprehensive monitoring tool, able to capture on-line the required information to complement, through hybrid modelling, the mechanistic information described by an ASM.
7
Chapter
2
S
TATE OF THEA
RT2.1. BIOLOGICAL WASTEWATER TREATMENT
Domestic wastewaters are mainly composed by organic compounds that were not completely metabolised in the human body. These compounds, that are rich in nutrients (C, N and P), if discharged in large quantities directly in natural water bodies, are responsible for water pollution and for the well-known phenomena of eutrophication, destroying the natural ecosystems. Additionally, domestic wastewaters are high in pathogenic microorganisms that can contaminate a body of water and spread infectious diseases throughout the population. Therefore, sewage treatment requires reduction of both organic and inorganic nutrients concentrations of the wastewaters and disinfection prior to discharge.
The development of the activated sludge processes for wastewater treatment resulted from the common observation that wastewaters would clarify if left long enough in contact with air. In 1914, Arden and Lockett discovered that the sludge sediment from previous wastewater treatments could be used to supplement fresh untreated wastewater and thus, accelerate the treatment process (Seviour and Nielsen, 2010). The so called activated sludge is composed by a consortium of microorganisms (mainly bacteria and protozoa) that together can degrade and consume the organic and inorganic nutrient present in the domestic wastewaters.
8
suspended solids, safe for discharge into natural water bodies. Following narrower requirements for nitrogen compounds content in treated wastewaters, treatment plants were progressively modified. Indeed, in the last 3 decades, a significant effort has been done to update plants to remove both nitrogen and phosphorus in addition to organic carbon (Seviour and Nielsen, 2010). Biological processes are preferred for their versatility, low cost and environmental sustainability.
2.1.1 Biological removal of nutrients
In the presence of oxygen, the carbon present in the organic matter is consumed by heterotrophic microorganisms, for biomass growth, with the release of carbon dioxide:
C+O2 biomass + CO2
Additionally, ammonia is oxidised by autotrophic microorganisms to nitrite and nitrate in the presence of oxygen, in a process called nitrification:
NH4+ + O2 NO2-
NO2- + O2 NO3-
Conversely, in the absence of oxygen other heterotrophic microorganisms (so called denitrifying bacteria) can reduce the NO3- sequentially to nitrogen gas (N2), which is harmless and disperses into the atmosphere:
NO3- NO2- NO N2O N2
In wastewater treatment plants, excess phosphorus is commonly removed by chemical precipitation or biologically, in a process called enhanced biological phosphorus removal (EBPR), by polyphosphate accumulating organisms.
2.1.2. Conventional activated sludge systems
9 diffusers or mechanical surface agitators to provide mixing and aeration, followed by a clarifier where the mixed liquor is separated into sludge and liquid supernatant, by gravity. The settled sludge is then partially recycled to inoculate the incoming raw wastewater. This process allows heterotrophic microorganisms to be in contact with nutrients in the bulk liquid which, in the presence of oxygen, rapidly oxidise the organic compounds, with release of carbon dioxide. Simultaneously, other important communities of microorganisms present in conventional activated sludge systems are able to oxidise compounds like ammonia to nitrite and nitrate (autotrophic microorganisms).
Biological denitrification is achieved in activated sludge systems with the incorporation of an anoxic zone, either preceding or following the aerobic zone. These processes for nitrogen removal are respectively called pre-denitrification and post-denitrification.
Additionally, despite activated sludge processes being able by themselves to eliminate part of the pathogenic microorganisms, disinfection of wastewater in CAS systems is usually performed after biological treatment by chlorine, ultraviolet light or ozone treatment of the clarified effluent.
2.2. MEMBRANE BIOREACTORS
In some wastewater treatment plants the clarifier used in the conventional systems is replaced by membranes, which are very effective to separate the mixed liquor into solids (sludge) and liquid phase. In these processes, called membrane bioreactors (MBRs), the final effluent has lower suspended solids (and then lower turbidity) than the effluent from clarifiers, and also higher effluent quality, since the membranes enable the retention of pathogens.
10
The high quality of the effluent permeate from a MBR permits the direct application of this technology when advanced treatments are required, such as for bathing water, sensitive discharge bodies or water reuse. Additionally, due to the elimination of settlers and due to the possibility of operation with higher biomass concentration in low operating volumes, MBRs have smaller footprints than CAS, which can be valuable when a compact system is needed, such as in areas with high population density.
Despite its advantages, the application of MBR technology for wastewater treatment is still conditioned by the inevitable membrane fouling, by the operational high costs (mostly associated to the aeration of the membrane) (Judd, 2008) and by the complex control systems required (Lesjean et al., 2011).
2.2.1. Configurations of membrane bioreactors
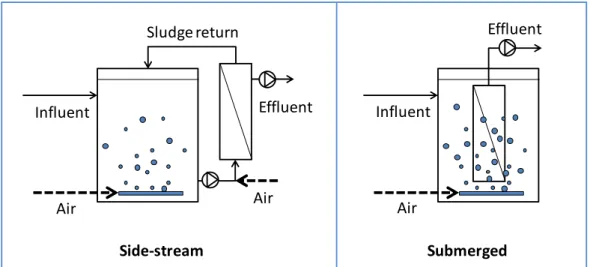
Membrane bioreactors can be generally classified as side-stream or submerged based, according with the membranes placement and operation (Figure 2.1). In side-stream MBRs, membranes are placed externally to the biological reactor and the mixed liquor is pumped into the membrane module. In the membrane module, a permeate stream is generated and the concentrated sludge recycled to the bioreactor. In this configuration, membrane filtration occurs as a typical cross-flow process.
Figure 2.1. Side-stream and submerged MBR configurations.
In submerged MBRs, the membrane module is directly immersed in the mixed liquor, in the aerated bioreactor. This operating strategy was first introduced by Yamamoto et al.
S
Influent
Air
Sludge return
Effluent
Air
Influent
Air
Effluent
11 (1989) with the objective of reducing energy consumption associated with the recirculation pump in the side-stream configuration. The submerged MBR configuration corresponds to a dead-end filtration, with shear stress generated by the air bubble flow.
Besides the membrane module placement, the biological compartment of an MBR, like in CAS systems, can be operated in a wide range of bioreactor configurations to achieve specific nutrient removal (e.g. pre- or post-denitrification).
2.2.2. Filtration process in MBRs
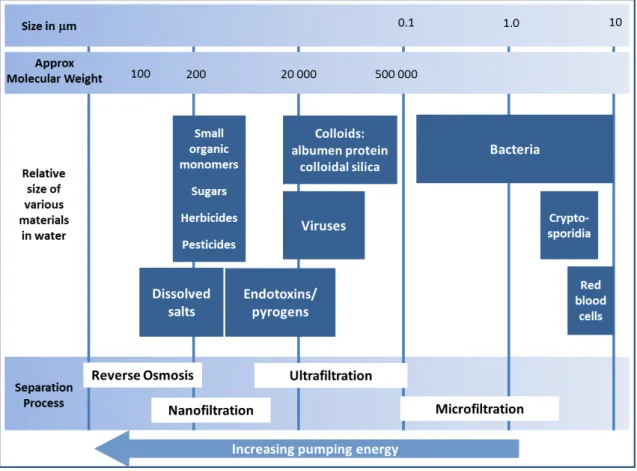
Membrane processes depend on both the driving force applied and the membrane characteristics, such as structure and material (Mulder, 1997). Pressure-driven membrane filtration processes are commonly used in water and wastewater treatment systems, and can be divided in four general types, according to the molecular weight cut-off and transmembrane pressure applied: reverse osmosis, nanofiltration, ultrafiltration and microfiltration (Figure 2.2).
12
In MBRs for wastewater treatment, either tight microfiltration or loose ultrafiltration membranes are typically used. Since the filtration process determines which components of the mixed liquor can be permeated, the effluent quality of an MBR is also dependent on the membrane used. In fact, polysaccharides, proteins and peptides, colloids, bacteria or virus will cross or be retained by the membrane in accordance with their sizes and the membrane properties (Figure 2.2).
Other membrane characteristics essential for the performance of an MBR are the membrane material and the module configuration. Concerning material, membranes applied in MBRs for domestic wastewater treatment are usually polymeric, with a negative surface charge and hydrophilic. Concerning configuration, the filtration module in MBRs is normally composed by either flat-sheet membranes or hollow-fibre membranes. While submerged MBRs hollow-fibre systems are operated with an outside-inside flux direction, in side-stream configurations hollow-fibre membranes can be operated with either an outside-inside or an inside-outside flux direction. However, in the later flux operation mode, the hollow-fibre membranes used have higher internal diameter (also called tubular membranes) (Judd, 2006).
Fouling
Despite the evident advantages of MBRs for wastewater treatment, the main problem associated with their use is membrane fouling. Membrane fouling refers to the progressive deposition and/or adsorption of material on the membrane surface, or within the membrane structure, resulting in a gradual loss of membrane permeability.
Mixed liquors are a complex mixture of variable amounts of particulate, colloidal and dissolved fractions, all of which containing potential foulants. In MBRs, fouling development is mainly due to the adsorption of colloidal material at the membrane surface and deposition of flocs (composed by cells and organic and inorganic compounds). This type of fouling is usually the predominant fouling component in MBRs, though it is easily removed by physical means (Meng et al., 2009).
13 activity (such as polysaccharides and proteins). Despite their diverse origin, these compounds are generally termed extracellular polymeric substances (EPS) and are classified into bound EPS, when they are attached to biomass to form flocs, and soluble EPS (also called soluble microbial products, SMP), when freely suspended.
Additionally, at the surface of membranes there is also the adhesion and growth of microorganisms, forming a biofilm, and the precipitation of some salts. The attached deposit of cells, cell debris and suspended materials, are not truly discernible and all together form a more or less bound fouling layer at the membrane surface. Indeed, all mechanisms of fouling can occur simultaneously forming complex forms of fouling with increase difficulty of cleaning (Poele and van der Graaf, 2005).
According to Meng et al. (2009), membrane fouling can be classified in three types of fouling, based on their persistence to cleaning: removable fouling, irremovable fouling and irreversible fouling. Removable fouling is the fouling easily removed by physical cleaning (e.g. backwash), whereas the elimination of irremovable fouling is only achieved with chemical cleaning. Removable fouling is caused by loosely attached compounds and, in general, corresponds to the cake layer. Irremovable fouling is attributed to pore adsorption and strongly attached foulants. Irreversible fouling is a permanent fouling that cannot be removed by cleaning, and will eventually lead to the need of replacing the membranes.
14
several intermediate compounds and microbial sub-products which can act as fouling agents as well.
Regarding the MBR operating conditions, the imposed permeate flux is probably the most important parameter in fouling control. Thus, membrane bioreactors are usually operated at a low permeate flux (below critical flux) to avoid the deposition of particles on the membrane surface and keep permeability for a long operating time. The concept of critical flux was introduced by Field et al. (1995) and it is defined as the flux where the forces linked to filtration pressure and shearing forces are balanced. In MBR systems, the critical flux value depends on the characteristics of the membrane (e.g. pore diameter and material), characteristics of the mixed liquor, shear forces at the membrane surface and temperature. The application of shear forces at the surface of the membranes is a current operational strategy to hamper fouling formation, either through the use of coarse air bubbles in submerged configurations or through increased crossflow velocity (with or without addition of air) in side-stream configurations (Judd, 2006).
Additionally to the strategies used to prevent fouling, membrane cleaning, either physical or chemical, is an essential step in MBRs operation and membrane maintenance. The physical cleaning strategies predominantly used in MBRs are relaxation and backwash. In relaxation, permeation is interrupted for short periods of time, while continuing to scour the membranes with coarse air bubbles, to allow the detachment of the fouling agents from membranes surface. In backwash, the permeate flux is periodically inverted for few seconds to compel the release of loosely bound compounds from membrane pores. While backwash might be more effective, its application is limited to robust membranes (usually hollow-fibres) (Judd, 2006). These two techniques may be used in combination, and backwash may be enhanced by adding air to the backwash flow, increasing the shear (Judd, 2006). Chemical cleaning is the strongest form of cleaning and it is used when fouling cannot be removed physically. Chemical cleaning is generally carried out with mineral or organic acids, sodium hydroxide or, more usual in MBRs, sodium hypochlorite, and can be performed either
in situ or ex situ (Judd, 2006). However, chemical cleaning has a negative impact on the
15
2.3. MONITORING
2.3.1. Conventional monitoring of wastewater treatment plants
In wastewater treatment systems, monitoring of the biological process and of key effluent parameters is essential to achieve conformity with quality and safety requirements. Usual characterisation of influent wastewater in activated sludge systems includes the assessment of suspended solids, 5-day biochemical oxygen demand (BOD5), total organic carbon (TOC), chemical oxygen demand (COD), nitrogen (as ammonia, total nitrogen, organic nitrogen, nitrate and nitrite), phosphorus (as orthophosphate and total phosphorus), sulphate, alkalinity, greases and coliform
bacteria (as an indicator of pathogenic organisms). BOD5, COD and TOC are used to
assess the global organic content of wastewaters, regardless of their composition.
However, while BOD5 is a standard method used to evaluate the oxygen necessary for
the oxidation of the biodegradable organic compounds (during 5 days), COD assesses all organic compounds able to be oxidised, without distinction on biodegradability. Nevertheless, fractionation of wastewater COD into readily biodegradable, slowly biodegradable or inert is also actually performed through respirometric batch tests for biodegradability assessment (Sperandio and Etienne, 2000). In addition, TOC is an easy and rapid measurement of the organic carbon, but does not give information on their oxidation state. Although these analytic techniques are used in wastewater treatment plants for a better characterisation of organic matter, frequent determinations for monitoring purpose are usually performed only by COD or TOC, which are quicker and easier techniques then BOD5.
Additionally to wastewater characterisation, the following water quality parameters of the effluent are typically monitored: suspended solids, coliform bacteria, nutrients (mainly organic compounds, nitrogen, phosphorus and sulphate), pH, and toxic compounds. However, in the last decades, due to higher environmental requirements and increased knowledge on the chemistry and microbiology of wastewater treatment, additional and more specific monitoring analysis of wastewater treatment systems are being claimed (Metcalf and Eddy, 1991).
2.3.2. Monitoring membrane bioreactors
16
assessment of the biological activity. Moreover, tight monitoring of MBR systems is critical, not only because of the quality of the final treated effluent, but also due to the fouling potential of the complex biological media. Indeed, several techniques are being developed and tested for the evaluation and characterisation of fouling and fouling agents in MBRs.
Total COD measurements of wastewater and permeate are easy to perform but not sufficient to characterise the organic compounds fed to the MBR, that remain in the permeate after treatment, in terms of biodegradability and composition. Additionally, in MBRs, large colloidal organic compounds are retained by the membrane and can either be returned to the bioreactor bulk liquor or deposited on the membrane causing fouling.
Several studies pointed natural organic matter from influent wastewater as a major fouling agent (Jones and O'Melia, 2000; Yuan and Zydney, 1999). Furthermore, the biological performance of an MBR also depends on the characteristics of the influent organic carbon, which includes soluble simple organic molecules with low molecular weight, and colloidal organic compounds present in the soluble COD. A physical-chemical method to distinguish between solutes and colloids in the soluble fraction of COD (usually obtained by filtration) was proposed by Mamais et al. (1993). This method uses zinc sulphate to flocculate colloidal material in a wastewater sample before filtration, and thus obtain a soluble COD without the colloids.
Transmembrane pressure (TMP), defined as the difference of pressure between the feed and the permeate sides of the membrane, and permeate flux are typically monitored on-line at full-scale plant. MBRs for wastewater treatment are usually operated at constant permeate flow (Drews, 2010), and thus, TMP is used as a fouling indicator parameter. However, TMP increase does not distinguish the dominant fouling mechanism or the upcoming of extreme fouling (observed as a TMP jump). Therefore, various methods and techniques to evaluate and monitor fouling with more detail were developed.
17 fouling potential of mixed liquor as reversible or irreversible (Huyskens et al., 2008). Capillary suction time (CST) and sludge volume index (SVI) were also used in the past as sludge characteristics that would be directly linked to its fouling potential, although they have been shown to be poor measures of filterability (Drews, 2010).
Still concerning physical characteristics of fouling, the exact location of fouling formation on the membrane module (knowing exactly which membrane or location of the module affected) and at the membrane level (at the surface or inside the pores) was also previously studied through model-based strategies. These strategies, aiming at the recognition of the underlying mechanism of fouling, included either the estimation of permeate flow distribution in membrane modules (Wicaksana et al., 2009) or the use of filtration models to describe filtration and fouling mechanisms (Drews et al., 2009).
18
Soluble EPS (also referred as SMP) is usually obtained by centrifugation (e.g. Sperandio and Espinosa, 2008) or filtration (e.g. Rosenberger et al., 2006) of the mixed liquor, whereas several methods for the extraction of bound EPS have been applied, without consensus. The most common methods for bound EPS extraction found in literature include the cation exchange resin method (Frolund et al., 1996; Rosenberger et al., 2006) and heating methods (Ng and Ng, 2010; Wang et al., 2009a), however, several other methods have been used, such as formaldehyde and NaOH methods or combinations of them (Liu and Fang, 2002).
Despite the general recognition of EPS as major fouling agents, there is still no consensus about the role played by each of the EPS fractions and by their components (proteins and polysaccharides) on fouling and on factors governing their occurrence (Drews, 2010). However, great variety of samples preparation, analytical methods, system configurations and operating conditions are simultaneously used, which could be partially responsible for the discrepancy in results (Drews, 2010).
In addition, for determination of EPS concentrations (either soluble or bound) some authors measured the organic carbon (e.g. Dong and Jiang, 2009; Lyko et al., 2008) or the COD (e.g. Jiang et al., 2008) of EPS samples, in substitution or in combination with the proteins and polysaccharides assessment. EPS quantification through the measurements of organic carbon and COD do not distinguish the EPS composition, however they were found to be an alternative to more complex and costly measurements of EPS components to characterise sludge (Lyko et al., 2008).
19 In addition, characterisation of membrane organic fouling has also been performed by Fourier transform infrared (FTIR) spectroscopy (e.g. Kimura et al., 2009; Meng et al.,
2007; Wang et al., 2009b) and by 13C-nuclear magnetic resonance (NMR) spectroscopy
(e.g. Kimura et al., 2009; Meng et al., 2011), to identify functional groups of organic molecules generally accepted as fouling agents. Further evaluation of the proteins present in EPS, by their identification, has recently been adapted through gel electrophoresis (Kuhn et al., 2011; Silva et al., 2011).
Microscopic structural properties of membrane fouling have been also assessed using confocal laser scanning microscopy (CLSM) (Bjorkoy and Fiksdal, 2009; Chu and Li, 2005; Meng et al., 2007; Ng and Ng, 2010) and scanning electron microscopy (SEM) (Chu and Li, 2005; Meng et al., 2007). These techniques assessed the presence of bacterial cells attached to membrane and their interaction with biopolymer foulants. In this context, Le-Clech et al (2007) compared environmental scanning electron microscopy (ESEM), confocal laser scanning microscopy and direct observation of fouling. These authors concluded that, despite CLSM ability to differentiate between the different types of foulants, the direct observation of fouling (using a specially designed microscope-based installation (Li et al., 1998) appeared to be the most promising technique for direct and in situ observation of MBR fouling. However, its use is limited
to optically accessible systems such as dilute suspensions or single fibres (Drews, 2010).
In addition to the monitoring techniques targeting specific compounds in the MBR, fingerprinting methods, able to assess the system status, have also been studied for characterisation of such complex biological systems, e.g. Fourier transform near infrared (FT-NIR) (Reed et al., 2011) and 2D fluorescence spectroscopy (Wolf et al., 2007; Wolf et al., 2001). Indeed, spectroscopic methods can be used as fingerprint techniques providing large sets of data (the spectra) from which meaningful information could be extracted (Pons et al., 2004).
Two-dimensional fluorescence spectroscopy
20
possible to assess all compounds by simultaneously scanning a range of excitation and emission wavelengths. Natural fluorophores include proteins, and a large range of other organic compounds, as well as some vitamins, co-factors and NADH. Additionally, fluorescence spectra are sensitive to several other factors, such as the presence of salts, temperature and medium turbidity (Lakowicz, 1983).
Further analysis of the current state of the art on the application of fluorescence spectroscopy to biological systems is explored in Chapter 4, as well as the advantages and disadvantages of the application of 2D fluorescence spectroscopy as a monitoring tool in wastewater treatment systems.
In view of the complexity of MBR systems for wastewater treatment and the wide range of monitoring techniques available, the development of mathematic methods to integrate and correlate different (and disperse) types of information would greatly benefit the comprehension and monitoring of these systems. Therefore, some modelling strategies have been used, such as mechanistic modelling of MBR performance. However, non-mechanistic modelling tools have greater potential to integrate, analyse and correlate different types of information.
2.4. MODELLING MBRS
2.4.1. Activated sludge model
The activated sludge system has been widely studied in the past, resulting in deep understanding of the kinetics of the main heterotrophic and autotrophic biological processes, which set the basis for the development of mechanistic models. These kinetic models have been synthesised in four activated sludge models (ASM) by the International Water Association (IWA) Task Group on Mathematical Modelling for Design and Operation of Biological Wastewater Treatment (Henze et al., 2000).
21 ASM2 was developed later to incorporate phosphorus removal from wastewater, and ASM2d to account for the ability of phosphorus-accumulating organisms to use cell internal substrates for denitrification.
ASM3 does not include phosphorus removal, but it was established to addresses problems found in the first model ASM1, such as the inclusion of internal cell storage compounds in heterotrophs (shifting the focus from hydrolysis to the storage of organic substrates) and the replacement of the death-regeneration concept by the growth-endogenous respiration model.
Due to the similarity between the biological processes occurring in conventional activated sludge systems and in MBRs, ASM can be used for modelling the biological removal of nutrients in a MBR. Nevertheless, some differences between the two systems have to be taken into account when applying an ASM to model the biological performance of an MBR, for instance, the elimination of sludge in the effluent with the replacement of the clarifier by a membrane, and the additional supply of oxygen for aeration of membrane modules.
According with Fenu et al. (2010), the application of the ASMs to the MBR processes can be divided into unmodified and modified ASMs in view of the adaptations made to the ASM to fit an MBR. The expression unmodified or plain encloses ASM applications with modelling objectives similar to those originally stipulated for the CAS systems (process design, effluent characterisation, oxygen demand and sludge production) and without modification of the ASM model structure. However, it includes slight modifications to the biokinetic processes. Modified ASMs extend the original ASM in terms of biokinetic process models, namely the so-called SMP and EPS models. While unmodified ASMs are usually more readily applicable in practice, modified ASMs are developed in academic work to improve process understanding.
22
Rittmann, 2002). Despite the good predictions obtained in these studies, they are complex, involve the calibration of several model parameters and require frequent input data about the feed characteristics.
2.4.2. Statistically-based tools
Principal component analysis
The objective of principal component analysis (PCA) is to substitute the representation of objects in its initial representation into the new Principal Component coordinate space. PCA results in a new co-ordinate system with reduced noise and lower
dimensionality through decomposition of a data matrix, X, into a “structure” part plus a “noise” part.
X=CPT+E
C are the scores matrix, and have as many rows as the original data matrix, PT are the
loadings matrix, and have as many columns as the original data matrix. The scores matrix can be seen as the representation of the initial data in the new and reduced co-ordinate system, composed by the new components (Principal Components, PC), while
the loadings describe the ‘distance’ between the initial co-ordinate system and the PC system. The E matrix contains unexplained data variance, such as co-linearity and noise.
Principal component analysis can be used either as a qualitative data analysis tool, through the analysis of loadings plots, or for compression of the number of parameters needed to describe spectroscopic data. PARAFAC (parallel factor analysis) function can be used as a principal component analysis computational tool, to find the scores matrices for 2D fluorescence spectra, which include the most relevant information from original data, but with reduced dimension (Andersson and Bro, 2000; Bro, 1997).
Projection to latent structures regression
23 factors, termed latent variables. Therefore, PLS regression differs from traditional multivariate regression due to elimination of redundancy in the input and output data. PLS is considered a simple but powerful predictive modelling technique due to its ability to handle co-linearity between variables, data noise and missing data (Wold et al., 2001).
In PLS regression methodology, the input matrix, X, is decomposed as the product of the matrix of scores (T) and the matrix of loadings (PT) that minimises the residuals E.
X = TPT + E
Similarly, the product of T and CT estimates the output Y, where C is the Y-weights matrix and F is the error term.
Y = TCT + F
Therefore, the scores matrix, T, enclosing the new variables obtained from the latent variables, is estimated in a way that is simultaneously able to describe the original X and is a good predictor of Y. The weights matrix W (defined by a linear correlation of T with the original data, T=XW) quantifies the relation between X and Y, therefore, it can be used to identify the important variables to the output. Finally, a multivariate regression model is obtained as follows:
Y = XWCT + F = XB + F
where the regression coefficients are given by:
B = WCT
24
25
Chapter
3
R
EAL-T
IMEM
ONITORING OFM
EMBRANEB
IOREACTORSW
ITH2D
F
LUORESCENCED
ATA ANDS
TATISTICALLY-B
ASEDM
ODELSSUMMARY
The application of membrane bioreactors (MBR) for wastewater treatment is growing worldwide due to their compactness and high effluent quality. However, membrane fouling, mostly associated to biological products, can reduce MBR performance. Therefore, it is important to monitor MBRs as close to real-time as possible to accelerate control actions for maximal biological and membrane performance. 2D fluorescence spectroscopy is a promising on-line tool to simultaneously monitor wastewater treatment efficiency and the formation of potential biological fouling agents. In this study, 2D fluorescence data obtained from the wastewater and the permeate of a MBR was successfully modelled using projection to latent structures (PLS) to monitor variations in the influent and effluent total chemical oxygen demand (COD). Analysis of the results also indicated that humic acids and proteins highly contributed to the measured COD in both streams. Nevertheless, this approach was not valid for other performance parameters of the MBR system (such as influent and effluent ammonia and phosphorus), which is usually characterised through a high number of analytical and operating parameters. Principal component analysis (PCA) was thus used to find possible correlations between these parameters, in an attempt to reduce the analytical effort required for full MBR characterisation and to reduce the time frame necessary to obtain monitoring results. The 3 first principal components, capturing 57% of the variance, indicated and confirmed expected relationships between the assessed parameters. However, this approach alone could not provide robust enough correlations
to enable the elimination of parameters for process description (PCA loadings ≤0.5).
Nevertheless, it is possible that the information captured by 2D fluorescence spectroscopy could replace some of the analytical and operating parameters, since this technique was able to successfully describe influent and effluent total COD. It is thus proposed that combined modelling of 2D fluorescence data and selected performance/operating parameters should be further explored for efficient MBR monitoring aiming at rapid process control.
Published as: Galinha, C.F., Carvalho, G., Portugal, C.A.M., Guglielmi, G., Oliveira, R., Crespo, J.G. and Reis, M.A.M., 2011. Real-time monitoring of membrane bioreactors with 2D-fluorescence data and statistically based models. Water Science and Technology, 63, 1381-1388.1
26
3.1. INTRODUCTION
Membrane bioreactors (MBR) are increasingly applied in wastewater treatment plants, mainly due to their small footprint and high effluent quality. The increasing demand for MBR technology requires the development of adequate monitoring and control techniques, particularly in view of the high operational costs associated to membrane fouling resulting from the adhesion of cells and cell products. Monitoring of MBR performance involves a high number of off-line and time-consuming analytical techniques, regarding the complexity of the media. Therefore, MBR technology would greatly benefit from real-time monitoring techniques that could be used to support immediate control actions.
2D fluorescence spectroscopy is an on-line and non-destructive technique that can quickly provide information about the composition of complex biological media and consequently be used as a real-time monitoring tool. Wastewater media contain high quantities of natural fluorophores, such as aminoacids (e.g. tyrosine, tryptophan and phenylalanine), vitamins, coenzymes and aromatic organic matter in general. Furthermore, extracellular polymeric substances (EPS) containing large amounts of proteins, are the major fouling agent of MBRs. Thus, fluorescence is a good candidate technique for MBR monitoring, able to capture fingerprinting information on the state of the biological media, including EPS.
Fluorescence spectroscopy, using selected excitation/emission wavelengths, was first explored by Li et al. (1991) and Li and Humphrey (1991) for monitoring cell growth and activity in biological reactors. Later, other studies have applied 2D fluorescence spectroscopy to monitor water and wastewater treatment processes (Her et al., 2003; Kimura et al., 2009; Lee et al., 2006; Wang et al., 2009b), and the need to extract deeper, quantitative information from 2D fluorescence spectra obtained from high complex media guided other authors to use multivariate statistical tools (Boehl et al., 2003; Ganzlin et al., 2007; Surribas et al., 2006; Teixeira et al., 2009; Wolf et al., 2001).
27 systems contain highly embedded information. In this study, the information contained in fluorescence spectra was assessed using projection to latent structures (PLS) aiming at establishing correlations with performance parameters of a MBR.
PLS is a linear regression method that maximises the covariance between input data and output performance parameters. PLS models generate a set of latent variables that explain the maximum variance in the output variables, combining in a single step data decomposition and correlation with predicted outputs. PLS were used in this work to predict quality parameters (such as chemical oxygen demand, COD) of wastewater and permeate based only on 2D fluorescence data. Moreover, the importance of specific areas of the fluorescence matrices was investigated for the prediction of each output.
In MBRs for wastewater treatment the relationships between operating and performance parameters are abundant and complex, essentially due to the interdependency between operating parameters, biological performance and membrane performance. This complexity was assessed in this work by principal component analysis (PCA) (Rencher, 2002) of analytical parameters conventionally used to monitor MBRs for wastewater treatment.
28
The aim of this work was the development of a strategy for real-time monitoring of a MBR through the use of an on-line method based on 2D fluorescence spectroscopy data and PLS modelling. Alternatively, this study also evaluated the reduction of the number of MBR monitoring parameters by multivariate data analysis that would enable the elimination of redundant analysis.
3.2. METHODS
3.2.1. Membrane bioreactor
The pilot scale MBR was operated to treat domestic wastewater and monitored with 2D fluorescence spectroscopy. It was located at the wastewater treatment plant of Lavis, Italy and consisted of a biological anoxic/aerobic tank followed by a separate tank with
a submerged hollow fibre system (GE Zenon ZW500d) with 0.04 m membrane pore
size (Figure 3.1). This pilot MBR was monitored with 2D fluorescence for a period of 10 months, when it was operated under controlled permeate flux. During this period, operational changes were programmed and imposed in the permeate flux and solids
retention time. Temperature changed due to seasons’ weather, hydraulic retention time
(HRT) and dissolved oxygen (DO) changed due to other operating and control
experiments.
Figure 3.1. Representation of the pilot MBR located in at the Lavis wastewater treatment plant (Trento, Italy).
3.2.2. 2D fluorescence spectroscopy
Fluorescence EEMs were acquired with a fluorescence spectrophotometer Varian Cary Eclipse coupled to a fluorescence optical fibre bundle probe. Fluorescence spectra were generated in a range of 250 to 700 nm (excitation) and 260 to 710 nm (emission), with
Anoxic Aerobic Pre-treated
wastewater
Permeate Mixed liquor
recirculation
Sampling point
Sampling point
29
an excitation wavelength incrementing step of 10 nm. Fluorescence spectra were
obtained using excitation and emission slits of 10 nm and a scan speed of 3000 nm/min.
3.2.3. Data collection
2D fluorescence spectra were acquired in the wastewater feed, in the bulk activated sludge and in the permeate at the same time that samples were collected for further analysis of wastewater, permeate and mixed liquor (Table 3.1). Also transmembrane pressure (TMP), temperature and dissolved oxygen were measured on-line. All these data collected together with selected operating parameters – permeate flux, hydraulic retention time and sludge retention time – were used in this work to find correlations by multivariate analysis.
3.2.4. Multivariate data analysis