Food Science and Technology
DO:
D https://doi.org/10.1590/1678-457X.21617 OSSN 0101-2061 (Print)
OSSN 1678-457X (Dnline)
1 Introduction
Antioxidants have the ability to suppress, delay, or prevent the degenerative or pathological process of human beings, such as aging, viral infections, coronary heart disease, cancer, allergies, inflammation, and Alzheimer’s disease (Christodouleas et al., 2015; Lin et al., 2008; Ngo et al., 2016), which resulted from the active oxygen free radical-mediated reactions. Antioxidants can also affect and determine the shelf-life, nutritional value, and quality of food products (Christodouleas et al., 2015). Recently, natural antioxidants have become a topic of increasing attention because they can have different uses such as dietary supplements, ingredients in functional foods or replacement of synthetic antioxidants (Arruda et al., 2017). Phenolic compounds from natural sources are an important class of antioxidants. The phenolic compounds have a variety of physiological activity such as antioxidant, antimutagenic, antiallergenic, antiinflammatory, and antimicrobial effects (Martins et al., 2011; Sequeda-Castañeda et al., 2016), and thus are now widely used in the pharmaceutical, nutraceutical and food fields.
On recent years, researchers have focused on finding new effective natural antioxidants, especially from herbal sources. Phyllanthus urinaria belongs to the genus Phyllanthus (Euphorbiaceae) and is widely distributed in Southern America and Asian countries like China and Ondia (Huang et al., 2006; Liu et al., 2015a; Lu et al., 2013). Phyllanthus urinaria has many biological and pharmacological activities including antioxidant, hepatoprotective
antiinflammatory, antiallodynic and antioedematogenic, antiviral, and antibacterial (Liu et al., 2015a) and the phenolic compounds from Phyllanthus urinaria are mainly responsible for these activities.
Extraction is considering the first basic and important stage for separating bioactive compounds from raw materials (Salomon et al., 2014). Ultrasonic-assisted extraction (UAE) is one of the rapid and efficient techniques due to its strong cavitation effect and mechanical function (Liu et al., 2015b; Ma et al., 2016; Rocha et al., 2017). Response surface methodology (RSM) is an effective mathematical and statistical tool (Balyan & Sarkar, 2017; He et al., 2016) for modeling and optimization of the extraction parameters and for investigation of the interaction between the extraction parameters (Balyan & Sarkar, 2017; He et al., 2016). Thus, they are usually combined to extract bioactive substances from various natural materials (Al-Juhaimi et al., 2016; Chemat et al., 2017; Maran et al., 2017; Zhu et al., 2015).
On this work, UAE technique and RSM tool were used to optimize the extraction parameters (ethanol concentration, solid-liquid ratio and ultrasonic time) for the phenolic compounds from Phyllanthus urinaria. On addition, the assays of reducing power, DPPH free radicals, ABTS free radicals, and hydroxyl free radicals were performed for investigating the antioxidant capacity of the phenolic compounds.
Ultrasonic-extraction of phenolic compounds from
Phyllanthus urinaria:
optimization
model and antioxidant activity
Yong LOU1*, Xia-Rong SHE1, Jia-Bin HUANG1, Min-Chun LOU1, Min-Er ZHAN1
Received 03 July, 2017 Accepted 15 Oct., 2017
1 School of Food and Pharmaceutical Engineering, Zhaoqing University, Zhaoqing, Guangdong, P.R. China
*Corresponding author: [email protected]
Abstract
Ultrasonic-assisted extraction technique was used to extract phenolic compounds from Phyllanthus urinaria and response surface methodology was used to optimize the extraction parameters including ultrasonic time (X1), ethanol concentration (X2) and solid-liquid ratio (X3). A mathematical model of the tree parameters for the high extraction yield (Y) was established. Antioxidant activity of the phenolic compounds was investigated by DPPH free radicals, ABTS free radicals, hydroxyl free radicals and reducing power assay with vitamin C as a control. The results showed that the independent variables (X1, X2 and X3) and the interaction terms (X1X3 and X2X3) had a significant effect on the extraction yield. The effect of the variables on the extraction yield was in the order of X3, X1 and X2. The optimal extraction process was X1 of 34 min, X2 of 46.5% and X3 of 1:63 g/mL, and the extraction yield was 9.59%, which was well matched with the predicted value. The antioxidant activity assay indicated that the phenolic compounds from Phyllanthus urinaria have a good antioxidant activity.
Keywords: ultrasonic extraction; response surface methodology; phenolic compounds; antioxidant activity.
2 Materials and methods
2.1 Materials and chemicals
Phyllanthus urinaria was bought from herb stores in Zhaoqing City, China. Folin–Ciocalteu phenol reagent was from Sinopharm Chemical Reagent Co. Ltd. (Shanghai, China), and sodium carbonate, 2,2-diphenyl-1-picrylhydrazyl (DPPH), gallic acid, sodium salicylate, H2D2, trichloroacetic acid, ferric chloride, potassium ferricyanide, potassium persulfate, 2,2’-azino-bis(3-ethylbenzothiazoline-6-sulphonic acid) (ABTS) and vitamin C were from Aladdin Chemical Reagent Co. Ltd. (Shanghai, China).
2.2 Ultrasonic assisted extraction of phenolic compounds
The fresh Phyllanthus urinaria was dried in a vacuum oven (DZF-6020, Yiheng, China) at 80 °C for three days and milled into powders by a pulverizer (XS-10B, Longxin, China), and then passed through an 80-mesh sieve to obtain the plant powders (2.13% moisture). The powders (0.2000g) were placed in a 10-mL sealed glass bottle and mixed with ethanol solution. Then the bottle was placed in an ultrasonic bath (500 W, 53 kHz, SK8200H, Kedao, China) to extract the phenolic compounds for different ultrasonic time (10-50 min) at various ethanol concentrations (30-70%) in different solid-liquid ratios (1:30-1:70 g/mL). The bath was fixed at 500 W and 53 kHz.
2.3 Determination of total phenolic extraction yield
After extraction, the suspension from the extracted bottle was centrifuged by a high-speed centrifuge (H1650-W, Xiangyi, China) at 12000 rpm for 15 min. The phenolic weight in the supernatant was measured by Folin-Ciocalteu method (Sharmila et al., 2016). 2.5 mL of tenfold diluted Folin-Ciocalteu reagent, 2 mL of aqueous sodium carbonate (75 g/L) and 0.5 mL of the diluted supernatant were mixed and reacted in a water bath at 50 °C for 5 min, and then the mixture was cooled to room temperature to determine the absorbance at 760 nm by a UV-vis spectrophotometer (UVmini-1240, Shimadzu, Japan). The phenolic concentration was calculated based on the standard curve of gallic acid standard solutions (0-0.5 mg GAE/L) and the phenolic weight was obtained by multiplying the phenolic concentration by volumetric flask volume (50mL). The phenolic extraction yield is calculated as follows:
( ) henolic compounds weight ( )( )
Extraction yield % = 100
dry plant powders weight
p g
g × (1)
2.4 Optimization design
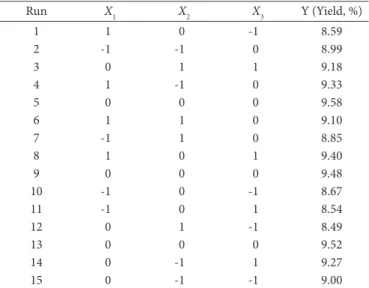
Based on the single-factor-test results and the design principle of Box-Behnken (BBD), the extraction parameters were optimized by response surface methodology with ultrasonic time (X1), ethanol concentration (X2) and solid–liquid ratio (X3) as the independent variables and extraction yield (Y) calculated by Equation 1 as the response. The independent variable levels were given in Table 1 and the design experiment results were provided in Table 2.
2.5 Antioxidant capacity test
DPPH radical scavenging ability
The DPPH radical scavenging activity of the phenolic compounds was measured according to Liu (Liu et al., 2015b). 1 mL of 40 μg/mL DPPH solution was added to 3 mL of sample solution and mixed. The mixture was shaken and left in the dark for 30 minutes at room temperature, and the mixture absorbance was determined at 517 nm. The following equation is used to calculate the DPPH radical scavenging effect:
( ) 0 ( 1 2) 0
Scavenging effect % =A A A 100
A
− −
× (2)
where A0 is the control solution absorbance without sample (deionized water instead of sample), A1 is the mixture solution absorbance with sample, and A2 is the mixture solution absorbance without DPPH (deionized water instead of DPPH).
Hydroxyl radical scavenging ability
The hydroxyl radical scavenging ability of the phenolic compounds was determined according to Liu (Liu et al., 2015b). 1.0 mL of 1.5 mmol/L FeSD4 solution, 0.3 mL of 20 mmol/L sodium salicylate solution, 1.0 mL of sample solution and 0.7 mL of 6 mmol/L H2D2 solution were mixed and reacted for 60 min at 37 °C. Then the mixture absorbance was determined at 520 nm. The following equation is used to calculate the hydroxyl radical scavenging effect:
( ) 0 ( 1 2) 0
Scavenging effect % =A A A 100
A
− − × (3)
Table 2. Box-Behnken design for independent variables and their extraction yield.
Run X1 X2 X3 Y (Yield, %)
1 1 0 -1 8.59
2 -1 -1 0 8.99
3 0 1 1 9.18
4 1 -1 0 9.33
5 0 0 0 9.58
6 1 1 0 9.10
7 -1 1 0 8.85
8 1 0 1 9.40
9 0 0 0 9.48
10 -1 0 -1 8.67
11 -1 0 1 8.54
12 0 1 -1 8.49
13 0 0 0 9.52
14 0 -1 1 9.27
15 0 -1 -1 9.00
Table 1. Ondependent variables and their levels for Box-Behnken design.
Ondependent variables Levels
-1 0 1
Ultrasonic time (X1, min) 20 30 40
where A0 is the control solution absorbance without sample (deionized water instead of sample), A1 is the mixture solution absorbance with sample, and A2 is the mixture solution absorbance without sodium salicylate (deionized water instead of sodium salicylate).
ABTS radical scavenging ability
The ABTS radical scavenging ability of the phenolic compounds was determined according to Ye (Ye et al., 2016). 7.0 mmol/L ABTS solution and 2.45 mmol/L K2S2D8 solution were mixed and reacted in the dark for 12 h at room temperature to prepare ABTS radical solution. The reaction solution was diluted using phosphate buffer solution (pH 7.4, 10 mmol/L) to obtain the absorbance at 734 nm about 0.70 ± 0.02. Then 3.9 mL of the diluted ABTS solution and 0.1 mL of sample solution were mixed and reacted in the dark for 5 min at room temperature to determine the absorbance at 734 nm. The following equation is used to calculate the ABTS radical scavenging effect:
( ) 0 ( 1 2) 0
Scavenging effect % =A A A 100
A
− − ×
(4)
where A0 is the control solution absorbance without sample (deionized water instead of sample), A1 is the mixture solution absorbance with sample, and A2 is the mixture solution absorbance without ABTS (deionized water instead of ABTS).
Reducing power
The reducing power of the phenolic compounds was measured according to Liu (Liu et al., 2015b). 2.5 mL of 0.2 mol/L phosphate buffer solution (pH 6.6), 2.5 mL of 1% potassium ferricyanide solution and 1.0 mL of sample solution was mixed and reacted for 20 min at 50 °C. Then 2.5 mL of 10% trichloro acetic acid was added to the mixture and centrifuged at 3000 rpm for 10 min. 2.5 mL of the supernatant, 0.5 mL of 0.1% ferric chloride solution and 2.5 mL of distilled water was mixed to react for 5 min, and the mixture absorbance was determined at 700 nm. The following equation is used to calculate the reducing power:
1 2
Reducing power =A−A (5)
where A1 is the mixture solution absorbance with sample, and
A2 is the mixture solution absorbance without FeCl3 (deionized water instead of FeCl3).
2.6 Statistical analysis
All the experiment results were averaged by triplicate. Dne-way ANDVA and Duncan’s test were used to determine the significant differences of single-factor levels by SPSS software 20.0. Design Expert software 8.0 was used for the regression analysis and the parameter optimization. Statistical significance was defined at p < 0.05. OC50 was calculated by Drigin 8.0. The multiple regression analysis for the data (Table 2) was performed by Design-Expert software. The model for the extraction yield (Y) was produced by the quadratic polynomial regression equation of ultrasonic time (X1), ethanol concentration (X2) and solid-liquid ratio (X3).
3 Results and discussion
3.1 Single-factor-test analysis
Effect of ultrasonic time
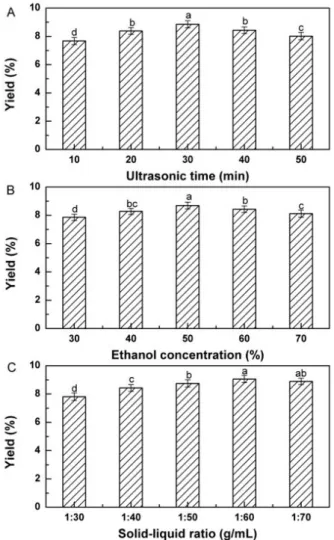
The effect of ultrasonic time (10-50 min) on the extraction yield is given in Figure 1A with solid-liquid ratio and ethanol concentration fixed at 1:40 g/mL and 60%, respectively. As the ultrasonic time increases, the extraction yield increases initially and then decreases when a maximum yield at 30 min is achieved. Ultrasound with mechanical agitation effect, cavitation effect, and thermal effect can improve the mass transport and facilitate the release of compounds from the extracted materials (Carrera et al., 2012; Tomšik et al., 2016). However, the long ultrasonic time can degrade the phenolic compounds, leading to the decrease of the extraction yield (Carrera et al., 2012; Ddabas & Koca, 2016). Therefore, the ultrasonic time of 30 min is sensible.
Effect of ethanol concentration
The effect of ethanol concentration (30-70%) on the extraction yield is shown in Figure 1B, when solid-liquid ratio and ultrasonic time are kept at 1:40 g/mL and 40 min, respectively.
The extraction yield increases as ethanol concentration increases but decreases when it reaches a peak at 50%. This is related to the extraction solution polarity. The different ethanol concentrations make the extraction solutions have different polarities (Spigno & Faveri, 2009). The polarity of 50% ethanol solution may be similar to that of the phenolic compounds of Phyllanthus urinaria, resulting in high extraction yield. When the ethanol concentration exceeds 50%, the extraction solution polarity decreases and other substances compete to be extracted from
Phyllanthus urinaria, which results in a reduction in extraction yield. Thus, the ethanol concentration is around 50%.
Effect of solid-liquid ratio
The effect of solid-liquid ratio (1:30-1:70 g/mL) on the extraction yield is shown in Figure 1C with ethanol concentration at 60% and ultrasonic time at 40 min. The extraction yield increases with the solid-liquid ratio increases until a maximum yield reaches at 1:60 g/mL. The increase of the solid-liquid ratio improves the mass concentration difference between inside and outside the cells, which results in the increase in the mass transport driving force and the internal diffusion rate (Şahin & Şamlı, 2013). The higher solid-liquid ratio means the more phenolic compound release from
Phyllanthus urinaria (Prasad et al., 2012), but simultaneously the more cavitation energy from the extraction system is absorbed, resulting in the lower cavitation energy density per unit volume for extraction (Xu et al., 2016). As a result, the solid-liquid ratio of 1:60 g/mL is suitable.
3.2 Optimization of extraction parameters by response surface methodology
Model fitting
The equation expressed in the form of coded values is as follows:
1 2 3 1 2 1 3
2 2 2
2 3 1 2 3
9.53 0.17 – 0.12 0.20 – 0.022 0.24
0.11 – 0.32 – 0.14 – 0.40
Y X X X X X X X
X X X X X
= + + + +
(6)
where Y is the dependent variable for extraction yield; X1, X2, X3 are the independent variables for ultrasonic time, ethanol concentration and solid-liquid ratio, respectively.
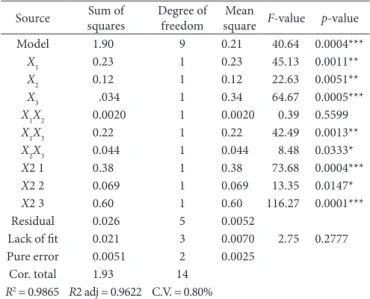
Analysis of variance (ANDVA) is summarized and given in Table 3. As shown in Table 3, the determination coefficient (R2) is 0.9865 which indicates that the model is a reasonable fit for the experimental data (Deng et al., 2016; Han et al., 2016) and the adjusted determination coefficient (R2 adj) is 0.9865 which means the experimental results are highly consistent with the predicted values (Han et al., 2016; Yan et al., 2016). Moreover, the model p-value is 0.0004, which indicates that the regression model is highly significant. The p-value (0.2777) of lack of fit is not significant, which exhibits the fitting model is good for interpreting the data. Simultaneously, the coefficient of variation (C.V. = 0.80%) is relatively low, indicating the better reliability of the experimental values.
Ot can conclude from the p-value presented in Table 3 that the linear coefficients (X1, X2 and X3), the quadratic term
coefficients (X2 1, X2 2 and X2 3), and the interaction term coefficients (X1X3 and X2X3) are significant for the p-value < 0.05. These results illustrate that the effect of the three variables on the extraction yield is significant and the effect is non-linear and that the interactions between X1X3 and X2X3 also have a significant influence on the extraction yield. According to the
p-value, the order of variables influencing the extraction yield is as follows: solid-liquid ratio (X3) > ultrasonic time (X1) > ethanol concentration (X2).
Response surface analysis
3D response surface plots are provided as a graphical interpretation for the relationship between independent and dependent variables (Xie et al., 2015). The 3D response surfaces and 2D contours were plotted in Figure 2. From Figures 2A and 2B, as the ultrasonic time (X1) increases of from 20 to 33.96 min, the extraction yield (Y) increases slowly but decreases gradually after 33.96 min. From Figures 2A and 2C, the extraction yield (Y) increases rapidly as the increasing of ethanol concentration (X2) from 40 to 46.48% and reaches a maximum at 46.48%, and then decreases rapidly. Figures 2B and 2D show that the extraction yield (Y) increases quickly at first and then goes down quickly with increasing of solid-liquid ratio (X3), and a peak at 1:63.23 g/mL is obtained.
Additionally, as shown in Figure 2, all the three response surfaces are convex, indicating the levels of selected parameters are reasonable. By observing the slope variation of the response surfaces and the sparse degree of the contours, the effect significance of the variables on the extraction yield (Y) is in the order of solid-liquid ratio (X3), ultrasonic time (X1) and ethanol concentration (X2). Dbserving the contour plots in Figure 2, it also can conclude that the interactions between ultrasonic time (X1) and solid-liquid ratio (X3), and ethanol concentration (X2) and solid-liquid ratio (X3) is significant.
Table 3. Analysis of variance for fitted quadratic model.
Source squaresSum of Degree of freedom squareMean F-value p-value
Model 1.90 9 0.21 40.64 0.0004***
X1 0.23 1 0.23 45.13 0.0011**
X2 0.12 1 0.12 22.63 0.0051**
X3 .034 1 0.34 64.67 0.0005***
X1X2 0.0020 1 0.0020 0.39 0.5599
X1X3 0.22 1 0.22 42.49 0.0013**
X2X3 0.044 1 0.044 8.48 0.0333*
X2 1 0.38 1 0.38 73.68 0.0004***
X2 2 0.069 1 0.069 13.35 0.0147*
X2 3 0.60 1 0.60 116.27 0.0001***
Residual 0.026 5 0.0052
Lack of fit 0.021 3 0.0070 2.75 0.2777
Pure error 0.0051 2 0.0025
Cor. total 1.93 14
R2 = 0.9865 R2 adj = 0.9622 C.V. = 0.80%
Predictive model verification
The optimum extraction parameters obtained by Design-Expert software are as follows: ultrasonic time (X1) of 33.96 min, ethanol concentration (X2) of 46.48%, and solid-liquid ratio (X3) of 1:63.23 g/mL. Considering the practical operation convenience, the optimum extraction parameters are adjusted as follows: ultrasonic time of (X1) of 34 min, ethanol concentration (X2) of 47%, and solid-liquid ratio (X3) of 1:63 g/mL. Under these conditions, the extraction yield (9.59%) is close to the predicted value (9.62%), which indicates that the model is reliable and effective for extracting the phenolic compounds from Phyllanthus urinaria.
3.3 Antioxidant activity analysis
DPPH radical scavenging ability
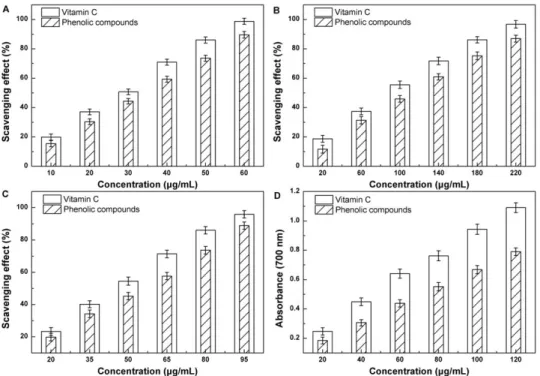
DPPH radicals are widely used to investigate the radical scavenging activity of various samples for the good stability (Gülçin et al., 2004). The DPPH radical scavenging effect of the phenolic compounds and positive control vitamin C calculated by Equation 2 is shown in Figure 3A. The phenolic compounds and vitamin C exhibits a concentration-dependent manner. The half maximal inhibitory concentration (OC50) of the phenolic compounds is 33.60 μg/mL, which is close to the reported results (28.16 μg/mL) by Mediani (Mediani et al., 2015). OC50 of vitamin C is 28.43 μg/mL. These results show the phenolic compounds possess a good capacity to scavenge DPPH radicals.
Hydroxyl radical scavenging ability
Hydroxyl radicals are very active and can severely induce tissue damage or cell death (Ge et al., 2014). Therefore, it is of great importance to scavenge the hydroxyl radicals. The phenolic
compounds and vitamin C display evident scavenging activity (calculated by Equation 3) against hydroxyl radicals in a concentration-dependent manner (Figure 3B). The OC50 of the phenolic compounds and vitamin C is 114.34 μg/mL and 92.06 μg/mL, respectively, which exhibits that the phenolic compounds have a fine capacity to scavenge hydroxyl radicals.
ABTS radical scavenging ability
ABTS assay is a decolorization assay applicable to both lipophilic and hydrophilic antioxidants at different pH levels (Raza et al., 2017). The ABTS radical scavenging effect of the phenolic compounds and vitamin C calculated by Equation 4 is displayed in Figure 3C. The scavenging effect of all the samples increases linearly as the concentration increases. The OC50 of the phenolic compounds and vitamin C is 53.98 μg/mL and 45.42 μg/mL, respectively, which indicates that the phenolic compounds have a significant ability to scavenge ABTS radicals.
Reducing power
The reducing power of a sample can be used as an important index of antioxidant activity (Zheng et al., 2014). The reducing power of the phenolic compounds and vitamin C calculated by Equation 5 is correlated well with the increasing concentration and shows a linear relationship (Figure 3D). On the concentration range of 20-120 μg/mL, the reducing power of the phenolic compounds increases from 0.185 to 0.790, while that of vitamin C is from 0.247 to 1.090. The slope of the phenolic compounds and vitamin C obtained by linear regression is 0.0061 and 0.0084, respectively. These results show the reducing power of the phenolic compounds is equivalent to 76.62% of the reducing power of vitamin C. Therefore, the phenolic compounds have a good reducing power.
Macromolecules, 85, 655-666. PMid:26484601. http://dx.doi. org/10.1016/j.ijbiomac.2015.10.038.
He, B., Zhang, L. L., Yue, X. Y., Liang, J., Jiang, J., Gao, X. L., & Yue, P. X. (2016). Dptimization of ultrasound-assisted extraction of phenolic compounds and anthocyanins from blueberry (Vaccinium ashei) wine pomace. Food Chemistry, 204, 70-76. PMid:26988477. http:// dx.doi.org/10.1016/j.foodchem.2016.02.094.
Huang, S. T., Yang, R. C., Lee, P. N., Yang, S. H., Liao, S. K., Chen, T. Y., & Pang, J. H. S. (2006). Anti-tumor and anti-angiogenic effects of Phyllanthus urinaria in mice bearing Lewis lung carcinoma. International Immunopharmacology, 6(6), 870-879. PMid:16644472. http://dx.doi.org/10.1016/j.intimp.2005.12.010.
Lin, S. Y., Wang, C. C., Lu, Y. L., Wu, W. C., & Hou, W. C. (2008). Antioxidant, semicarbazide-sensitive amine oxidase, and anti-hypertensive activities of geraniin isolated from Phyllanthus urinaria. Food and Chemical Toxicology, 46(7), 2485-2492. PMid:18495318. http://dx.doi.org/10.1016/j.fct.2008.04.007.
Liu, Y., Wei, S., Liao, M., Liu, L., & Huang, Y. (2015a). Self-assembly of glycinin nanoparticles for delivery of phenolic compounds from Phyllanthus urinaria.RSC Advances, 5(8), 5533-5541. http://dx.doi. org/10.1039/C4RA14136A.
Liu, Y., Zhang, H., & Wei, S. (2015b). Ultrasonic-assisted extraction of pigments from Hylocereus undatus flowers: optimization, antioxidant activity, and HPLC analysis. RSC Advances, 5(58), 46598-46607. http://dx.doi.org/10.1039/C5RA04089B.
Lu, K. H., Yang, H. W., Su, C. W., Lue, K. H., Yang, S. F., & Hsieh, Y. S. (2013). Phyllanthus urinaria suppresses human osteosarcoma cell invasion and migration by transcriptionally inhibiting u-PA via ERK and Akt signaling pathways. Food and Chemical Toxicology, 52, 193-199. PMid:23201449. http://dx.doi.org/10.1016/j.fct.2012.11.019. Ma, T., Sun, X., Tian, C., Luo, J., Zheng, C., & Zhan, J. (2016).
Polysaccharide extraction from Sphallerocarpus gracilis roots by response surface methodology. International Journal of Biological Macromolecules, 88, 162-170. PMid:27032488. http://dx.doi. org/10.1016/j.ijbiomac.2016.03.058.
Maran, J. P., Priya, B., Al-Dhabi, N. A., Ponmurugan, K., Moorthy, O. G., & Sivarajasekar, N. (2017). Ultrasound assisted citric acid mediated pectin extraction from industrial waste of Musa balbisiana.Ultrasonics Sonochemistry, 35(Pt A), 204-209. PMid:27707645. http://dx.doi. org/10.1016/j.ultsonch.2016.09.019.
Martins, S., Mussatto, S. O., Martínez-Avila, G., Montañez-Saenz, J., Aguilar, C. N., & Teixeira, J. A. (2011). Bioactive phenolic compounds: production and extraction by solid-state fermentation. A review. Biotechnology Advances, 29(3), 365-373. PMid:21291993. http:// dx.doi.org/10.1016/j.biotechadv.2011.01.008.
Mediani, A., Abas, F., Khatib, A., Tan, C. P., Osmail, O. S., Shaari, K., Osmail, A., & Lajis, N. H. (2015). Phytochemical and biological features of Phyllanthus niruri and Phyllanthus urinaria harvested at different growth stages revealed by 1H NMR-based metabolomics.
Industrial Crops and Products, 77, 602-613. http://dx.doi.org/10.1016/j. indcrop.2015.09.036.
Ngo, T. C., Dao, D. Q., Thong, N. M., & Nam, P. C. (2016). Onsight into the antioxidant properties of nonphenolic terpenoids contained in essential oils extracted from the buds of Cleistocalyx operculatus: a DFT study. RSC Advances, 6(37), 30824-30834. http://dx.doi. org/10.1039/C6RA02683D.
Ddabas, H. O., & Koca, O. (2016). Application of response surface methodology for optimizing the recovery of phenolic compounds from hazelnut skin using different extraction methods. Industrial Crops and Products, 91, 114-124. http://dx.doi.org/10.1016/j. indcrop.2016.05.033.
4 Conclusions
The Box-Behnken design with response surface methodology and ultrasonic technology were performed for extracting the phenolic compounds from P. urinaria. The regression analysis shows that the three variables (ultrasonic time, ethanol concentration and solid-liquid ratio) have a significant effect on the extraction yield, and the fitted model is highl reliability. The optimum extraction parameters are ultrasonic time of 34 min, ethanol concentration of 47%, and solid-liquid ratio of 1:63 g/mL. Under these conditions, the extraction yield is 9.59% (n=3) and is close to the predicted value. The antioxidant activity assay indicates that the phenolic compounds from P. urinaria have significant antioxidant activity and can use as the antioxidant in food and medicine.
References
Al-Juhaimi, F., Adiamo, D. Q., Ghafoor, K., & Babiker, E. E. (2016). Dptimization of ultrasonic-assisted extraction of phenolic compounds from fenugreek (Trigonella foenum-graecum L.) seed. CYTA: Journal of Food, 14, 369-374. http://dx.doi.org/10.1080/19476337.2015.1110202. Arruda, H. S., Pereira, G. A., & Pastore, G. M. (2017). Dptimization of extraction parameters of total phenolics from Annona crassiflora Mart. (Araticum) fruits using response surface methodology. Food Analytical Methods, 10(1), 100-110. http://dx.doi.org/10.1007/ s12161-016-0554-y.
Balyan, U., & Sarkar, B. (2017). Aqueous extraction kinetics of phenolic compounds from jamun (Syzygium cumini L.) seeds. International Journal of Food Properties, 20(2), 372-389. http://dx.doi.org/10.10 80/10942912.2016.1163266.
Carrera, C., Ruiz-Rodríguez, A., Palma, M., & Barroso, C. G. (2012). Ultrasound assisted extraction of phenolic compounds from grapes. Analytica Chimica Acta, 732, 100-104. PMid:22688040. http://dx.doi. org/10.1016/j.aca.2011.11.032.
Chemat, F., Rombaut, N., Sicaire, A. G., Meullemiestre, A., Fabiano-Tixier, A. S., & Abert-Vian, M. (2017). Ultrasound assisted extraction of food and natural products. mechanisms, techniques, combinations, protocols and applications. a review. Ultrasonics Sonochemistry, 34, 540-560. PMid:27773280. http://dx.doi.org/10.1016/j.ultsonch.2016.06.035. Christodouleas, D. C., Fotakis, C., Nikokavoura, A., Papadopoulos, K., & Calokerinos, A. C. (2015). Modified DPPH and ABTS assays to assess the antioxidant profile of untreated oils. Food Analytical Methods, 5(5), 1294-1302. http://dx.doi.org/10.1007/s12161-014-0005-6. Deng, J., Liu, Q., Zhang, C., Cao, W., Fan, D., & Yang, H. (2016).
Extraction optimization of polyphenols from waste kiwi fruit seeds (Actinidia chinensis Planch.) and evaluation of its antioxidant and anti-inflammatory properties. Molecules (Basel, Switzerland), 21(7), 1-13. PMid:27347920. http://dx.doi.org/10.3390/molecules21070832. Ge, Q., Huang, J., Mao, J. W., Gong, J. Y., Zhou, Y. F., & Huang, J. X. (2014). Dptimization of total polysaccharide extraction from Herba Lophatheri using RSM and antioxidant activities. International Journal of Biological Macromolecules, 67, 37-42. PMid:24608027. http://dx.doi.org/10.1016/j.ijbiomac.2014.02.055.
and evaluation of its antioxidant activities. Industrial Crops and Products, 84, 13-21. http://dx.doi.org/10.1016/j.indcrop.2016.01.010. Spigno, G., & Faveri, D. M. D. (2009). Microwave-assisted extraction of tea phenols: A phenomenological study. Journal of Food Engineering, 93(2), 210-217. http://dx.doi.org/10.1016/j.jfoodeng.2009.01.006. Tomšik, A., Pavlić, B., Vladić, J., Ramić, M., Brindza, J., & Vidović, S.
(2016). Dptimization of ultrasound-assisted extraction of bioactive compounds from wild garlic (Allium ursinum L.). Ultrasonics Sonochemistry, 29, 502-511. PMid:26563916. http://dx.doi. org/10.1016/j.ultsonch.2015.11.005.
Xie, J. H., Dong, C. J., Nie, S. P., Li, F., Wang, Z. J., Shen, M. Y., & Xie, M. Y. (2015). Extraction, chemical composition and antioxidant activity of flavonoids from Cyclocarya paliurus (Batal.) Oljinskaja leaves. Food Chemistry, 186, 97-105. PMid:25976797. http://dx.doi. org/10.1016/j.foodchem.2014.06.106.
Xu, Y., Cai, F., Yu, Z., Zhang, L., Li, X., Yang, Y., & Liu, G. (2016). Dptimisation of pressurised water extraction of polysaccharides from blackcurrant and its antioxidant activity. Food Chemistry, 194, 650-658. PMid:26471604. http://dx.doi.org/10.1016/j.foodchem.2015.08.061. Yan, F., Fan, K., He, J., & Gao, M. (2016). Ultrasonic-assisted solvent extraction of carotenoids from rapeseed meal: optimization using response surface methodology. Journal of Food Quality, 38(6), 377-386. http://dx.doi.org/10.1111/jfq.12154.
Ye, Z., Wang, W., Yuan, Q., Ye, H., Sun, Y., Zhang, H., & Zeng, X. (2016). Box-Behnken design for Box–Behnken design for extraction optimization, characterization and in vitro antioxidant activity of Cicer arietinum L. hull polysaccharides. Carbohydrate Polymers, 147, 354-364. PMid:27178941. http://dx.doi.org/10.1016/j.carbpol.2016.03.092. Zheng, Y., Li, Y., & Wang, W. D. (2014). Dptimization of
ultrasonic-assisted extraction and in vitro antioxidant activities of polysaccharides from Trametes orientalis.Carbohydrate Polymers, 111, 315-323. PMid:25037357. http://dx.doi.org/10.1016/j.carbpol.2014.04.034. Zhu, C. P., Zhai, X. C., Li, L. Q., Wu, X. X., & Li, B. (2015). Response
surface optimization of ultrasound-assisted polysaccharides extraction from pomegranate peel. Food Chemistry, 177, 139-146. PMid:25660869. http://dx.doi.org/10.1016/j.foodchem.2015.01.022. Prasad, K. N., Kong, K. W., Ramanan, R. N., Azlan, A., & Osmail, A.
(2012). Selection of experimental domain using two-level factorial design to determine extract yield, antioxidant capacity, phenolics, and flavonoids from Mangifera pajang Kosterm. Separation Science and Technology, 47, 2417-2423. http://dx.doi.org/10.1080/014963 95.2012.672511.
Raza, A., Li, F., Xu, X., & Tang, J. (2017). Dptimization of ultrasonic-assisted extraction of antioxidant polysaccharides from the stem of Trapa quadrispinosa using response surface methodology. International Journal of Biological Macromolecules, 94(Pt A), 335-344. PMid:27751809. http://dx.doi.org/10.1016/j.ijbiomac.2016.10.033. Rocha, J. D. C. G., Mendonça, F. R. P. A. C., Vieira, L. M., Perrone, Í. T., Barros, F. A. R. D., & Stringheta, P. C. (2017). Dptimization of ultrasound-assisted extraction of phenolic compounds from jussara (Euterpe edulis M.) and blueberry (Vaccinium myrtillus) fruits. Food Science and Technology (Campinas). http://dx.doi.org/10.1590/1678-457X.36316.
Şahin, S., & Şamlı, R. (2013). Dptimization of olive leaf extract obtained by ultrasound-assisted extraction with response surface methodology. Ultrasonics Sonochemistry, 20(1), 595-602. PMid:22964032. http:// dx.doi.org/10.1016/j.ultsonch.2012.07.029.
Salomon, S., Sevilla, O., Betancourt, R., Romero, A., Nuevas-Paz, L., & Acosta-Esquijarosa, J. (2014). Extraction of mangiferin from Mangifera indica L. leaves using microwaveassisted technique. Emirates Journal of Food & Agriculture, 26(7), 616-622. http://dx.doi. org/10.9755/ejfa.v26i7.18188.
Sequeda-Castañeda, L. G., Barrera-Bugallo, A. R., Celis, C., Oglesias, J., & Morales, L. (2016). Evaluation of antioxidant and cytotoxic activity of extracts from fruits in fibroblastoma HT1080 cell lines: four fruits with commercial potential in Colombia. Emirates Journal of Food & Agriculture, 28(2), 143-151. http://dx.doi.org/10.9755/ ejfa.2015-11-1007.