Original Article
Ultrasonic-assisted extraction of phenolic and antioxidative compounds from
lizard tail (
Houttuynia cordata
Thunb.)
Trakul Prommajak
1*, Suthat Surawang
2, and Nithiya Rattanapanone
11 Division of Food Science and Technology,
2 Division of Product Development Technology,
Faculty of Agro-Industry, Chiang Mai University, Mueang, Chiang Mai, 50100 Thailand.
Received 2 August 2013; Accepted 21 October 2013
Abstract
Lizard tail (Houttuynia cordata Thunb.) is an Asian herb which has many biological activities, including antioxidative property from polyphenolic compounds. Response surface methodology and Box-Behnken design were employed to study the effect of extraction temperature (30 to 70°C), extraction time (10 to 30 min), ethanol concentration (30 to 70%), and solvent to sample ratio (2 to 6 ml/g) on ultrasonic-assisted extraction of phenolic compounds from lizard tail and antioxidant capacity of the herb extract. Extraction temperature was the most relevant factor on the responses. Optimal condition was the extrac-tion temperature of 70°C for 30 min, using 60% ethanol concentraextrac-tion at the solvent to sample ratio of 5 ml/g. Model adequacies were confirmed by extraction at the optimal condition and normality of standardized residuals.
Keywords: ultrasonic-assisted extraction, Houttuynia cordata Thunb., phenolic compounds, antioxidant capacity
1. Introduction
Lizard tail(Houttuynia cordata Thunb.) is an indi-genous herb in East and Southeast Asia (Pawinwongchai and Chanprasert, 2011; Xu et al., 2005). In traditional medicine, it has been used for treatment of fever, chills, headaches, muscular pain, malaise, diarrhea, dry cough, phlegm, lung abscess, dyspnea leucorrhea and ureteritis (Lau et al., 2008; Lu et al., 2006). Scientifically, it was proved to possess anti-bacterial (Kim et al., 2008), antiviral (Chiang et al., 2003), anti-inflammatory (Lu et al., 2006), antileukemic (Pawinwong-chai and Chanprasert, 2011), anticancer (Kim et al., 2001), immunomodulatory and anti-severe acute respiratory syndrome (SARS) (Lau et al., 2008) activities. Bioactive phenolic compounds found in lizard tail include procyanidin B, catechin, chlorogenic acid, neo-chlorogenic acid,
crypto-chlorogenic acid, quercetin hexoside, rutin, hyperin, quercitrin, piperolactam A, aristolactam B, and cepharadione B (Meng
et al., 2009; Nuengchamnong et al., 2009). Health benefits of neochlorogenic acid were anticarcinogenicity and anti-genotoxicity. Catechin had antiproliferative, hypolipidemic and immunomodulatory activities (Crespo et al., 2006). The flavonoids quercetin, quercitrin and hyperin had biological activities including inactivation of carcinogen, antiprolifera-tion, cell cycle arrest and induction of apoptosis in human cancer cells (Pawinwongchai and Chanprasert, 2011).
Conventional methods for the extraction of bioactive compounds from plants are Soxhlet, hydrodistillation and maceration. Among these methods, Soxhlet is a standard extraction method that has been used for a long time (Wang and Weller, 2006). However, the main disadvantages of Soxhlet extraction are (1) decomposition of thermolabile compounds caused by high operating temperature, (2) the extraction process cannot be accelerated by agitation which results in long extraction time, (3) and a large amount of solvent is required for extraction, which requires a large * Corresponding author.
Email address: [email protected]
amount of energy for the evaporation/concentration step (Luque de Castro and Garcýa-Ayuso, 1998). Therefore, an alternative extraction method is required to overcome these problems.
Ultrasonic-assisted extraction (UAE) is an alternative extraction process that can decrease extraction time and increase extraction yield in many plants (Ma et al., 2008a). Ultrasound energy is a mechanical energy with a frequency higher than 18 kHz which is the upper limit that human typi-cally hear. Ultrasound with frequency more than 1 MHz and power less than 1 W/cm2 is used for food and medical
diagnosis, while ultrasound with frequency between 20 to 100 kHz with power more than 5 W/cm2 is used for food
processing (Mason et al., 2005). Ultrasound wave creates cavitation bubbles in the solvent which cause microjet impacts and shockwave-induced damage to plant cell wall and release cell content into the solvent (Esclapez et al., 2011). The main advantages of UAE are its effectiveness, simplicity and low cost (both instrument and operation cost) (Ghafoor et al., 2009). UAE could also be operated at moderate temperature which is suitable for heat-sensitive compounds (Kimbaris et al., 2006).
This study aimed to optimize the UAE of phenolic compounds with antioxidative property from lizard tail using response surface methodology. Extraction temperature, extraction time, ethanol concentration, and solvent to sample ratio were factors to be examined.
2. Materials and Methods
2.1 Materials
Lizard tail (Houttuynia cordata Thunb.) was purchased from local market in Chiang Mai province of Thai-land. Lizard tail leaves without bruise was selected and homogenized with a blender (Moulinex, France).
Ethanol (J.T. Baker, Netherlands), Folin-Ciocalteu phenol reagent (Merck, Germany), gallic acid, 2,2-diphenyl-1-picryl,hydrazyl (DPPH) (Sigma-Aldrich, USA), ascorbic acid and sodium carbonate (Fisher, USA) were analytical grade.
2.2 Experimental design
Box-Behnken design was used to study the effects of ethanol concentration, solvent ratio, extraction time and
temperature on total phenolic content and antioxidant capacity of lizard tail extracts. The design contained 29 experimental run which had 5 replicates at the center point, as shown in Table 1.
2.3 Extraction of antioxidant phenolic compounds
The sample (5 g) was placed into glass bottle with the solvent (30 to 70% ethanol, 2 to 6 solvent to sample ratio) and extracted in an ultrasonic bath (Tru-Sweep 1875DAE, 45 kHz, Crest Ultrasonics, Malaysia). Extraction temperature and time were used according to the experimental design (Table 2). After extraction, the sample was filtered through muslin cloth and centrifuged at 4,500 rpm for 10 min (Hermle Z200A, Hermle, Germany). The supernatant was subjected to total phenolics and antioxidant assays.
2.4 Determination of total phenolic content
Total phenolic content was analysed by Folin-Ciocalteu assay (Dudonné et al., 2009). In brief, 30 l of appropriate dilution (5x) of the aliquot was mixed with 150 l of 10% Folin-Ciocalteu reagent in microtiter plate. Then, 120 l of 7.5% (w/v) sodium carbonate solution was added. After 60 min, absorbance at 755 nm was recorded by Anthos Zenyth 200RT microplate reader (Biochrom, England). Total phenolic content was calculated from calibration curve and expressed as gallic acid equivalent (GAE).
Total phenolic content (mg GAE/g db)
=
(100
) 10
P V D
W
M
where
P = Total phenolic content calculated from calibra-tion curve (mg GAE/l)
V = volume of extraction solvent (ml) D = dilution factor
W = fresh weight of sample (g) M = moisture content of sample (%)
2.5 Determination of DPPH radical scavenging capacity
An aliquot (30 l) was mixed with 270 l of DPPH solution (prepared by dissolving DPPH in 80% v/v ethanol to obtain OD515 = 0.7) in 96-wells microtiter plate. After
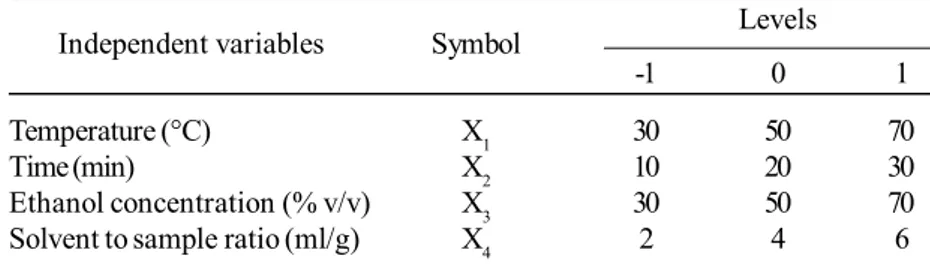
incuba-Table 1. Variables and factor levels for optimization of lizard tail extraction.
Levels Independent variables Symbol
-1 0 1
Temperature (°C) X1 30 50 70
Time (min) X2 10 20 30
tion for 1 h in dark condition, absorbance at 515 nm was recorded (Surveswaran et al., 2007). DPPH radical scaveng-ing capacity was calculated from a calibration curve and expressed as ascorbic acid equivalent (AAE).
DPPH radical scavenging activity (mg AAE/g db)
=
(100 ) 10 A V D
W M
where
A = DPPH radical scavenging activity calculated from calibration curve (mg AAE/l)
2.6 Statistical analysis
Statistical analysis was performed by R version 2.15.1 with ‘RcmdrPlugin.DoE’ and ‘desirability’ packages. Multiple regression analysis was used to fit the result with polynomial quadratic equation, as shown in the following equation:
4 4 3 4
2 0
1 1 1 1
i i i ii i ii i j i i i j i
Y b b X b X b X X
where Yi were the dependent variables, b0 was a constant, bi, bii, bij were the regression coefficients and Xi, Xij were the independent variables (Prommajak and Raviyan, 2010). Some terms were removed from the equations to obtain the highest correlation between actual and predicted values. Optimal condition was calculated for the maximum total phenolic content and DPPH-radical scavenging capacity. Models vali-dation was conducted by Shapiro-Wilk normality test of standardized residuals and extraction at the optimal condi-tions.
3. Results and Discussion
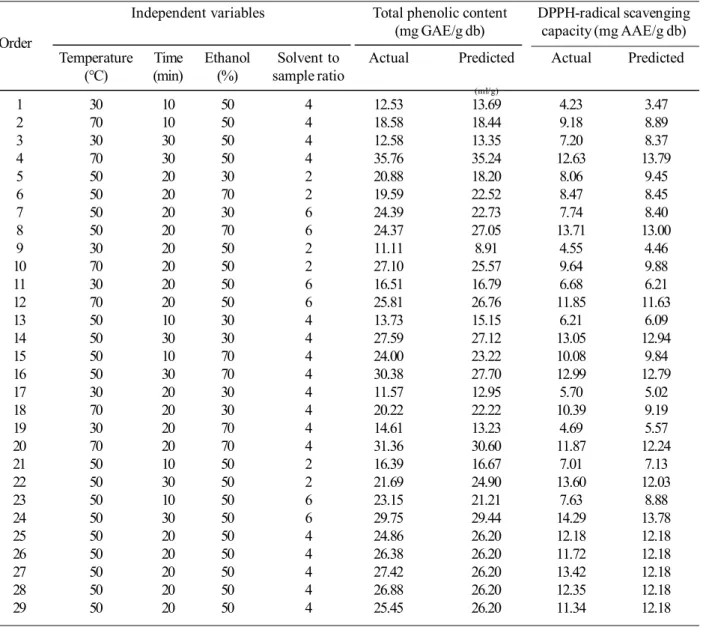
Experimental and predicted response values are shown in Table 2. Mathematical models for both total
Table 2. Experimental design and response values
Independent variables Total phenolic content DPPH-radical scavenging (mg GAE/g db) capacity (mg AAE/g db) Order
Temperature Time Ethanol Solvent to Actual Predicted Actual Predicted (°C) (min) (%) sample ratio
(ml/g)
1 30 10 50 4 12.53 13.69 4.23 3.47
2 70 10 50 4 18.58 18.44 9.18 8.89
3 30 30 50 4 12.58 13.35 7.20 8.37
4 70 30 50 4 35.76 35.24 12.63 13.79
5 50 20 30 2 20.88 18.20 8.06 9.45
6 50 20 70 2 19.59 22.52 8.47 8.45
7 50 20 30 6 24.39 22.73 7.74 8.40
8 50 20 70 6 24.37 27.05 13.71 13.00
9 30 20 50 2 11.11 8.91 4.55 4.46
10 70 20 50 2 27.10 25.57 9.64 9.88
11 30 20 50 6 16.51 16.79 6.68 6.21
12 70 20 50 6 25.81 26.76 11.85 11.63
13 50 10 30 4 13.73 15.15 6.21 6.09
14 50 30 30 4 27.59 27.12 13.05 12.94
15 50 10 70 4 24.00 23.22 10.08 9.84
16 50 30 70 4 30.38 27.70 12.99 12.79
17 30 20 30 4 11.57 12.95 5.70 5.02
18 70 20 30 4 20.22 22.22 10.39 9.19
19 30 20 70 4 14.61 13.23 4.69 5.57
20 70 20 70 4 31.36 30.60 11.87 12.24
21 50 10 50 2 16.39 16.67 7.01 7.13
22 50 30 50 2 21.69 24.90 13.60 12.03
23 50 10 50 6 23.15 21.21 7.63 8.88
24 50 30 50 6 29.75 29.44 14.29 13.78
25 50 20 50 4 24.86 26.20 12.18 12.18
26 50 20 50 4 26.38 26.20 11.72 12.18
27 50 20 50 4 27.42 26.20 13.42 12.18
28 50 20 50 4 26.88 26.20 12.35 12.18
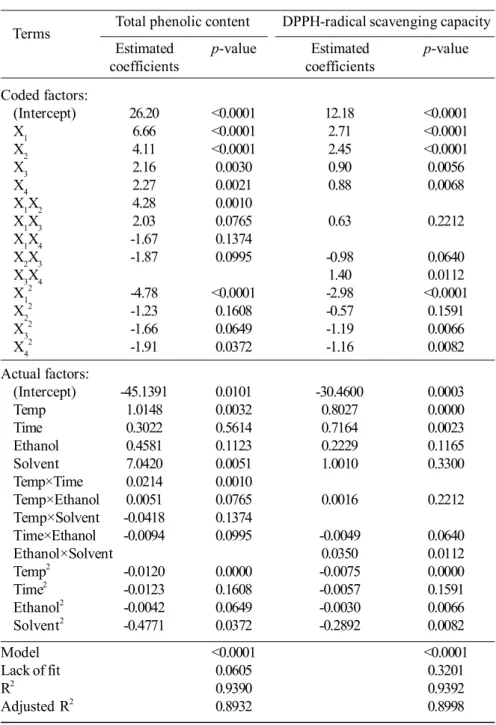
phenolic contents and DPPH-radical scavenging capacity were significant (p<0.0001). The lack-of-fit for both models was insignificant. These results indicate adequacy of the models. Coefficient of determination (R2) is used to determine
the variance of the response as influenced by the factor vari-ables. In this study, 93.90% of the variance of total phenolic content and 93.92% of the variance of DPPH-radical scaveng-ing capacity of lizard tail extract can be explained by extraction temperature, extraction time, ethanol concentration and solvent to sample ratio (Table 3).
3.1 Total phenolic contents
Effects of independent variables in total phenolic content were shown in Figure 1. Coefficients for the coded factors showed the effects of independent variables (Table 3). Extraction temperature (range from 30 to 70°C) had the most influences on total phenolic content, followed by extraction time (10 to 30 min). Concentration of extracted phenolic compounds increased with the elevated temperature due to higher solubility of phenolic compounds and lower viscosity
Table 3. Coefficients estimated and p-value of regression models.
Total phenolic content DPPH-radical scavenging capacity Terms
Estimated p-value Estimated p-value coefficients coefficients
Coded factors:
(Intercept) 26.20 <0.0001 12.18 <0.0001 X1 6.66 <0.0001 2.71 <0.0001 X2 4.11 <0.0001 2.45 <0.0001
X3 2.16 0.0030 0.90 0.0056
X4 2.27 0.0021 0.88 0.0068
X1X2 4.28 0.0010
X1X3 2.03 0.0765 0.63 0.2212 X1X4 -1.67 0.1374
X2X3 -1.87 0.0995 -0.98 0.0640
X3X4 1.40 0.0112
X12 -4.78 <0.0001 -2.98 <0.0001
X22 -1.23 0.1608 -0.57 0.1591
X32 -1.66 0.0649 -1.19 0.0066
X42 -1.91 0.0372 -1.16 0.0082
Actual factors:
(Intercept) -45.1391 0.0101 -30.4600 0.0003 Temp 1.0148 0.0032 0.8027 0.0000 Time 0.3022 0.5614 0.7164 0.0023 Ethanol 0.4581 0.1123 0.2229 0.1165 Solvent 7.0420 0.0051 1.0010 0.3300 Temp×Time 0.0214 0.0010
Temp×Ethanol 0.0051 0.0765 0.0016 0.2212 Temp×Solvent -0.0418 0.1374
Time×Ethanol -0.0094 0.0995 -0.0049 0.0640
Ethanol×Solvent 0.0350 0.0112
Temp2 -0.0120 0.0000 -0.0075 0.0000
Time2 -0.0123 0.1608 -0.0057 0.1591
Ethanol2 -0.0042 0.0649 -0.0030 0.0066
Solvent2 -0.4771 0.0372 -0.2892 0.0082
Model <0.0001 <0.0001
Lack of fit 0.0605 0.3201
R2 0.9390 0.9392
ratio had no interaction effect, as described by the absence of ethanol×solvent (X3X4) term in the model. A similar result
was found in the ultrasonic-assisted extraction of flavonoid from Folium eucommiae which showed insignificant inter-action between ethanol concentration and solid-to-liquid ratio (Huang et al., 2009).
Although some terms, including X1X3, X1X4, X2X3,
X22 and X32 were insignificant, but removing each of these
terms from the model caused a decline of coefficient of deter-mination.
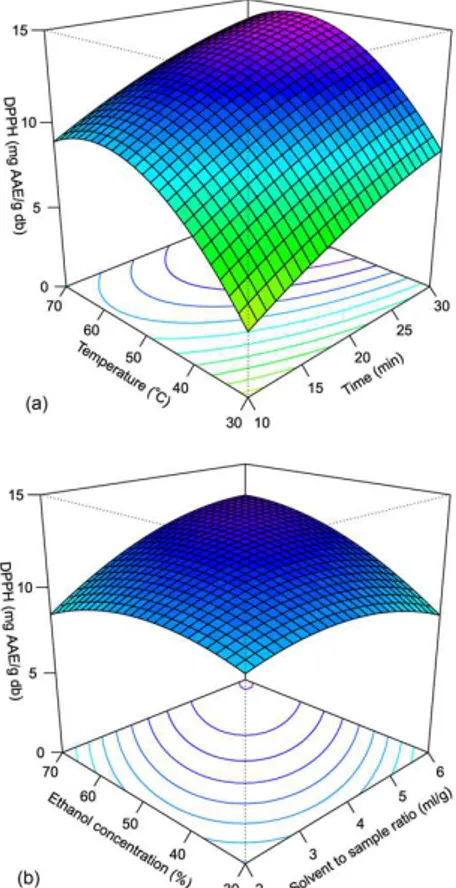
3.2 DPPH-radical scavenging capacity
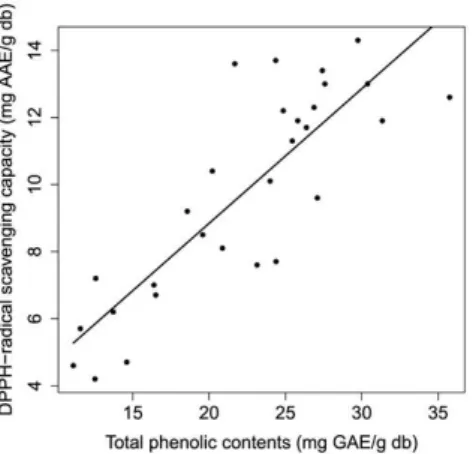
Figure 2 shows the effect of independent variables on DPPH-radical scavenging capacity of herbal extract. The antioxidant capacity increased with an increasing extraction temperature until about 60°C, and thereafter decreased due to degradation of antioxidative compounds (Ma et al., 2008b). A correlation (R=0.8449, p<0.001) was found between total phenolic content and DPPH-radical scavenging capacity, as illustrated in Figure 3. The correlation between total phenolic content and antioxidant activity was also found in the extracts of citrus peel (R=0.775), basil (R2=0.71), Asian
of the mixture (Ghafoor and Choi, 2009). Increasing of contact time between sample and solvent improve the diffusion of the compound. Similar result was also found in UAE of citrus peel (Ma et al., 2008b). In case of grape seeds, although study parameters (40 kHz ultrasound frequency, temperature of 33 to 67°C, 16 to 34 min, 33 to 67% ethanol) were similar to those used in this study (45 kHz ultrasound frequency, temperature of 30 to 70°C, 10 to 30 min, 30 to 70% ethanol), the total phenolic content of the extract was more influenced by the extraction time than the temperature (Ghafoor et al., 2009). Extraction time and temperature had the highest inter-active and synergistic effect on extraction of phenolic compounds, as shown by coefficient of X1X2 term. Extraction time had a small effect at low extraction temperature, but at high temperature, its effect was highly increased (Figure 1a). Ethanol concentration (30 to 70%) and solvent per sample ratio (2 to 6 ml/g) had minor, but significant effects on total phenolic content. Ethanol is a suitable solvent for food industry. The presence of water in the solvent caused swell-ing of plant sample and enhanced the extraction. The appro-priate ethanol concentration offered a suitable polarity for the target compounds. Increasing the solvent to sample ratio accelerate mass transfer between solvent and sample (Huang
et al., 2009). Ethanol concentration and solvent to sample Figure 1. Surface plot of total phenolic content as a function of (a) extraction temperature and extraction time, and (b) etha-nol concentration and solvent to sample ratio. The other 2 factors in each graphs were fixed at the mid level.
vegetables (R2=0.6578) and Chinese medicinal plants (R2=
0.9580) (Cai et al., 2004; Javanmardi et al., 2003; Kaur and Kapoor, 2002; Ma et al., 2008b). Antioxidant c apacity
increased with prolonged extraction time. Similarly, ethanol concentration and solvent per sample ratio also had small effects as same as the total phenolic content model.
3.3 Optimal conditions and model validation
The optimal condition for the extraction of antioxidant compounds from lizard tail extract was found to be at 70°C for 30 min using 5 ml 60% ethanol per g of sample. At this optimal condition, the predicted response values were 35.80 mg GAE/g db for total phenolic content and 14.26 mg AAE/g db for DPPH-radical scavenging capacity. External validation can be conducted by extraction at this optimal condition. It was found that the actual response values were within 95% confidence interval of predicted values (Table 4).
This optimal condition was both similar and different from other studies on optimization of ultrasonic-assisted extraction of phenolic compounds from plant materials, as shown in Table 5. Optimal extraction temperature varied from 55°C (Folium eucommiae) to 79°C (Prunella vulgaris L.), indicating that each plant contains different types of phenolic Figure 3. Correlation plot between total phenolic content and
DPPH-radical scavenging capacity (R=0.8449, p<0.001).
Table 4. Predicted and actual response value at optimal conditions
95% confidence interval
Response variables Predicted value Actual value1
Lower Upper
Total phenolic content 35.80 31.76 39.84 36.40±0.48 DPPH 14.26 12.80 15.73 14.89±0.14
1means ± standard deviation (n=3)
Table 5. Optimal conditions for ultrasonic-assisted extraction of phenolic compounds from various plant materials.
Sample Temperature Time Ethanol Solvent to References (°C) (min) (%) sample ratio
(ml/g)
Lizard tail 70 30 60 5 This study
(30-70)1 (10-30) (30-70) (2-6)
Grape seed 56 30 53 50 Ghafoor et al. (2009) (33-67) (16-34) (33-67)
Grape peel 53 24 46 50 Ghafoor and Choi (2009) (23-57) (11-29) (33-67)
Red grape jam 50 20 60 50 Morelli and Prado (2012) (33-67) (11-29) (43-77)
Wheat bran 60 25 64 20 Wang et al. (2008) (33-67) (11-29) (43-77)
Prunella vulgaris L.2 79 30.5 41 30 Zhang et al. (2011)
(60-80) (25-35) (30-50) (25-35)
Folium eucommiae2 55 70 40 60 Huang et al. (2009)
(35-85) (23-57) (45-79)
compounds with varying heat sensitivity. Optimal extraction time mostly varied between 20 and 30 min. Ethanol concen-tration varied from 40 to 64%, indicating that different target compounds are contained in different plant materials which require different polarity of extracting solvent. In other studies, solvent to sample ratio ranged from 20 to 60 ml/g for dried sample (Ghafoor and Choi, 2009; Ghafoor et al., 2009; Huang et al., 2009; Morelli and Prado, 2012; Wang et al., 2008; Zhang et al., 2011). However, in the present study, fresh samples (86.20% moisture content) were used and the required amount of solvent was 5 ml/g. If the moisture content is removed, the calculated solvent to sample ratio will be 42 ml/g dried sample which is within the range reported in other studies.
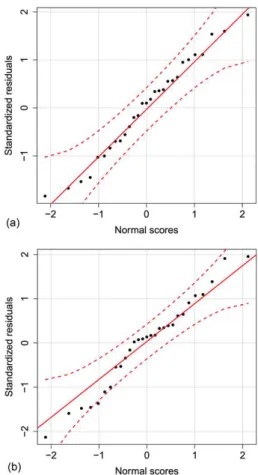
Standardized residual is used for identifying outliers (the value greater than 2.58 or smaller than -2.58) of the observed residual (Vogt and Johnson, 2011). As shown in Figure 4, standardized residuals of both models had no outlier. Internal validation of mathematical models can be evaluated by normality test of standardized residuals. Shapiro-Wilk test showed normality of standardized residuals for both total phenolic content and DPPH models (p-value = 0.7634 and 0.6148, respectively), confirming validity of the models.
4. Conclusions
Regression models for total phenolic content and DPPH-radical scavenging capacity were both significant, while the lack-of-fits were insignificant. Standardized residu-als had normal distribution. Extraction temperature was the most relevant factor among the factors studied. Optimal condition for extracting phenolic compounds from lizard tail was found to be at 70°C for 30 min using 60% ethanol con-centration at the solvent to sample ratio of 5 ml/g. Actual responses at optimal condition was within 95% confidence interval of the predicted values.
Acknowledgement
This work was supported by the Thailand Research Fund through the Royal Golden Jubilee Ph.D. Program (Grant No. PHD/0260/2551).
References
Cai, Y., Luo, Q., Sun, M. and Corke, H. 2004. Antioxidant activity and phenolic compounds of 112 traditional Chinese medicinal plants associated with anticancer. Life Sciences. 74, 2157-2184.
Chiang, L.C., Chang, J.S., Chen, C.C., Ng, L.T. and Lin, C.C. 2003. Anti-herpes simplex virus activity of Bidens pilosa and Houttuynia cordata. The American Journal of Chinese Medicine. 31, 355-362.
Crespo, J.F., James, J.M., Fernandez-Rodriguez, C. and Rodriguez, J. 2006. Food allergy: nuts and tree nuts. British Journal of Nutrition. 96, S95-S102.
Dudonné, S., Vitrac, X., Coutière, P., Woillez, M. and Mérillon, J.M. 2009. Comparative study of antioxidant proper-ties and total phenolic content of 30 plant extracts of industrial interest using DPPH, ABTS, FRAP, SOD, and ORAC assays. Journal of Agricultural and Food Chemistry. 57, 1768-1774.
Esclapez, M., García-Pérez, J., Mulet, A. and Cárcel, J. 2011. Ultrasound-assisted extraction of natural products. Food Engineering Reviews. 3, 108-120.
Ghafoor, K. and Choi, Y. 2009. Optimization of ultrasound assisted extraction of phenolic compounds and anti-oxidants from grape peel through response surface methodology. Journal of the Korean Society for Applied Biological Chemistry. 52, 295-300.
Ghafoor, K., Choi, Y.H., Jeon, J.Y. and Jo, I.H. 2009. Optimiza-tion of ultrasound-assisted extracOptimiza-tion of phenolic compounds, antioxidants, and anthocyanins from grape (Vitis vinifera) seeds. Journal of Agricultural and Food Chemistry. 57, 4988-4994.
Huang, W., Xue, A., Niu, H., Jia, Z. and Wang, J. 2009. Opti-mised ultrasonic-assisted extraction of flavonoids from Folium eucommiae and evaluation of antioxidant activity in multi-test systems in vitro. Food Chemistry. 114, 1147-1154.
Javanmardi, J., Stushnoff, C., Locke, E. and Vivanco, J.M. 2003. Antioxidant activity and total phenolic content of Iranian Ocimum accessions. Food Chemistry. 83, 547-550.
Kaur, C. and Kapoor, H.C. 2002. Anti-oxidant activity and total phenolic content of some Asian vegetables. International Journal of Food Science and Techno-logy. 37, 153-161.
Kim, G.S., Kim, D.H., Lim, J.J., Lee, J.J., Han, D.Y., Lee, W.M., Jung, W.C., Mim, W.G., Won, C.G., Rhee, M.H., Lee, H.J. and Kim, S. 2008. Biological and antibacterial activities of the natural herb Houttuynia cordata
water extract against the intracellular bacterial patho-gen Salmonella within the RAW 264.7 macrophage. Biological and Pharmaceutical Bulletin. 31, 2012-2017. Kim, S.K., Ryu, S., No, J., Choi, S. and Kim, Y. 2001. Cytotoxic
alkaloids from Houttuynia cordate. Archives of Pharmacal Research. 24, 518-521.
Kimbaris, A.C., Siatis, N.G., Daferera, D.J., Tarantilis, P.A., Pappas, C.S. and Polissiou, M.G. 2006. Comparison of distillation and ultrasound-assisted extraction methods for the isolation of sensitive aroma compounds from garlic (Allium sativum). Ultrasonics Sono-chemistry. 13, 54-60.
Lau, K.M., Lee, K.M., Koon, C.M., Cheung, C.S.F., Lau, C.P., Ho, H.M., Lee, M.Y.H., Au, S.W.N., Cheng, C.H.K., Lau, C.B.S., Tsui, S.K.W., Wan, D.C.C., Waye, M.M.Y., Wong, K.B., Wong, C.K., Lam, C.W.K., Leung, P.C. and Fung, K.P. 2008. Immunomodulatory and anti-SARS activities of Houttuynia cordata. Journal of Ethno-pharmacology. 118, 79-85.
Lu, H.M., Liang, Y.Z., Yi, L.Z. and Wu, X.J. 2006. Anti-inflam-matory effect of Houttuynia cordata injection. Journal of Ethnopharmacology. 104, 245-249.
Luque De Castro, M. and Garcýa-Ayuso, L. 1998. Soxhlet extraction of solid materials: an outdated technique with a promising innovative future. Analytica Chimica Acta. 369, 1-10.
Ma, Y., Ye, X., Hao, Y., Xu, G., Xu, G. and Liu, D. 2008a. Ultra-sound-assisted extraction of hesperidin from Penggan (Citrus reticulata) peel. Ultrasonics Sonochemistry. 15, 227-232.
Ma, Y.Q., Chen, J.C., Liu, D.H. and Ye, X.Q. 2008b. Effect of ultrasonic treatment on the total phenolic and anti-oxidant activity of extracts from citrus peel. Journal of Food Science. 73, T115-T120.
Mason, T.J., Riera, E., Vercet, A. and Lopez-Buesa, P. 2005. 13 - Application of Ultrasound. In Emerging Techno-logies for Food Processing, S. Da-Wen, editor. Academic Press, London, U.K.
Meng, J., Leung, K.S.Y., Dong, X.P., Zhou, Y.S., Jiang, Z.H. and Zhao, Z.Z. 2009. Simultaneous quantification of eight bioactive components of Houttuynia cordata
and related Saururaceae medicinal plants by on-line high performance liquid chromatography–diode array detector–electrospray mass spectrometry. Fitoterapia. 80, 468-474.
Morelli, L.L.L. and Prado, M.A. 2012. Extraction optimization for antioxidant phenolic compounds in red grape jam using ultrasound with a response surface methodo-logy. Ultrasonics Sonochemistry. 19, 1144-1149. Nuengchamnong, N., Krittasilp, K. and Ingkaninan, K. 2009.
Rapid screening and identification of antioxidants in aqueous extracts of Houttuynia cordata using LC– ESI–MS coupled with DPPH assay. Food Chemistry. 117, 750-756.
Pawinwongchai, J. and Chanprasert, S. 2011. Antileukemic activity of Houttuynia cordata Thunb. extracts in Jurkat and U937 human leukemic cells. Journal of Chemical and Pharmaceutical Research. 3, 204-212. Prommajak, T. and Raviyan, P. 2010. Optimization of gelatin
extraction from Thai fish panga (Pangasius bocourti
Sauvage) skin. Chiang Mai University Journal of Natural Sciences. 9, 255-272.
Surveswaran, S., Cai, Y.Z., Corke, H. and Sun, M. 2007. Systematic evaluation of natural phenolic antioxidants from 133 Indian medicinal plants. Food Chemistry. 102, 938-953.
Vogt, W.P. and Johnson, R.B. 2011. Dictionary of Statistics & Methodology: A Nontechnical Guide for the Social, SAGE Publications, London, U.K.
Wang, J., Sun, B., Cao, Y., Tian, Y. and Li, X. 2008. Optimisa-tion of ultrasound-assisted extracOptimisa-tion of phenolic compounds from wheat bran. Food Chemistry. 106, 804-810.
Wang, L. and Weller, C.L. 2006. Recent advances in extrac-tion of nutraceuticals from plants. Trends in Food Science and Technology. 17, 300-312.
Xu, C.J., Liang, Y.Z. and Chau, F.T. 2005. Identification of essential components of Houttuynia cordata by gas chromatography/mass spectrometry and the integrated chemometric approach. Talanta. 68, 108-115.