Article
J. Braz. Chem. Soc., Vol. 27, No. 7, 1188-1194, 2016. Printed in Brazil - ©2016 Sociedade Brasileira de Química 0103 - 5053 $6.00+0.00
*e-mail: [email protected]
Optimization of a New Methodology for Determination of Total Phenolic Content in
Rice Employing Fast Blue BB and QUENCHER Procedure
Sylvio V. Palombini, Thiago Claus, Swami A. Maruyama, Fabiana Carbonera, Paula F.
Montanher, Jesuí V. Visentainer, Sandra T. M. Gomesand Makoto Matsushita*
Departamento de Química, Universidade Estadual de Maringá, 87020-900 Maringá-PR, Brazil
Response surface methodology was used to optimize the total phenolic content (TPC) result in white rice, using a new methodology that employed Fast Blue BB (FBBB) reagent, which reacts more specifically with phenolic compounds, along with direct QUENCHER procedure. This is the first time in which such conciliation between FBBB reagent and QUENCHER was done. The obtained model allowed to evaluate how the factors influenced the method linearity (R2), improving the choice of the optimal system condition. Furthermore, the similarity between
experimental results and values generated by the model indicated the method validity within the studied region. Thus, the optimal condition determined in the present work was 30 min reaction time, 0.17 mL FBBB reagent and use of 5% NaOH as the catalyst for the reaction. This optimized condition suggested that the combination of the method, which used FBBB reagent and the direct QUENCHER procedure, was rapid and effective, yielding high TPC values (1488.73 mg of gallic acid equivalent per 100 g).
Keywords: Fast Blue BB, QUENCHER procedure, RSM, rice
Introduction
Nowadays, there is great interest in the study of compounds which show antioxidant capacity1-3 due to the
knowledge of the harmful effects caused by oxidative stress, such as DNA damage, resulting in carcinogenic effects.4
These studies include the determination of the antioxidant capacity of such compounds and also the detection of their total amounts.
Phenolic compounds present in nearly all foods are among compounds that exhibit antioxidant activity. The Folin-Ciocalteu (F-C) method has been used to measure total phenolic content in food.5 The F-C assay is a
colorimetric method based on the electron transfer reactions between the F-C reagent and phenolic compounds. For a long time, many efforts have been made to improve the assay selectivity.6,7 However, this method is not specific
and other compounds present in foods, such as sugars, aromatic amines, organic acids and, in particular, ascorbic acid,8 can cause interference.
Recently, Medina9 proposed a new method that was not
affected by these interfering compounds. This new method uses Fast Blue BB diazonium salt (FBBB) reagent, where
the diazonium group specifically couples with reactive phenolic hydroxyl groups under alkaline conditions to form stable azo complexes,10 providing more reliable results
compared to the F-C assay.
In addition to this new methodology for total phenolic content (TPC) determination, Serpen et al.11 developed a
new direct procedure called QUENCHER. This procedure overcomes problems related to losses inherent to commonly applied processes, which employ solvent extraction and/or hydrolysis, used to analyze the antioxidant capacity of foods. Both processes lead to underestimation of the experimental results, as not all molecules responsible for antioxidant activity (phenolic compounds or not) can be efficiently extracted or hydrolyzed.12 The QUENCHER
procedure avoids these solvent extraction or hydrolysis steps and the reagents act directly on the sample, yielding more accurate results, which take into account the effects that occur between antioxidant compounds in the food matrix, such as synergism. Furthermore, the reagents act on the soluble and insoluble portions of the sample, which is not the case when extraction and/or hydrolysis steps are applied.12
of different factors and their interaction on all response variables. This tool can be used to find a combination of factor levels that produce an optimum response.13 Among
the different types of designs, one of the most employed is the central composite design (CCD). This experimental design allows to evaluate each independent variable in five different levels, including low (−1), intermediate (0), high (+1); and the axial levels (−α and +α), making possible the expansion of the region which will be studied.14
The QUENCHER procedure, as well the assay proposed by Medina9 have been applied to different samples,
including rice (Oryza sativa L.), an important crop in Africa, Latin America and Middle East, and the second largest crop produced worldwide, a staple food in many countries, especially in developing countries.15,16 However,
they have not been combined into a single assay for TPC determination. Therefore, this work aimed to combine the QUENCHER procedure with the new methodology for TPC determination using FBBB reagent and RSM to optimize the TPC analysis in white rice samples.
Experimental
Materials
The white rice samples (Oryza sativa L.) were obtained in the local commerce from the city of Maringá (PR, Brazil). All the samples were milled and passed through a 80 mesh (0.177 mm) sieve, to avoid any influence of different particle sizes in the following experiments. The Fast Blue BB [4-benzoylamino-2,5-dimethoxybenzenediazonium chloride hemi-(zinc chloride)] and gallic acid reagents were obtained from Sigma-Aldrich (St. Louis, MO, USA). The assays were performed employing NaOH and Na2CO3
with analytical degree.
Experimental design
The influence of independent variables in function of TPC results was evaluated through central composite design (CCD, Table 1), applied to RSM. The design used in this
work was composed by five levels and three variables, totalizing 22 experiments, presenting 8 factorial points, 8 axial points and 6 central points. The selected variables and intervals were determined based on previous studies found in the literature.9,17
Total phenolic content determination
The TPC determination was carried out according to Medina9 applying QUENCHER procedure.11 Ten milligrams
of previously milled sample was weighed in centrifuge tubes, with subsequent addition of FBBB reagent (0.1% in distilled water, m/v) in volumes delimited by design, followed by addition of 0.1 mL of specific catalyst of each experiment (5% NaOH, m/v or 20% Na2CO3, m/v;
all prepared with distilled water) and 9 mL of water. After reaction times determined for each experiment, the tubes were centrifuged at 9,200 × g for 4 min. The absorbance of the supernatants was measured at 420 nm in a Genesys 10 UV-Vis spectrophotometer (Thermo Fisher Scientific, Waltham, MA, USA). Furthermore, for each experiment of design, a control constituted only of the sample with 9 mL of water was also prepared, with the aim of measuring the natural non-phenolic interfering compounds in the medium.
For each experimental point, a calibration curve was prepared with gallic acid solution in concentrations of 10, 25, 50, 100, 250 and 500 mg L−1, adding initially 1 mL of
acid and following the same conditions of time and FBBB volume determined for each experiment, as well as the order of addition of them, that should not be changed. The final results of each assay were derived from calibration curves, expressed in gallic acid equivalent (GAE), by subtracting the obtained values from calibration curves and the blank values of each experiment, giving values in mg L−1. These
values were further multiplied by a conversion factor, taking into account the weighed mass of samples, to obtain the final result on mg GAE 100 g−1.
Statistical analysis
The experimental results were analyzed through
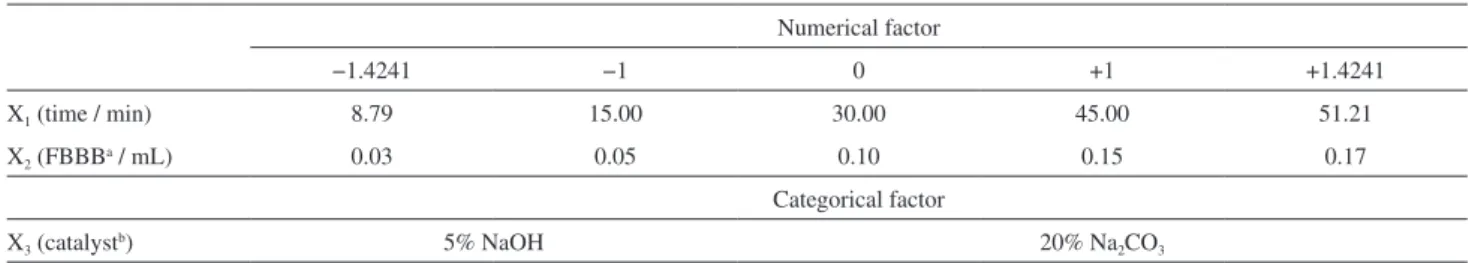
Table 1. Range and levels of variables used in the central composite design
Numerical factor
−1.4241 −1 0 +1 +1.4241
X1 (time / min) 8.79 15.00 30.00 45.00 51.21
X2 (FBBBa / mL) 0.03 0.05 0.10 0.15 0.17
Categorical factor
X3 (catalystb) 5% NaOH 20% Na2CO3
of response surface methodology generated by the Design Expert software, version 7.1.18 Model fit quality
was evaluated by analysis of variance (ANOVA) and determination coefficients. The general model equation used to fit the data was (equation 1):
Y = β0 + β1X1 + β2X2 + β3X3 + β12X1X2 + β13X1X3 +
β23X2X3 + β11X12 + β22X22 + β33X32 (1)
where Y is the desired response (TPC); X1, X2 and X3 are
independent variables representing time, FBBB volume and catalyst (5% NaOH and 20% Na2CO3), respectively;
β0 is the intercept; β1, β2 and β3 are first order coefficients
of the model; β12, β13 and β23 are linear coefficients for
interactions between factors; and β11, β22 and β33 are
quadratic coefficients of the model.
Results and Discussion
Regression model development
The first step for the optimization process of the assay is the choice of an experimental design. As described
before, the chosen design for this study was CCD. It is noteworthy to mention that the experimental design used in this work differs from central composite rotary design (CCRD), widely used in optimization works19,20 in
function of the values of the axial points, that in the CCRD are −2 and +2. This may be risky to an experimental design, since experimental points very distant from the center point may decrease the investigation quality of RSM obtained.14 To overcome this possible detrimental
factor, intermediate values for the axial points were chosen (Table 1).
The results of statistical analysis applied to experiments generated by CCD are shown in Table 2.
The responses of the experiments were submitted to analysis of variance, following a model that possesses high significance. Among available models, such as linear, two factor interactions (2FI), polynomial, quadratic and cubic, the quadratic model was selected. In this work, one of the variables was categorical. Thus, two equations in terms of actual values were obtained, one for each categorical variable (catalyst, Table 2). Positive signals in the equations (Table 2) indicated synergic effects, while negative signals indicate antagonistic effects.
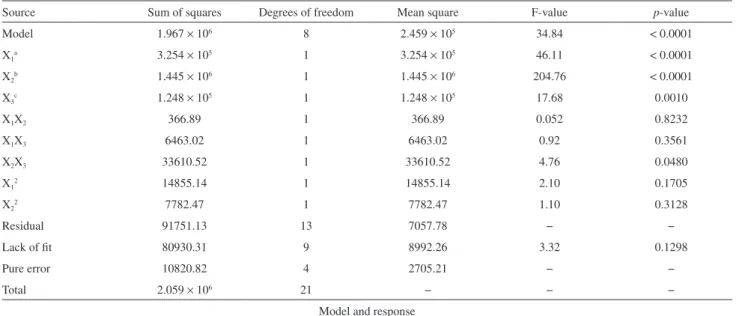
Table 2. Analysis of variance (ANOVA), quadratic models and model parameters for the obtained response
Source Sum of squares Degrees of freedom Mean square F-value p-value
Model 1.967 × 10⁶ 8 2.459 × 10⁵ 34.84 < 0.0001
X1a 3.254 × 10⁵ 1 3.254 × 10⁵ 46.11 < 0.0001
X2b 1.445 × 10⁶ 1 1.445 × 10⁶ 204.76 < 0.0001
X3c 1.248 × 10⁵ 1 1.248 × 10⁵ 17.68 0.0010
X1X2 366.89 1 366.89 0.052 0.8232
X1X3 6463.02 1 6463.02 0.92 0.3561
X2X3 33610.52 1 33610.52 4.76 0.0480
X12 14855.14 1 14855.14 2.10 0.1705
X22 7782.47 1 7782.47 1.10 0.3128
Residual 91751.13 13 7057.78 − −
Lack of fit 80930.31 9 8992.26 3.32 0.1298
Pure error 10820.82 4 2705.21 − −
Total 2.059 × 10⁶ 21 − − −
Model and response Catalyst 5% NaOH
TPC = −85.35481 + 18.74158X1 + 5098.16739X2 − 9.02950X1X2 − 0.16119X12 + 1.05001 × 104X22 Catalyst 20% Na2CO3
TPC = +168.18962 + 21.42134X1 + 3264.85021X2 − 9.02950X1X2 − 0.16119X12 + 1.05001 × 104X22 Model parameter
Mean Standard deviation R2 Adjusted R2 Coefficient of variation
987.57 84.01 0.9554 0.9280 8.51
The coefficient of determination value (R2) measures
the amount of variation in the average explained by the model, and for a well-adjusted model, this value should never be less than 0.80. When R2 is close to 1, this indicates
the empirical model is suitable for the data,14 and the value
of 0.9554 indicated a well-adjusted/suitable model for the data (Table 2). However, the addition of variables into the model will always increase the R2 values, independently
of its statistical significance. Therefore, a high R2 does not
indicate (in every case) the model to which it corresponds is suitable, and the better value would be the adjusted R2
(adj-R2) value, that only accounts for significant model
variables.14 Adj-R2 values higher than 0.90 indicate the
model is well-fitted to the data and in the present work the adj-R2 was higher than 0.90, showing a well-adjusted model.
The F-value of the model (34.84), with a p-value < 0.0001, indicates the model is significant at a 95% trust level. This p-value is an important tool to predict if a factor or interaction of factors will be statistically significant, since p-values < 0.05 indicate significance in the proposed model. The p-values indicated the X1, X2 and X3 factors (time,
FBBB reagent volume and type of catalyst, respectively) were significant, as well as the X2-X3 interaction (FBBB
reagent volume and type of catalyst, respectively). Other factors, as well as interactions that were not statistically significant, were not removed, as they had no negative effect on the model.
The low coefficient of variation (CV) value (Table 2) indicates the high precision of experimental results. The high p-value seen for lack of fit (0.1298) indicated it was not significant term for the model, confirming a well-adjusted model that explains very well the results for the experimental interval.
Another way of evaluate the efficiency of the model fit is the comparison between predicted model values and experimental values (Figure 1). The more similar the values
are, the more adjusted the model will be.14 As could be
observed in Figure 1, the predicted values by the model were closer to the obtained in our experiments.
Evaluation of the influence variables
The model equations shown in Table 2 illustrate the system behavior within the range outlined by the experimental design. For each categorical variable (type of catalyst), there is an equation for the total phenolic content. As previously explained, positive signals indicate synergic effects, while negative signals indicate antagonistic effects. In both equations, the time factor was associated with synergic effects, i.e., increased time resulted in higher responses. This effect was better observed using 20% Na2CO3, as the
increase in reaction time produces more evident elevation in final results when compared to 5% NaOH (Figure 2). A similar effect was observed for FBBB volume, where higher TPC values resulted from larger FBBB volumes added. This response was similar for both catalysts.
All of these results are consistent. A longer reaction time leads to a longer interaction between phenolic compounds
Figure 1. Predicted model values vs. experimental values.
in the rice and the FBBB reagent, yielding better and more reliable results. Moreover, higher volumes of FBBB reagent ensure the reaction with practically every phenolic compound in the sample, which may not occur at lower volumes. These observations suggested FBBB may be the limiting reactant in the process, increasing the risks of underestimation and reducing the confidence level of the final results. This can be predicted by analyzing the system, taking into account the lower and higher limits of the FBBB added (Figure 2). At the lower limit (0.03 mL), the response increased slightly over time for both catalysts, suggesting a possible limitation to the results due to the low volume of FBBB reagent. However, at the upper limit (0.17 mL), the results showed a greater variation as a function of time for both catalysts, and the most variable results were obtained from 20% Na2CO3.
On the other hand, the interaction between time and FBBB volume leads to a decrease in the final results. However, as this effect was not statistically significant, it was slightly observed in the response surface (Figure 2).
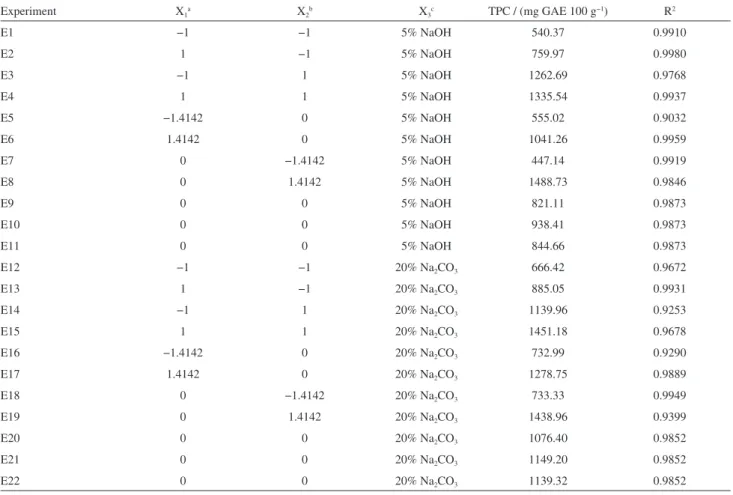
The calibration curve R2 values for each experiment
were also evaluated (Table 3). The ANOVA values for the
linearity were not shown in this work, since the intent to include these data is only to demonstrate how the different variables influence the linearity and not to optimize the system for linearity improvement. The R2 values from
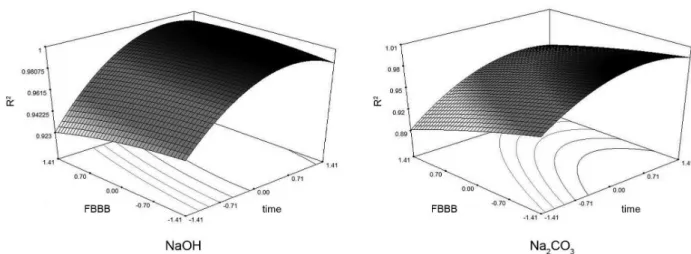
calibration curves were added as a principal response of the design, generating, as well as the principal response of the work (TPC), a response surface (Figure 3). These data showed the differences in the linearity values between catalysts more clearly.
When the influence of time on linearity was analyzed, a greater increase in linearity was seen when 5% NaOH was used (compared to 20% Na2CO3). This was in agreement
with a previous study carried out by Medina,17 where longer
reaction times result in higher linearity values. However, as could be observed for both catalysts, at the upper limits of time there was a slight decrease in linearity for the system, which may be due to the decomposition of the product formed by the reaction between gallic acid (used for the calibration curve) and FBBB reagent.
The effect of FBBB volume on linearity was peculiar. Increased volume resulted in a reduction in linearity, while at lower volumes, linearity was improved. This effect was
Table 3. Total phenolic content (TPC) and R2 of experiments
Experiment X1a X2b X3c TPC / (mg GAE 100 g−1) R2
E1 −1 −1 5% NaOH 540.37 0.9910
E2 1 −1 5% NaOH 759.97 0.9980
E3 −1 1 5% NaOH 1262.69 0.9768
E4 1 1 5% NaOH 1335.54 0.9937
E5 −1.4142 0 5% NaOH 555.02 0.9032
E6 1.4142 0 5% NaOH 1041.26 0.9959
E7 0 −1.4142 5% NaOH 447.14 0.9919
E8 0 1.4142 5% NaOH 1488.73 0.9846
E9 0 0 5% NaOH 821.11 0.9873
E10 0 0 5% NaOH 938.41 0.9873
E11 0 0 5% NaOH 844.66 0.9873
E12 −1 −1 20% Na2CO3 666.42 0.9672
E13 1 −1 20% Na2CO3 885.05 0.9931
E14 −1 1 20% Na2CO3 1139.96 0.9253
E15 1 1 20% Na2CO3 1451.18 0.9678
E16 −1.4142 0 20% Na2CO3 732.99 0.9290
E17 1.4142 0 20% Na2CO3 1278.75 0.9889
E18 0 −1.4142 20% Na2CO3 733.33 0.9949
E19 0 1.4142 20% Na2CO3 1438.96 0.9399
E20 0 0 20% Na2CO3 1076.40 0.9852
E21 0 0 20% Na2CO3 1149.20 0.9852
E22 0 0 20% Na2CO3 1139.32 0.9852
more evident when it was used 20% Na2CO3 than 5% NaOH
(Table 3). Taking into account the average reaction time (X1 = 0 or 30 min), the extreme limits of FBBB volume
(−1.4241 and +1.4142 or 0.03 and 0.17 mL, respectively), and comparing E7 and E8 (5% NaOH catalyst) with E18 and E19 (20% Na2CO3 catalyst), the difference in the R2
values between E7 and E8 was lower (0.0073) while the difference in R2 values between E18 and E19 was higher
(0.055). This difference in R2 values between NaOH and
Na2CO3 can be explained by the different strength of
the catalysts. Both convert the phenolic compounds into phenolate anions, which react quickly.21 For this purpose,
it is known that the NaOH is more reactive than Na2CO3.
The strong base reacts well with any FBBB volume (within the range evaluated in this work), which was not the case for Na2CO3. The reaction of the phenolate anions with
FBBB is more ensured when low volumes of reagent are added, leading to better linearity values. However, the increased linearity may not be reliable, because small amounts of FBBB may be limiting reaction. While linearity is improved, the reaction between FBBB and all phenolic compounds present in the sample cannot be assured, leading to underestimation of the final results. Therefore, within the studied range in this work, low volumes of FBBB are not recommended, as it could reduce accuracy of the final results.
Optimization and validation of the model
TPC results (Table 3) ranged between 447.14 and 1488.73 mg GAE 100 g−1. The models obtained previously
(Table 2) predicted slightly higher results than seen experimentally (Figure 2). As the aim was to achieve the optimum condition for the process, the variables were evaluated by the Design Expert software at the maximum intervals (−1.4142 to +1.4142) for time and FBBB volume
as well as both catalysts, in order to obtain the best possible result. The parameters that described the optimal condition were 38.01 min reaction time, 0.17 mL FBBB reagent and 20% Na2CO3 (catalyst), with the predicted
result of 1550.74 mg GAE 100 g−1. Employing these
conditions, 6 replicate experiments yielded an average value of 1461.42 mg GAE 100 g−1, which was similar to the
predicted value (CV below 8.51%), indicating the model predicted the results accurately for the specific conditions. H o w e v e r, t h e r e s u l t o f e x p e r i m e n t E 8 (1488.73 mg GAE 100 g−1) for a 30 min reaction time,
0.17 mL of FBBB reagent and 5% NaOH (catalyst) was similar to that obtained using the optimal condition for the system (Table 3). Thus, we decided to consider this point as the optimal condition of the system. The lower time of the experiment E8 regarding to the proposed by the software (38.01 min), which could be a negative point for the final result as discussed above, did not affect the final result, suggesting the difference of 8 min was not significant. The FBBB volume used in experiment E8 is higher than the proposed in the optimal condition, which avoids potential underestimation of the results. Also, experiment E8 uses the catalyst (5% NaOH) obtaining the best linearity values, improving the quality of the final results, which would not be easily achieved with 20% Na2CO3. These factors indicate
this point as the most adequate to be considered the optimal for the system comparing to the suggested by the software. It is noteworthy to mention that application of the QUENCHER procedure allows faster evaluation of the TPC of samples, ensuring a faster and more complete interaction between all phenolic compounds in the matrix with the FBBB reagent, avoiding extraction steps and chemical reactions to liberate phenolic compounds for analysis.11 This fact is more evident when we compare the
values obtained in this work (1488.78 mg GAE 100 g−1)
with our previous results (30.43 mg GAE 100 g−1)22 and
Figure 3. Response surface of R2 values for NaOH and Na
others in literature, such as obtained by Medina17 (not
detectable), Min et al.23 (960 mg GAE 100 g−1), Min et al.24
(105 mg GAE 100 g−1), all of them using extraction steps
with different solvents. These steps may be sources of error, as they may not extract/liberate all the phenolic compounds present in the sample, leading to inaccurate quantification, as these extractions/reactions rarely reach 100% yield. The rapidity of the QUENCHER procedure is evident by observing the reaction time in the optimized condition (30 min), which is much lower than the 60 and 90 min reaction time for NaOH and Na2CO3, respectively,
reported by Medina,17 which also employs FBBB for the
determination of total phenolic content using solvent extraction.
Conclusions
Using response surface methodology, it was possible to simultaneously evaluate the influences of all variables studied in this work. This enabled an extensive approach regarding to linearity of the system, showing that not always higher values of linearity are more recommended, as noted in the case of higher values of R2 in low concentrations of
FBBB for both catalysts. A great liberty of choice for the optimal point of the system was achieved, which was not limited to the R2 values. Furthermore, the proposed model
equation was well adjusted to the results, with good data prediction, indicated by the similarity between predicted and actual values under the optimal condition given by the software. Nevertheless, the optimal point chosen for the system, taking into account the similarity of the obtained results in a shorter reaction time, was based on the E8 experiment conditions, which used a 30 min reaction time, 0.17 mL FBBB reagent and 5% NaOH as catalyst. Thus, the use of a specific reagent (FBBB) along with the employment of the direct QUENCHER procedure, which was used together for the first time in TPC determination, proved to be faster and more efficient/accurate when compared to other procedures using FBBB reagent, and it could also be applied in the study of other food matrices.
Acknowledgments
This work was supported by Coordenação de Aperfeiçoamento de Pessoal de Nível Superior (CAPES).
References
1. Liu, R. H.; J. Cereal Sci. 2007, 46, 207.
2. Tananuwong, K.; Tewaruth, W.; LWT--Food Sci. Technol. 2010, 43, 476.
3. Tufan, A. N.; Çelik, S. E.; Özyürek, M.; Güçlü, K.; Apak, R.; Talanta 2013, 108, 136.
4. Klaunig, J. E.; Wang, Z.; Pu, X.; Zhou, S.; Toxicol. Appl. Pharmacol. 2011, 254, 86.
5. Folin, O.; Ciocalteu, V.; J. Biol. Chem. 1927, 73, 627. 6. Singleton, V. L.; Rossi, J. A.; Am. J. Enol. Vitic. 1965, 16, 144.
7. Sánchez-Rangel, J. C.; Benavides, J.; Heredia, J. B.; Cisneros-Zevallos, L.; Jacobo-Velázquez, D. A.; Anal. Methods 2013, 5,
5990.
8. Prior, R. L.; Wu, X.; Schaich, K.; J. Agric. Food Chem. 2005,
53, 4290.
9. Medina, M. B.; J. Funct. Foods 2011, 3, 79.
10. Lester, G. E.; Lewers, K. S.; Medina, M. B.; Saftner, R. A.; J. Food Compos. Anal. 2012, 27, 102.
11. Serpen, A.; Gökmen, V.; Pellegrini, N.; Fogliano, V.; J. Cereal Sci. 2008, 48, 816.
12. Gökmen, V.; Serpen, A.; Fogliano, V.; Trends Food Sci. Technol.
2009, 20, 278.
13. Silva, E. M.; Rogez, H.; Larondelle, Y.; Sep. Purif. Technol.
2007, 55, 381.
14. Neto, B. B.; Scarminio, I. S.; Bruns, R. E.; Como Fazer Experimentos: Pesquisa e Desenvolvimento na Ciência e na Indústria, 3a ed.; UNICAMP: Campinas, 2007.
15. Sellapan, K.; Datta, K.; Parkhi, S. K.; Datta, S. K.; Plant Sci. (Shannon, Irel.) 2009, 177, 557.
16. http://faostat.fao.org/site/339/default.aspx accessed in December 2015.
17. Medina, M. B.; J. Agric. Food. Chem. 2011, 59, 1565.
18. Stat-Ease, Inc.; Design Expert Software version 7.1; Minneapolis, USA, 2008.
19. Barizão, É. O.; Martins, A. C.; Ercoli, L.; Kvitschal, M. V.; Silva, R.; Junior, O. P.; Visentainer, J. V.; Almeida, V. C.; Food Anal. Methods 2013, 6, 1407.
20. Santos, O. O.; Maruyama, S. A.; Claus, T.; Souza, N. E.; Matsushita, M.; Visentainer, J. V.; Fuel 2013, 113, 580. 21. Solomons, T. W. G.; Fryhle, C. B.; Organic Chemistry, 7th ed.;
John Wiley & Sons, New Jersey, 2000.
22. Palombini, S. V.; Maruyama, S. A.; Claus, T.; Carbonera, F.; Souza, N. E.; Visentainer, J. V.; Gomes, S. T. G.; Matsushita, M.; Food Sci. Technol. 2013, 33, 699.
23. Min, B.; McClung, A. M.; Chen, M. H.; J. Food Sci. 2011, 76, C117.
24. Min, B.; Gu, L.; McClung, A. M.; Bergman, C. J.; Chen, M. H.; Food Chem. 2012, 133, 715.
Submitted: October 1, 2015