ISSN 1517-7076 artigo e-11988, 2018
Corresponding Author : Renata Hack Received on: 30/05/2017 Accepted on: 11/08/2017
10.1590/S1517-707620170001.0324
Characterization of graphene nanosheets
obtained by a modified Hummer
’
s method
Renata Hack 1,Cláudia Hack Gumz Correia2, Ricardo Antônio de Simone Zanon1, Sérgio Henrique Pezzin1
1 Universidade do Estado de Santa Catarina, Centro de Ciências Tecnológicas,
Programa de Pós-Graduação em Ciências e Engenharia de Materiais, PGCEM/CCT/UDESC, cep 89219-710, Joinville, SC.
e-mail: [email protected]
2 Universidade da Região de Joinville,Laboratório de Materiais,
UNIVILLE, cep 89219-710, Joinville, SC.
RESUMO
O Grafite natural é uma fonte barata e abundante para obter nanofolhas de grafeno. O método mais eficiente para a produção em grande escala é o método químico, que se baseia na oxidação de grafite natural. Este artigo relata a síntese e caracterização de grafeno obtido pelo método Hummers com algumas modificações. Os resultados indicam um elevado grau de oxidação do grafite, provando que o processo foi eficiente. As análises de microscopia eletrônica de varredura de emissão de campo (FEG), microscopia electrônica de transmissão (TEM), espectroscopia Raman, análise termogravimétrica (TGA) e difração de raios-X revela-ram que o grafeno produzido apresentou características similares ao grafeno comercial.
Palavras-chave: Grafeno, nanofolhas de grafeno, método de Hummers modificado.
ABSTRACT
Natural graphite is an inexpensive and abundant source to obtain graphene nanosheets. The most efficient method for large-scale production is the chemical method, which is based on the oxidation of natural graphite. This paper reports the synthesis and characterization of graphene obtained by the Hummers method with some modifications. The results indicate a high degree of graphite oxidation, proving that the process was efficient. Analyses of field emission scanning electron microscopy (FEG), transmission electron microscopy (TEM), Raman spectroscopy, thermogravimetric analysis (TGA) and X-ray diffraction showed that the graphene produced presented characteristics similar to the commercial graphene.
Keywords: Graphene, nanosheets graphene, Hummers method modified.
1. INTRODUCTION
In recent decades, nanotechnology and development of new materials had a major highlight in science. Phys-ical and chemPhys-ical phenomena do not completely known yet, caused by the generation of a much larger sur-face area compared to the volume of the nanoparticles, could be verified at nanoscale [1]. This sursur-face act as an interface for the charge transfer, but is also responsible for the strong tendency of nanoparticles to form agglomerates, caused by van der Waals interactions between particles [2,3]. Nevertheless, it is believed that these new materials are the next step in the evolution of engineering materials [4].
Currently, graphene is obtained by several different processes, but most of these production methods results in small amounts of the material. Among these processes are the chemical routes, such as the Hum-mer’s method, considered the most promising for the production of graphene on a large scale. In this process, natural graphite (NG) is oxidized by a mixture of acids and oxidizing agents, promoting the oxidation of graphite to graphite oxide (GO), containing oxygenated functional groups. Subsequently, the GO undergoes a thermal expansion and is then converted to graphene by reducing agents [12,13].
In this paper, a modified Hummer’s method was adopted for the production of graphene nanoparticles, in order to scale the process. This method was chosen due to two major factors: the possibility of obtaining high amounts of graphene, and low-cost equipment and reagents. The objective was to produce nanosheets of graphene from GO and characterize their morphology and thermal properties, comparing them with those of a commercial graphene, for further application in multifunctional nanocomposites.
2. MATERIALS AND METHODS
For this work we used two types of graphene, the first (G1) was obtained by oxidation and reduction of graphite, described in the next sessions, while the second (G2) commercially acquired.
2.1 Graphite Oxide (GO)
The graphite oxide (GO) was produced from natural graphite, using the method of Hummer [14]. This meth-od has been slightly mmeth-odified in relation to the process times and proportions of reagents. In a 500 ml ound bottom flask it was added 1 g of natural graphite, 62.1 g of H2SO4 and 0.75 g of NaNO3. The mixture was kept in a water bath at approximately 6 oC under mechanical stirring at 180 rpm. After 15 min, 4,5 g of KMnO4 was slowly added to the mixture, always keeping the temperature below 20 °C. After 30 min the system was allowed to reach the room temperature, and then left under stirring for 24 h. After this period, a brown colored viscous liquid was obtained. To this mixture it was added 100 ml of a 5% (w/w) H2SO4 solu-tion, which causes an increase in temperature and changes the color to dark yellow. After 30 min, 280 ml of a solution of H2O2 (3% w/w) was added to the mixture. In this step of the process, a slight effervescence oc-curred when adding H2O2 solution and the color changed to bright yellow. The mixture was kept under stir-ring for 45 min. The obtained mixture was filtered with the aid of a vacuum system comprising a Büchner funnel 12,5 mm diameter and filter paper with permeability of 26 L/s.m. The material obtained in the filter paper was washed with 300 mL of a warm solution of HCl 10% w/w to remove metal ions remaining on the collected material. After drying the material over a period of 24 h at 60 ° C, the material was suspended in 1L of deionized water and vacuum filtered again. The washing process was repeated three times. The material was then dried in an oven for 24 h at a temperature of 60 °C, yielding GO.
2.2 Expanded graphite oxide (OGE)
A preheated muffle furnace at a temperature of 350 °C was used to expand the GO. The GO was distributed at the bottom of a 50 mL Erlenmeyer with an aluminum foil lid with small holes and taken to the furnace. After approximately 15 seconds the material has undergone expansion to give expanded graphite oxide (EGO).
2.3 Reduced graphite oxide (G1)
For the chemical reduction of EGO it was used a 4% (w/w) solution of sodium borohydride (NaBH4) as re-ducing agent, as suggested by Si & Samulki [15]. Studies performed by Shen et al [16] showed that the NaBH4 has same efficiency as hydrazine (N2H4). In a 100 ml beaker, 75 mg of EGO were suspended in 75 g of deionized water and kept for 1 h in an ultrasound bath (Unique, USC-1800). Then, 15 mL of a solution of NaBH4 (95.0%) 4% w/w was added to the suspension. The pH of the suspension was adjusted between 9-10 with sodium carbonate solution at 4% w/w. After pH adjustment, the suspension was maintained for 1 h at 80 °C under constant magnetic stirring. Then, the material was filtered with the aid of a vacuum system in a Büchner funnel of 12,5 mm diameter and filter paper with permeability of 26 L/s.m2. The material that re-mained on the filter paper was collected and washed with 250 mL of deionized water. After this process, the material was dried in a vacuum oven for 24 h at 60 °C, yielding produced graphene (G1).
2.4 Characterization
analyses of field emission scanning electron microscopy (FEG) were performed in a Jeol JSM-67017F equipment.
The Raman spectra were recorded in a WITEC UHTS300 spectrometer using a 597.990 nm laser. Thermogravimetric analyses (TGA) were performed on an TGA Q50 V20.10 (TA Instruments, USA) equipment. Samples (approximately 10 mg) were subjected to heating from ambient temperature (approxi-mately 24 °C) to 550 °C at a heating rate of 10 oC / min, under an inert atmosphere with N
2 flow of 50 ml/min.
X-ray diffraction analyses were done in a Shimadzu XRD-6000 equipment operating at 40.0 kV and 30.0 mA, with a wavelength of 1.54060 Å. The measurements were made at room temperature, with 2θ vary-ing from 10 ° to 60 °.
3. RESULTS AND DISCUSSION
3.1 Field emission scanning electron microscopy (FEG)
Figure 1 (a-b) show the images of natural graphite and GO, respectively. It is possible to verify that the graphite structure is formed by several thick layers arranged in stacks. Moreover, the oxidation of graphite caused changes in its morphology, with a wrinkled appearance with several folds. This wrinkled aspect can be explained by the oxidation process to promote the admission of hydroxyl and epoxy functional groups, altering the hybridization of sp2 carbons (planar structure) to sp3 (tetrahedral structure).
One can also observe that the GO is formed by a layered structure. This is due to the oxidation of the material, since the greater the degree of oxidation, the higher are the spaces between the functionalized lay-ers. Dikin et al (2007) gave results similar to that observed obtaining a layered structure with several folding [17].
Figure 1: FEG images of (a) natural graphite and (b) GO.
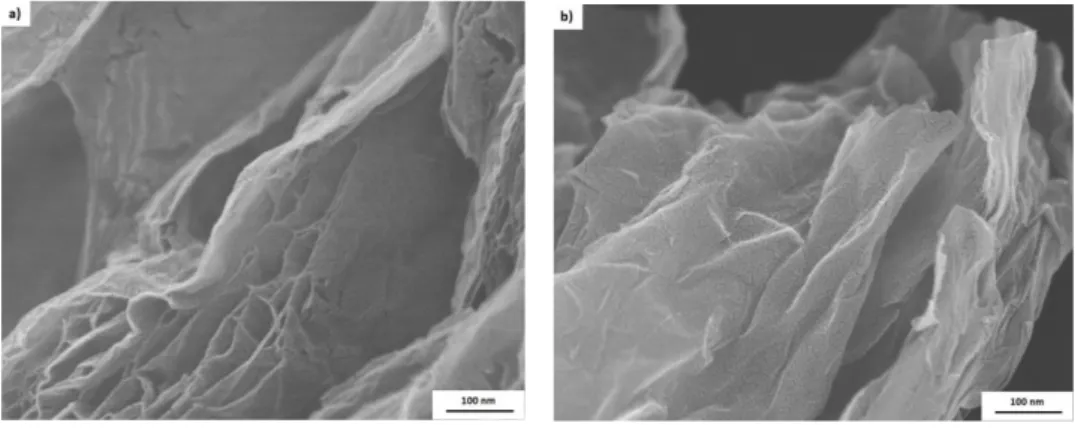
Figure 2: FEG images of (a) EGO and (b) G1.
It is also observed, by the FEG micrographs, that the nanoparticles went from an ordered lamellar arrangement (natural graphite) to an asymmetric structure, with different sizes and a rough and discontinuous layered morphology (G1). This fact is related to the oxidation/expansion processes and, possibly, also to the sonication procedure, as the passage of ultrasound waves through the material dispersed in a liquid medium leads to the formation of bubbles, suffering collapse when their volume is increased, and releasing large amounts of energy that can shatter the structure of material [19]. The rough morphology of G1 sheets was also observed in other studies using ultrasound to the dispersion of graphite in the solvent, also indicating the formation of structures with different shapes and sizes [20].
Figure 3 presents a G2 FEG image, showing a layered flat morphology of the sample surface, similar to the G1 structure in Figure 2 (b).
Figure 3: FEG image of G2.
Nevertheless, as commented by Kim et al (2010) [21], methods from the graphite oxide to obtain graphene have a relatively good yield, but in general, lead to the formation of irregular and defects structures, when compared to bottom-up methods, which are based on the formation of graphene from gases with a high carbon concentration.
3.2 Transmission electron microscopy (TEM)
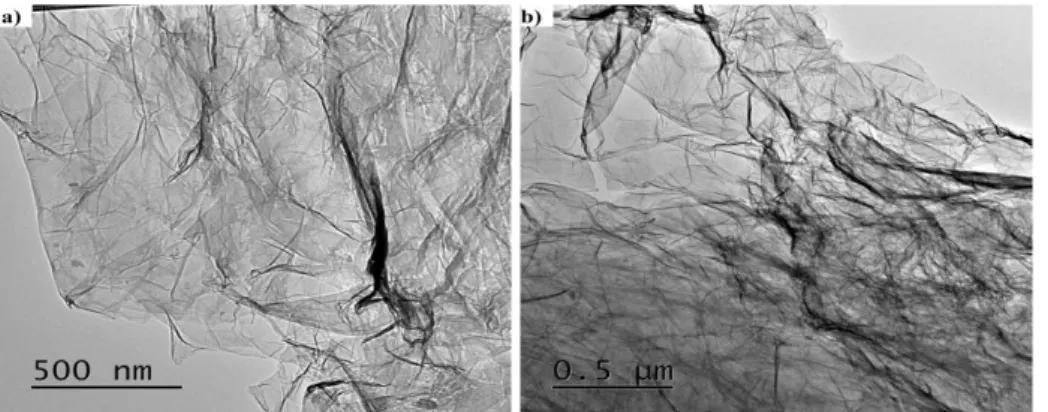
Figure 4: TEM images of GO: (a) Scale bar 500 nm; (b) Scale bar 0.5 µm .
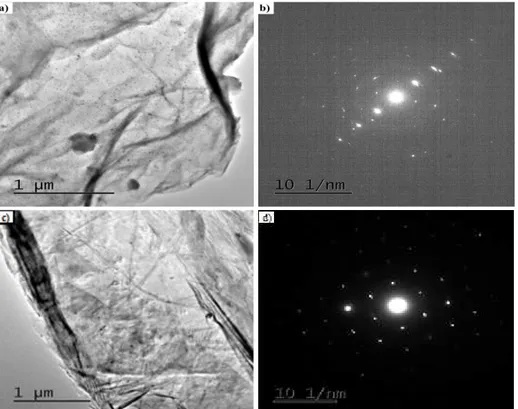
TEM micrograph (Figure 5a) and electron diffraction pattern (Figure 5b) of EGO show that the level of exfoliation by thermal expansion at 350 °C was high due to the translucency of platelets, indicating that there are few layers of bundled sheets. Kim et al (2009b) [22] also observed similar results, as well as Gray-fer et al (2011) [23], expanding graphite oxide at a temperature of 900 °C. This similarity indicates that the exfoliation of graphite oxide can be accomplished even at much lower temperatures, such as 350 °C. The electron diffraction pattern obtained from the sample, Figure 5 (b) shows a well-defined hexagonal array, indicating that the analyzed material does not have a significant number of superimposed sheets.
Figure 5: (a) TEM image and (b) electron diffraction pattern of a EGO sample.
A similar morphology, consisted of bundled sheets, is also observed for G1 samples (Figure 6a). Looking at the electron diffraction pattern for G1 (Figure 6b), it can be observed the presence of internal points with lower light intensities than other external points, evidencing a polycrystalline material. In any case, it can be said that the material has a hexagonal pattern and a structure containing a smaller number of layers than the original natural graphite.
Figure 6: TEM image and (b) electron diffraction pattern of a G1 sample.
3.3 Raman spectroscopy
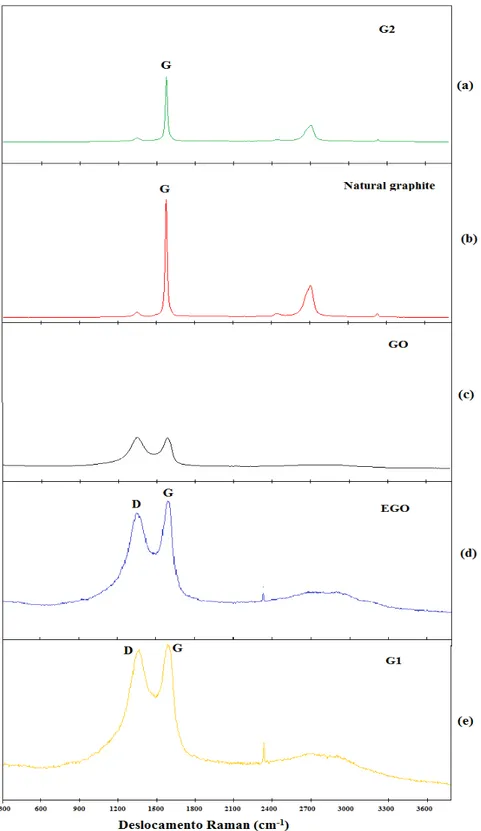
Raman spectroscopy is widely used in structural and electronic characterization of graphitic materials. The Raman spectrum provides useful information on defects, carbon sp2 vibrations and the stacking order.
Figure 7 shows the Raman spectra for graphite, GO, EGO, G1 and G2. Figure 7 (a), for the G2 sam-ple, shows a peak at 1583 cm-1 related to the G band of the graphitic structure (sp2 carbon), also observed by Fim (2012) [25]. It is also possible to observe a broad peak located at 2712 cm-1 corresponding to the 2D band.
Analyzing the spectrum of Figure 7 (b) for natural graphite, it is also noted a band at 1573 cm-1 related to the G band of graphitic structure, and a wide and high peak located at 2708 cm-1 related to the 2D band, as reported by Ferrari (2007) [26].
Figure 7 (c) shows the Raman spectrum of a GO sample. It can be seen the D band located at 1348 cm-1 and a second peak located at 1587 cm-1, related to the G band of graphitic structure (sp2 carbon). Gupta et al (2017) [27] also observed bands D and G in their study, characteristic of GO.
In Figure 7 (c) it is observed that these two peaks are not very intense and very wide, having very specific characteristics of amorphous carbon, with broad D and G bands and no peaks in the second order zone.
The Raman spectrum of EGO can be seen in Figure 7 (d). It is possible to verify a partial restoration of the carbon sp2 network, located at 1600 cm-1. In fact, it is noted the appearance of a peak in the second order zone, indicating that the material has organized graphene sheets. Fim (2012) [25] also observed this behavior in graphite oxide after heat treatment.
Figure 7: Raman Spectrum: (a) G2; (b) natural graphite; (c) GO; (d) EGO and (e) G1.
3.4 Thermogravimetric Analysis (TGA)
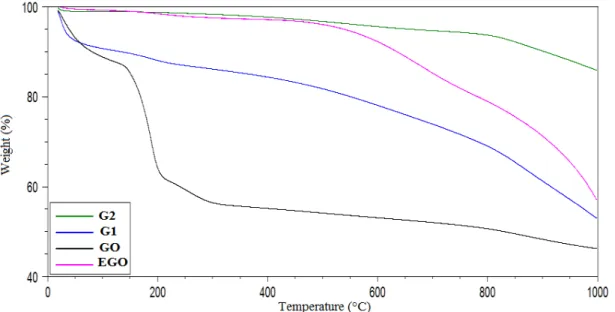
event may be related to the disruption of the carbon network [29]. Chen et al (2010c) [30] also found very similar results and attributed the first event to the removal of O2, CO, CO2, and H2O. The authors suggest that the second event is due to the reactivity of oxygen present in the GO structure, which takes oxygen present in the GO structure to react with the carbon surface to form CO and CO2.
Figure 8: Mass loss versus temperature curves for samples G2, G1, OG and OGE.
The mass loss curve of EGO (pink curve), shows only one stage, a different behavior in comparison to that found for GO curve. The mass loss starts at about 550 °C and can be attributed to loss of oxygenated groups that may be present in the sample. Among 550 oC to 1000 oC this behavior may be associated with structural rearrangement of carbon.
The weight loss curve for the G2 sample also shows only a degradation stage, indicating that there is a lack of oxygen and hydroxyl groups in G2 [30], and suggesting a high degree of reduction and quality in the manufacturing process.
The mass loss curve of G1 is similar to that of G2, with only one stage of degradation, also indicating the absence of oxygen and hydroxyl groups, and, thus, suggesting a successful reduction process. It can be also seen in the curve for the G1 sample, an initial mass loss at 95 °C, which is associated with the sample’s moisture content. Furthermore, all analyzed samples presented a high amount of residue, over 50%, at 1000 oC. Stankovich and coworkers [31] showed that after the reduction, i.e., after removal of the oxygenated groups, the thermal stability of the material increases, thus explaining the high content of residue, as ob-served in this study. Nevertheless, the variation of the residue amount when comparing G1 and G2, ca 50% and 85%, respectively can be related to some GO remaining in G1.
3.5 X-Ray Diffraction (XRD)
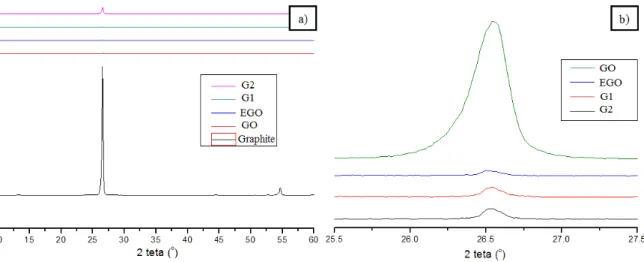
X-ray diffraction (XRD) analyses were carried out to assess the effectiveness of the oxidation, expansion and reduction of graphite. Figure 9 (a) illustrates the XRD pattern for the natural graphite, GO, EGO, G1 and G2. The diffractogram for natural graphite shows the presence of a high intensity peak at 2θ = 26,65o, which corresponds to a basal spacing of 0.334 nm, followed by a peak at 54,92o, both of them characteristics of graphite [32,33].
Figure 9: XRD diffraction patterns of natural graphite, GO, EGO, RGO (G1) and G2 samples.
Figure 9 (b) shows in more detail the low intensity region of Figure 9 (a). The XRD patterns of GO and EGO confirms the intercalation and further exfoliation of most of the graphite layers.
In the diffractogram of the G1 sample, it is observed only a low intensity halo, even less intense than those observed for GO and EGO. This suggests that the chemical reduction of expanded graphite oxide, alt-hough changes its hybridization from sp3 to sp2 and eliminates functional groups that have been introduced in the oxidizing material, does not restore the graphite lamellar structure.
The diffractogram related to the G2 sample shows a higher intensity peak at 26.5o, indicating the for-mation of graphene nanoplatelets with the same basal spacing as natural graphite.
4. CONCLUSION
Graphene nanoplatelets have been successfully prepared by graphite oxidation followed by thermal expan-sion of the graphite oxide and further reduction with sodium borohydride.
Regarding the thermal expansion of graphite oxide, it was proved that the exfoliation takes place at a 350 °C, a much lower temperature than most of the procedures reported in the literature. Moreover, the re-duction of the expanded graphite oxide by sodium borohydride proved to be very effective.
5. BIBLIOGRAFIA
[1] PEZZIN, S.H., AMICO, S.C., COELHO, L.A.F., “Nanoreinforcements for nanocomposite materials”, In: BERGMANN, C.P., ANDRADE, M.J., Nanostructured Materials of Engineering Applications, 1 ed., Editor Springer Berlin Heidelberg, 2011.
[2] FIEDLER, B., GOJNY, F.H., WICHMANN, M.H.G., et al., “Fundamental aspects of nano-reinforced composites”, Composites Science and Technology”, v66, n.16, pp 3115-3125, Dec. 2006.
[3] GOUMRI, M., POILÂNE, C., RUTERANA, P., et al., “Synthesis and characterization of nano-composites films with graphene oxide and reduced graphene oxide nanosheets”, Chinese Journal of Phys-ics,v 55, n.2, pp 412-422, Apr. 2017.
[4] AMICO, S.C., PEZZIN, S.H., COELHO, L.A. F., “Nanocompósitos de matriz polimérica com nanotubos de carbono”, In Pohlmann, A.R., Petter, C.O.; Balzaretti, N.M., et al, Tópicos em Nanociência e Nanotecno-logia, 1 ed., Porto Alegre, Brazil, Editor of UFRGS, 2008.
[5] KHOLMANOV, I.N., CAVALIERE, E., CEPEK, C., et al., “Catalytic chemical vapor deposition of methane on graphite to produce graphene structures”, Carbon, v 48, n. 48, pp 1619–1625, Apr. 2010.
[6] NOVOSELOV, K.S., GEIM, A.K., MOROZOV,S. V., et al., “Two-dimensional gas of massless Dirac fermions in graphene”, Nature, v 438, pp 197-200, Nov. 2005.
[7] VILLAR-RODIL, S., PAREDES, J.I., MARTINEZ-ALONSO, A., et al., “Preparation of graphene di s-persions and graphene-polymer composites in organic media”, Journal of Materials Chemistry, v 19, pp 3591-3593, Apr. 2009.
composites”, Carbon, v 47, n. 3, pp 922–925, Mar. 2009.
[9] ZHANG, Y., TAN, Y., STORMER, H.L., et al., “Experimental observation of the quantum Hall effect and Berry`s phase in graphene”, Nature, v 438, pp 201-204, Nov. 2005.
[10] LEE, C., WEI, X.D., KYSAR, J.W., et al., “Measurement of the elastic properties and intrinsic strength of monolayer graphene”, Science, v 321, n. 5887, pp 385-388, Jul. 2008.
[11] SCHOENENBERGER C., “Band structure of graphene and carbon nanotubes: Na exercise in condensed matter physics”, University of Basel, Apr. 2000.
[12] COMPTON, O.C., NGUYEN, S.T., “Graphene oxide, highly reduced graphene oxide, and graphene: versatile building blocks for carbon-based materials”, Small, v6, n.6, pp 711-723, Mar. 2010.
[13] SILVA, D.D.S., SANTOS, W.F., PEZZIN, S.H., “Nanocompósitos de matriz polimérica produzidos a partir do grafite natural”, Matéria, v 18, n. 2, pp. 1260-1272, Mai. 2013.
[14] HUMMERS, W.S., OFFEMAN, R.E., “Preparation of graphitic oxide”, Journal of the American Chemical Society, v 80, n. 6, pp. 1339, 1958.
[15] SI, Y., SAMULSKI, E.T., “Synthesis of water soluble graphene”, Nano Letters, v 8, n. 6, pp 1679-1682, May. 2008.
[16] SHIN, H-J., KIM, K.K., BENAYAD, A., et al., “Efficient reduction of graphite oxide by sodium bor o-hydride and its effect on electrical conductance”, Advanced Functional Materials, v 19, n. 12, pp 1987-1992, Jun. 2009.
[17] DIKIN, D.A., STANKOVICH, S., ZIMNEY, E.J., et al., “Preparation and characterization of graphene oxide paper”, Nature, v448, pp 457-460, Jun. 2007.
[18] YASMIN, A., LUO, J-J., DANIEL, I.M., “Processing of expanded graphite reinforced polymer nano-composites”, Composites Science and Technology, v 66, n. 9, pp 1128-1189, Jul. 2006.
[19] CHEN, G., WENG, W., WU, D., et al, “Preparation and characterization of graphite nanosheets from ultrasonic powdering technique”, Carbon, v 42, n.4, pp 753-759, Dec. 2003.
[20] LOTYA, M., KING, P.J., KHAN, U., et al., “High-concentration, surfactant-stabilized graphene disper-sions”, ASC Nano, v 4, n.6, pp 3155–3162, May. 2010.
[21] KIM, H., ABDALA, A.A., MACOSKO, C.W., “Graphene/Polimer Nanocompositer”, Macromolecules, v 43, n. 16, pp 6515-6530, Jul. 2010.
[22] KIM, K-S., ZHAO, Y., JANG, H., et al., “Large-scale pattern growth of graphene films for stretchable transparent electrodes”, Nature, v 457, pp 706-710, Jan. 2009.
[23] GRAYFER, E.D., NAZAROV, A. S., MAKOTCHENKO, V.G., et al., “Chemically modified graphene sheets by functionalization of highly exfoliated graphite”, Journal of Materials Chemistry, v 21, n. 21, pp
3410-3414, Nov. 2010.
[24] HERNANDEZ, Y., NICOLOSI, V., LOTYA, M., et al., “High-yeld production of graphene by liquid-phase exfoliation of graphite”. Nature nanotechnology, v 3, pp 563-568, Aug. 2008.
[25] FIM, F.C. Síntese de propriedades de nanocompósitos de polietileno/nanolâminas de grafeno obtidos através de polimerização in situ, D.Sc. Thesis, UFRGS, Porto Alegre, RS, Brazil, 2012.
[26] FERRARI, A.C., “Raman spectroscopy of graphene and graphite: Disorder, electron-phonon coupling, doping and nonadiabatic effects”, Solid State Commun, v 143, pp 47-57, Apr. 2007.
[27] GUPTA. V., SHARMA,N., SINGH, U., et al., “ Higher oxidation level in graphene oxide”, Optik- In-ternational journal for light and electron optics, v. 143, pp. 115-124, Aug. 2017.
[28] ALI, F., AGARWAL, N., NAYAK, P.K., et al. “Chemical route to the formation of graphene”, Current Science, v. 97, n. 5, pp 683-685, Sep. 2009.
[29] AKHAVAN, O. “The effect of heat treatment on formation of graphene thin films from graphene oxide nanosheets”, Carbon, v 48, n. 2, pp, 509-519, Fer. 2010.
[30] CHEN, W., YAN, L., BANGAL, P.R., “Preparation of graphene by the rapid and mild thermal reduction of graphene oxide induced by microwaves”, Carbon, v 48, n. 4, pp 1146-1152, Apr. 2010.
[31] STANKOVICH, S., DIKIN, D.A., DOMMETT, G.H.B., et al., “Graphene-based composite materials”, Nature, v 442, pp 282-286, Jul. 2006.