Universidade Nova de Lisboa Faculdade de Ciências e Tecnologia
Departamento de Informática
Dissertação de Mestrado
Automated Image Tagging through Tag Propagation
Miguel Marinhas da Silva (29727)
Orientador: Prof. Doutor João Miguel da Costa Magalhães
Trabalho apresentado no âmbito do Mestrado em
Engenharia Informática, como requisito parcial
Para obtenção do grau de Mestre em Engenharia
Informática.
Automated Image Tagging through Tag Propagation
Indicação dos direitos de cópia
© 2011 - All rights reserved. Miguel Marinhas da Silva.
Faculdade de Ciência e Tecnologia. Universidade Nova de Lisboa.
A Faculdade de Ciências e Tecnologia e a Universidade Nova de Lisboa têm o direito, perpétuo e sem limites geográficos, de arquivar e publicar esta dissertação através de exemplares impressos reproduzidos em papel ou de forma digital, ou por qualquer outro meio conhecido ou que venha a ser inventado, e de a divulgar através de repositórios científicos e de admitir a sua cópia e distribuição com objetivos educacionais ou de investigação, não comerciais, desde que seja dado crédito ao autor e editor.
Copyright
© 2011 - All rights reserved. Miguel Marinhas da Silva.
Faculdade de Ciência e Tecnologia. Universidade Nova de Lisboa.
Nº do aluno: 29727
Nome: Miguel Marinhas da Silva
Título da dissertação:
Automated Image Tagging through Tag Propagation
Palavras-Chave:
Anotação de multimédia Aprendizagem automática Classificação multimodal Tags
Extracção de metadados ImageCLEF
Keywords:
Multimedia annotation Machine Learning Multimodal classification Tags
Agradecimentos
Esta tese representa não só o meu trabalho de mestrado, mas é sobretudo o culminar do meu percurso académico. A vida académica para mim foi como acordar no breu da noite, lentamente e com alguns tropeções fui conseguindo ligar luz atrás de luz, até que consegui descobrir o meu caminho.
Em primeiro lugar gostaria de agradecer ao meu orientador, Professor João Magalhães, que me aceitou como seu orientando, tendo eu a honra de continuar o trabalho desenvolvido na sua tese de doutoramento. Obrigado pela paciência que teve comigo, por me desafiar a melhorar, por me guiar no rumo certo, mas sobretudo pela oportunidade única que me concedeu de trabalhar num projecto com o qual tanto aprendi.
Gostaria de agradecer também à Quidgest que me permitiu continuar os meus estudos em detrimento do trabalho na empresa. Foram cruciais no meu crescimento pessoal e profissional. Obrigado Carlos, Cristina e João Paulo. Obrigado também a todos os colegas de trabalho durante estes anos.
Agradeço à Fundação para a Ciência e Tecnologia a bolsa concedida que me permitiu poder focar apenas no meu trabalho mesmo durante um período de crise ecónomica.
A todos os meus amigos e companheiros o meu apreço. Ao David e Zé Miguel em particular pela ajuda na revisão da tese e interessantes discussões sobre a vida e tecnologia. Ao Filipe O., Filipe A., e João pela amizade e permitirem-me momentos de distracção. Aos colegas de casa pela comida e conversa.
Por último mas não menos importante gostaria de agradecer à minha familía por me ter suportado em mais que uma maneira durante todo este tempo. Um especial abraço ao avô Zé e à avô Cristina duas pessoas fundamentais no meu crescimento.
Obrigado Pai, Mãe, Joana e Teresa, esta tese é também para vocês.
Abstract
Today, more and more data is becoming available on the Web. In particular, we have recently witnessed an exponential increase of multimedia content within various content sharing websites. While this content is widely available, great challenges have arisen to effectively search and browse such vast amount of content. A solution to this problem is to annotate information, a task that without computer aid requires a large-scale human effort. The goal of this thesis is to automate the task of annotating multimedia information with machine learning algorithms.
We propose the development of a machine learning framework capable of doing automated image annotation in large-scale consumer photos. To this extent a study on state of art algorithms was conducted, which concluded with a baseline implementation of a k-nearest neighbor algorithm. This baseline was used to implement a more advanced algorithm capable of annotating images in the situations with limited training images and a large set of test images – thus, a semi-supervised approach.
Further studies were conducted on the feature spaces used to describe images towards a successful integration in the developed framework. We first analyzed the semantic gap between the visual feature spaces and concepts present in an image, and how to avoid or mitigate this gap. Moreover, we examined how users perceive images by performing a statistical analysis of the image tags inserted by users. A linguistic and statistical expansion of image tags was also implemented.
Sumário
O volume de informação disponível na Web é, nos nossos tempos, cada vez maior, em particular tem-se assistido recentemente a um crescimento exponencial de conteúdos multimédia. Embora estes conteúdos sejam facilmente disponibilizados aos utilizadores, existem grandes dificuldades na procura e pesquisa sobre este conjunto tão vasto de informação. A solução para este problema é a anotação da informação, uma tarefa que sem a assistência de automatismos computacionais requer um grande esforço de trabalho humano. O objectivo desta tese é a automação da anotação de informação multimédia utilizando algoritmos de aprendizagem máquina.
Propomos o desenvolvimento de um framework de aprendizagem máquina capazes de executar anotação automática em repositórios públicos de imagens, tais como Flickr ou Picasa. Para este efeito foi efectuado um estudo sobre o estado da arte de algoritmos de anotação automática de imagens, concluindo com uma implementação base do algoritmo de k-nearest neighbor. Esta implementação base serve o propósito de preparação do trabalho para a construção de um novo algoritmo capaz de anotar imagens com poucas imagens de treino e em grandes conjuntos de imagens de teste – isto é uma abordagem semi-supervisionada.
Foi também efectuado um estudo adicional sobre as características de imagens de forma à sua integração no framework desenvolvido. Analisámos em particular o fosso semântico entre as características que compõem a imagem, e como evitar ou mitigar este fosso. Foi também analisada a forma como os humanos interpretam as imagens efectuando uma análise estatística nas tags das imagens inseridas pelos utilizadores. O resultado desta análise foi a implementação de um framework de expansão linguística e estatística das tags das imagens.
Contents
1 Introduction 1
1.1 Image metadata 2
1.1.1 Visual data 4
1.1.2 Keywords and concepts 4
1.1.3 User tags 4
1.1.4 Annotations 5
1.2 Motivation: Image annotation 5
1.3 Objective 7
1.4 Proposed Framework 7
1.5 Organization 8
2 Related Work 9
2.1 Introduction 9
2.2 Textual feature descriptors/Social media tags 9
2.2.1 Motivation for tagging 10
2.2.2 Incomplete and inconsistent tagging 10
2.2.3 Types of relevance 11
2.2.4 The category of a tag 12
2.2.5 The subjectiveness of a tag 13
2.3 Image feature descriptors 14
2.3.1 Hue Saturation Value color histogram moments 14
2.3.2 Tamura features 16
2.3.3 Gabor filter moments 17
2.4 Machine learning based annotation 18
2.5 Annotation algorithms 19
2.5.1 Graph based Methods and Semantics 19
2.5.2 Graph Modeling 20
2.5.3 Learning with Local and Global Consistency 20
2.6 Evaluation methods 21
2.6.1 Datasets 21
2.6.2 Metrics 22
2.7 Summary 23
3 Feature-based image annotation 25
3.1 Introduction 25
3.2 Image feature vectors 27
3.2.1 Text-based feature vector 28
3.2.2 Visual-based feature vector 28
3.3 A k-NN framework 29
3.3.1 Similarity scores 30
3.3.2 Term weighting 31
3.3.3 Neighbors weighting 31
3.3.4 Parameter estimation by cross validation 32
3.4 Tag-based image annotation 33
3.4.1 Experiment protocol and data 33
3.4.2 Similarity Scores 33
3.4.3 Term weighing 34
3.4.4 Neighbors weighting 35
3.4.5 Discussion 36
3.5 Visual-based image annotation 37
3.5.1 HSV Color moments 37
3.5.2 Tamura features 38
3.5.3 Gabor filter moments 39
3.5.4 Per-Annotation analysis 40
3.6 Summary 42
4 User tags model 45
4.1 Introduction 45
4.2 User tags model 47
4.2.1 Data 48
4.2.2 Tags and Annotations 49
4.3 Raw tags 50
4.4.1 Spellchecking 51
4.4.2 Semantic similarities 51
4.5 Statistical tag corrections and expansions 52
4.6 Evaluation 53
4.6.1 Results 53
4.6.2 Discussions 55
4.7 Conclusions 56
5 Knowledge-based image annotation 57
5.1 Introduction 57
5.2 Knowledge and feature fusion 58
5.2.1 Knowledge sources 58
5.2.2 Feature-fusion 59
5.3 Local and global consistency 60
5.3.1 Algorithm 62
5.4 Evaluation 63
5.4.1 Data and experiment protocol 63
5.4.2 Experiment 1: Raw tags versus Expanded tags 63
5.4.3 Experiment 2: Single feature LLGC 64
5.4.4 Experiment 3: Multi-feature k-NN – Top-k vs Avg-k 66
5.4.5 Experiment 4: Knowledge and feature fusion 67
5.5 Summary 70
6 Conclusion 71
6.1 Achievements 71
6.2 Future work 72
1
Introduction
Librarians have always catalogued/annotated books and other documents as part of their job. Similarly, professional annotators have also annotated multimedia information (e.g., TV interviews, professional stock photos) as part of their jobs. The task of adding metadata to information consists in the association of an annotation to a document, i.e. a photo of a dog might have the annotation “dog” or “animal” associated to it. The goal is to make information available to users, either through search applications (pull) or recommender applications (push). With today’s increasing amount of data in the World Wide Web, namely in multimedia contexts (e.g. YouTube1, Flickr2), and the information search paradigm well established (e.g. Google3) there is a need to correctly organize and annotate multimedia information. A vast amount of un-annotated data is available while annotated data is scarce and requires, most of the times, expensive human effort to be annotated. Figure 1 depicts an example of search by keyword, namely “sky”, with its accompanying returned results.
Automating the task of information annotation or cataloging is especially problematic for multimedia content such as images and video because most search engines discard visual (colors, textures) and audio features (pitch, rhythm) and only consider the textual part of content (such as filename or text surrounding the item). The additional effort to embed both text and visual data in a multimedia annotation task can produce
significant improvements. The result of this effort is beginning to show up in search engines, such as Google’s content-type filters that detect visual features, although there is prevalence of textual features usage over visual features.
When viewing a photo, humans naturally extract concepts from it that can be related to the photos time, location, scene or event among others. Further concept detection can be made if a group of photos is available instead of just one photo, making it possible to establish comparisons and extract similar concepts that were otherwise hidden. This process is natural to humans but it is much more complex in machines. In the case of machines, annotation requires knowledge of the existing features in the photo, either supplied by humans in the form of tags (user annotations), or embedded in the photo (visual features) to infer the presence of concepts. The process of inferring the presence of concepts in multimedia information, through image annotation, is the core problem addressed by this thesis.
Figure 1 - Google Search by the keyword sky.
1.1 Image metadata
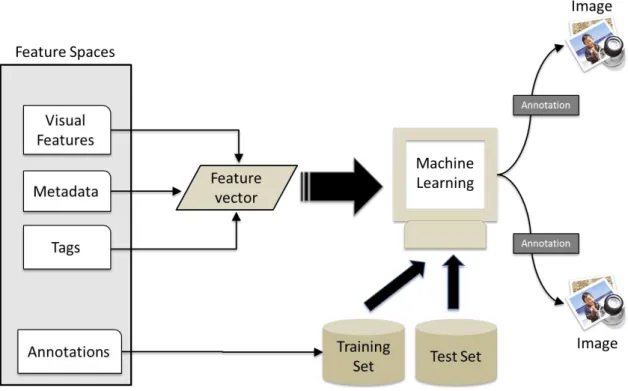
Figure 2 - The different features spaces of an image.
These different characteristics are called feature spaces and each one is defined by the method to compute the representation of an image on a given feature space. In this thesis we will characterize an image as a vector:
{ }
composed by a feature vector describing the text part of the image, a feature vector describing the visual part of the image, a feature vector containing the capturing device metadata and the vector containing annotation confidence scores. More specifically, the image vector is composed by the feature vectors:
contains the EXIF metadata added by the capturing device, e.g., video camera, phone camera;
contains the tags added by the users. Usually it is a cleaned version of the user annotations (spell checked, stemmed etc.);
contains annotation confidence scores concerning the presence of the corresponding concept in that image.
The objective of this thesis is shown in Figure 2. Using the visual feature vector (green rectangle) and textual feature vector (purple rectangle) features we aim to annotate images concerning concepts presence using the vector (blue rectangle).
1.1.1 Visual data
Visual data or low-level features corresponds to analysis made upon the visual information (pixels) contained in the image as seen in the green rectangle for visual features in Figure 2. The analysis done will be of two forms, color-based (HSV color moments) and texture-based (Gabor [1] and Tamura [2]) allowing to extract feature descriptors.
The feature vector used to define the visual features is formally defined as:
{ }
where each corresponds to a given feature space. 1.1.2 Keywords and concepts
The term keyword, in our work, corresponds to the linguistic representation of a concept. The scope of these concepts can be as diverse as sports, people or art. Concepts are considered high-level features because they require a considerable level of knowledge and perception to understand the reality captured in a multimedia document. In our work we will use the concepts presence as the semantics of the multimedia document. Concepts may not be explicitly present in the multimedia information of the document and methods are required to compute the likelihood that the concept is actually present in the multimedia document.
1.1.3 User tags
An image tag is a keyword assigned to a multimedia item by a user to describe the item. In Figure 2 an example of tags is shown in the “Tags” box in the textual features (purple rectangle). Tags are keywords inserted by users, and as such suffer from user subjectiveness therefore having variable truth-value and relevance. Although the problems from such subjectivity could be amplified in large multimedia datasets, research has shown [3] it’s common to obtain a consensus on the vocabulary used in tags on such datasets, even in the absence of a central controlled vocabulary.
term frequency. The filtering will reduce the number of words with low frequency in the tag space, thus reducing the long tail effect.
The set of resulting tags, also known as vocabulary, after the application of noise filters will be:
{ }
Where defines a lexicon of tags used to tag multimedia documents. With this vocabulary we can construct the tag feature vector as depicted below:
{ }
The vector represents the tag information of tags from the vocabulary , where each component indicates the presence of tag in the document d.
1.1.4 Annotations
An annotation in the context of multimedia is a keyword assigned to a multimedia item that describes it and is known to be truth (sometimes it is considered the ground-truth). An example of annotations in an image is shown in Figure 2 (blue rectangle). To describe the semantics of multimedia information we define the set
{ }
as a vocabulary of keywords which will be used as annotations. These keywords are linguistic representations of abstract or concrete concepts that we want to detect in multimedia documents. The vector is formally defined as:
[ ]
where each component contains the annotation confidence score concerning the presence of the corresponding concept in that particular document.
The semantic description of multimedia information, the vector , is the core topic of this thesis.
1.2 Motivation: Image annotation
Automated image annotation has a varied range of applicability, from detecting violent or lewd content to medical imaging. The main motivation behind this thesis is to enable automated annotation in consumer multimedia (photos). This is especially useful when integrated with a multimedia hosting solution or in a multimedia retrieval system to complement searches and categorize multimedia accordingly. The machine learning
algorithms used for automated annotation are varied and produce different outcomes depending on the data and used features. Because of this variety of methods and heterogeneity of features and data, further study is needed in this field. Challenges such as ImageCLEF-Photo Annotation (part of the CLEF4 challenges) promote the research and development of algorithms that can enhance the performance of automated image annotation. The photo annotation challenge is described as [4]:
“The visual concept and detection and annotation task is a multi-label classification challenge. It aims at the automatic annotation of a large number
of consumer photos with multiple annotations.”
Following this premise, ImageCLEF propose to solve the problem with one or more approaches that mainly vary on the features used for the automated annotation:
Automatic annotation with visual information only (low-level visual features)
Automatic annotation with Flickr user tags (mid-level features)
Multi-modal approaches considering visual information and/or Flickr user tags and/or EXIF information
Regardless of the approach used, the task remains the same: annotate the photos of the test set with a predefined set of annotations. These annotations indicate the concepts presence in the image. The concepts used are for example abstract categories like “Family & Friends” or “Partylife”, the time day (i.e. “day”, “night”) or Animals (i.e. dog, bird). For an example of these concepts see Table 1. This list of concepts illustrates how some of the concepts are rather abstracts such as “architecture” and “transport”, and others such as “baby”, can have multiple meanings depending on context. This means that at least a simple form of semantic treatment will have to be made.
General topic Subtopics
Sky Clouds
Water lake, river, sea
Animals dog, cat, bird, fish, horse, insect
Plants flowers, trees
People portrait, boy/man, girl/woman, baby
man-build structures architecture, building, house, city/urban, bridge, road/street
Table 1 - The ImageCLEF list of concepts.
The need for different approaches derives from the inherent variation of performance in machine learning algorithms for different features. A specific algorithm can provide good results with a set of features but may perform poorly when those features change. It is because of this that different approaches need to be tested, to discover the best pairs of algorithm/features for each approach or a pair that can maintain an optimal level of performance in all approaches. Each approach only differs in the features used.
We will use two datasets in our research, the MIR-Flickr [4] and NUS-WIDE [5] dataset which will be discussed in the next chapter.
1.3 Objective
The goal of automated image annotation is to provide the multimedia items (in this case images) with text annotations, and consequently concepts, enabling a better semantic description of the item. An enriched set of semantic annotations about the item, makes the task of searching for those items significantly more accurate (precision metric) and complete (recall metric).
The objective of this thesis is to study automated multimedia annotation algorithms, and propose a novel graph based framework to propagate tags among images and consequently annotate images regarding concept presence.
1.4 Proposed Framework
For this thesis a framework was developed to further study annotation algorithms with the various features available. This framework can be depicted in the following diagram:
Feature spaces: The framework allows the researcher to specify which features are used from the set of existing feature spaces. After a set of features have been chosen, this selection is passed to the machine learning algorithm.
Figure 3 - Base image annotation framework.
1.5 Organization
The chapters in this thesis were arranged to be as much self-contained as possible with novel contributions in chapter 4 and 5. The organization of this thesis is as follows:
Chapter 2 – reviews the state of the art in image annotation algorithms and background information in feature extraction.
Chapter 3 – describes the framework developed and the baseline image annotation algorithms used in the framework for each feature space with the accompanying results.
Chapter 4 – describes an analysis made on user tag model and the improvements made upon it.
Chapter 5 – describes the improvements made to the baseline algorithm using the results and lessons learned in the previous chapter to create a multi-feature iterative algorithm.
2
Related Work
2.1 Introduction
This chapter surveys the related work considered to this thesis and is divided in the following form:
First we discuss visual and textual feature spaces. Regarding textual features we elaborate on the nature of image tags, motivations for tagging and their relevance. The next section discusses visual features and their relevance. An introduction to machine learning based approaches to image annotation algorithms is made in the following section, particularly graph-based approaches relevant to this thesis. The final section of this chapter will present a summary of the image datasets and metrics used throughout this thesis.
2.2 Textual feature descriptors/Social media tags
Several research areas have their own definition of relevance giving more emphasis to their specific objectives – IR aims at finding documents that best answers an information need, i.e. the most relevant documents for a particular user query. Information retrieval relies on datasets of documents whose relevance for a given query was judged by a human. Unfortunately, there is no universal definition of what a relevant document is: the notion of a relevant document is diffuse because the same document can have different meanings to different humans. This has been discussed by several researchers that noticed discrepancies between relevance judgments made by different annotators, see [8] and [9]. These discrepancies are more visible in large multimedia collections for two reasons: (1) multimedia information is not as concrete as textual information, thus more open to different interpretations and relevance judgments (types of relevance); (2) assessing the relevance of documents is an expensive task involving humans during long periods of time, thus collections with a large number of documents are only partially annotated: relevance judgments are incomplete and inconsistent.
2.2.1 Motivation for tagging
Although the benefits of tagging in the information retrieval domain are immense, there isn’t a strong motivation for users to tag. Ames et al [10] explored motivations and incentives for tagging through the usage of photo tagging applications (e.g. ZoneTag. ESP game). In [10] it is hypothesized that multiple motivations are a determinant factor in users decision to annotate, especially social incentives. It is shown that incentives, such as point of capture tagging (tagging directly in the recorder devices) and tag suggestion improve significantly user motivation to tag.
2.2.2 Incomplete and inconsistent tagging
Another practical problem concerning relevance in very-large scale collections is the incompleteness and inconsistency of relevance judgments. In some situations the evaluation collection is so large that human assessors cannot judge all possible documents (incomplete relevance judgments), and sometimes different annotators give different relevance judgements to the same document (inconsistent relevance judgments). These trends have been extensively studied by Voorhees [8] and Buckley and Voorhees [11] who proposed a metric to reduce the effect of incomplete relevance judgments. More recently Aslam and Yilmaz, presented more stable metrics in [12, 13] to tackle the stability of measures under these conditions (incomplete and inconsistent relevance judgments).
and analyze the annotation efforts made by TRECVID participants that generated the relevance judgments of all training data for 39 concepts of the high-level feature extraction. To overcome the problems of incomplete and inconsistent relevance judgments the following rules were followed:
Assessors annotated a subset of the documents with a subset of the concepts; this avoids the bias caused by having the same person annotating all data with the same concept.
All documents must receive a relevance judgment from all annotators; this eliminates the problem of incomplete relevance judgments but increases inconsistency.
Documents and concepts were assigned to annotators so that some documents received more than one relevance judgment for the same concept; this eliminates the inconsistency problem if a voting scheme is used to decide between relevant and non-relevant.
We stress the fact that this annotation effort was done on training data that is usually much larger than test data. So, the same problems of incomplete and inconsistent relevance judgments exist when systems are evaluated. This large scale effort was highly valuable for two reasons: it produced high-quality annotations of training data; and it gave important information on how humans judge multimedia information for particular queries, see [14] for more details.
2.2.3 Types of relevance
Systems are evaluated on collections of documents that were manually annotated by human assessors. According to the information domain, different definitions of relevance are more adequate than others. We have identified three types of relevance that are valuable to evaluate multimedia information retrieval:
Binary relevance: under this model a document is either relevant or not. It makes the simple assumption that relevant documents contain the same amount of information value. This approximation results in robust systems that achieve similar accuracy across different query types, [15].
Ranked relevance: when documents are ordered according to a particular notion of similarity. An example of this type of relevance is when studying different image compression techniques users are asked to order compressed images by their quality in relation to the original.
The binary relevance model is a good reference to develop IR systems that serve a wide variety of non-specialized IR applications – the system is tuned with a set of relevance judgments that reflect the majority of human assessors’ judgments. Voorhees [16] has showed empirically that systems based on binary relevance judgments are more robust and stable than the ones based on multi-level relevance judgments. This happens because in the second case, systems use a fine-grain model to create a rank with N groups corresponding to the different level of relevance. The ranking algorithm has the task of placing each one of the M documents in the correct group of relevance level. It is easy to see that this task is much more difficult and tuning such algorithms will easily lead to an overfitting situation that is less general, and therefore less robust and stable [16].
The relevance judgments of the ranked relevance model are actually a rank of documents that exemplify the human perception of a particular type of similarity, e.g., texture, colour. The similarity function expressed by the rank is the ranking algorithm that is approximate. For this reason, these systems (and the evaluation metrics) are more stable and less prone to overfit than multi-level relevance systems. A disadvantage of this ranked relevance is the exponentially increasing cost of generating the ranked relevance judgments. 2.2.4 The category of a tag
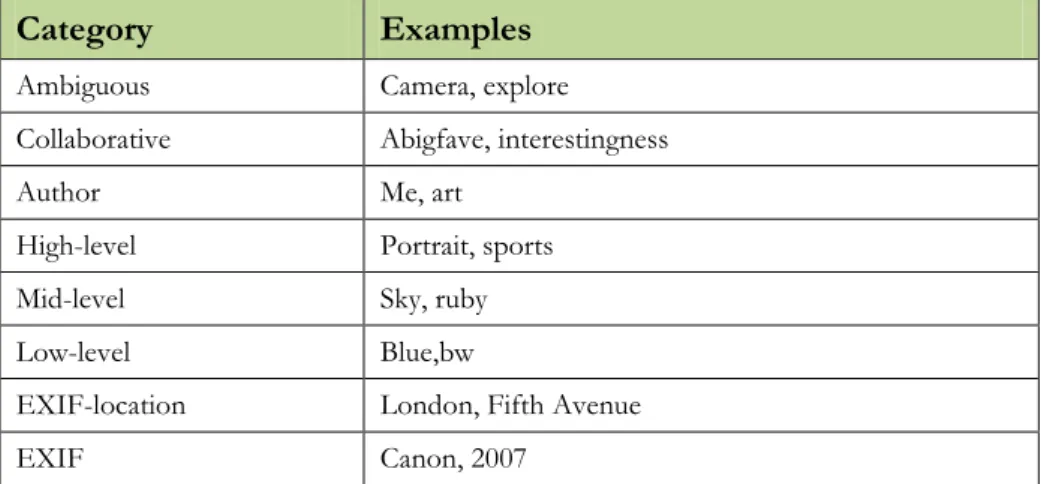
effort (i.e. a large group of users attributing the “interesting” tag to an image). A summary of tag patterns is shown in Table 2, where the taxonomy of tags is shown, exemplifying tagging behaviors. By understanding user tagging motivations we can better assess image tags relevance.
2.2.5 The subjectiveness of a tag
The subject of our study has a varied and complex nature. While it starts by being a simple keyword inserted by the user, according to his judgment, correctly defining a tag’s type needs a multitude of research domains ranging from natural language processing to computer vision. In Table 2 the tag type taxonomy used in this chapter is shown along with examples.
Category Examples
Ambiguous Camera, explore Collaborative Abigfave, interestingness
Author Me, art
High-level Portrait, sports
Mid-level Sky, ruby
Low-level Blue,bw
EXIF-location London, Fifth Avenue
EXIF Canon, 2007
Table 2 - Tag type taxonomy with examples.
Figure 4 - Distribution of tag type taxonomy in MIR-Flickr.
The tag type taxonomy used in this chapter is based on the following categories:
1) EXIF: Metadata embedded in the image related to the device used to capture the image. An example of this is the information regarding the maker and model of the camera; 10,4% 16,6% 4,6% 30,9% 13,1% 11,2% 5,8% 7,3%
0% 10% 20% 30% 40%
2) Geo-tag/EXIF-Location: Metadata available in certain devices that references a geographical location, usually where the photo was taken;
3) Low-level: pertains to the visual content of an image;
4) Mid-level: the most common features, including any generic keyword;
5) High-level: these correspond to the annotations, keywords with ground-truth certainty; 6) Author: these are directly related to the owner/user subjective assessment of the image; 7) Collaborative: these are related to the interpretation of a group of people, hence
collaborative;
8) Ambiguous: in this type of features there can be multiple interpretations of the keyword depending on the viewer and context. There can also exist an overlapping between other types of tags. Ambiguous can be very prominent in a dataset and take various forms as detailed by Weinberger et al [21]:
a) Semantic: the tag “bass” has two types of meanings;
b) Geographical: the tag “Cambridge” can correspond to two different places;
c) Temporal: the tag “worldcup” can correspond to multiple events (2006, 2010 for instance);
d) Language: the tag “mist” means dung in German and fog in English;
e) Generalization: while not being technically an ambiguity, the usage of a generalist tag can induce in error, the tag “Europe” for example can be overly common and won’t introduce relevant information to the annotation algorithm;
2.3 Image feature descriptors
2.3.1 Hue Saturation Value color histogram moments
Figure 5 - HSV color space.
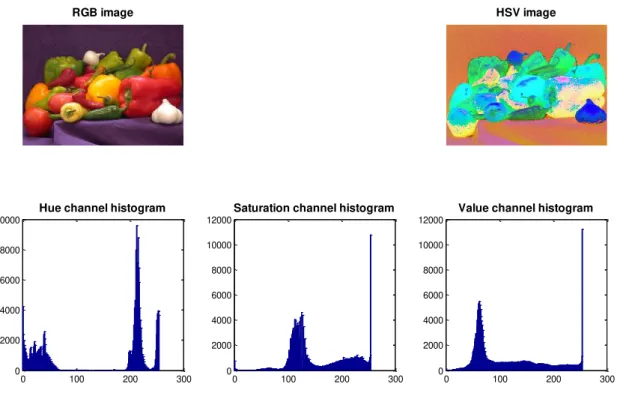
The dimensions of the HSV color space correspond to the Hue, Saturation and Value, depicted in Figure 5. If we consider each channel independently one can compute the marginal histograms. Figure 6 depicts an image in its original RGB format. When converted into the HSV color space and printed as an RGB picture one can visualize the color space transformation. The bottom graphs depict the histogram of each HSV dimension (Hue, Saturation and Value).
Figure 6 - Example of the “peppers.png” RGB image, the HSV image, and the marginal HSV color histograms.
Several descriptors can be computed from these histograms. Lower dimensional histograms can be computed, e.g., with 16 bins per histogram, and the moments of these histograms, e.g., mean, mode, variance. In this thesis we use the mean and the variance of
RGB image HSV image
0 100 200 300
0 2000 4000 6000 8000 10000
Hue channel histogram
0 100 200 300
0 2000 4000 6000 8000 10000 12000
Saturation channel histogram
0 100 200 300
0 2000 4000 6000 8000 10000 12000
each color channel. Moreover, we divide the image in 3 by 3 blocks, giving 9 regions per image and compute mean and the variance of the histogram of each HSV color space dimension. Thus, the HSV color feature vector is:
( )
which corresponds to 9 sub-images (3 by 3 tiles), 3 color channels (H, S and V) and 2 histogram moments (mean and variance), totaling 54 dimensions.
2.3.2 Tamura features
Cognitive vision experiments have been conducted by several scientists to understand how humans perceive textures. Based on a user experiment, Tamura et al. proposed the definition of six texture aspects that were commonly used by users to describe textures. These texture characteristics are coarseness, contrast, directionality, regularity or ruggedness. Users were then asked to rank a set of images according to their coarseness, then by their contrast, and so on. The resulting ranks for the top three characteristics are presented in Figure 7.
Figure 7 - Tamura features [19].
To emulate the human visual perception system, Tamura et al. proposed algorithms to reproduce these results. As a result these algorithms are now widely used to compute the coarseness, contrast and directionality characteristics of visual content.
( ).
2.3.3 Gabor filter moments
A texture can be seen as a combination of different edges at different orientations and scales. This principle is applied by the Gabor filters that scan the image with Gaussian filters to decompose the original image into several images representing the different edges of the original image. These computed images represent the edges at a scale and direction corresponding to the configuration of the Gabor filter, Figure 8.
Figure 8 - Plot of the Gabor filters in the frequency plane [1].
Figure 9 represents the result of the application (i.e. convolution) of Gabor filters with six different directions (0º, 30º, 60º, 90º, 120º and 150º) and four different scales over the original image. As the filter scales increase, the edges become coarser. Also, note that as the direction of the filter moves away from the horizontal plane (0º), the detected edges have a corresponding direction.
For the experiments in this thesis we compute the Gabor filter descriptors proposed by Manjunmath et. al [1]. The visual feature vector
( ),
Figure 9 - Gabor filters output.
2.4 Machine learning based annotation
Machine learning is the machine equivalent of human learning. Where the Human race learns from absorbing data from their surrounding and processing it, Machine learning is a computer science discipline that studies algorithms for machine knowledge learning based on empirical data.
The process of automated image annotation belongs to the domain of machine-learning classification algorithms. Although many methods have been used, there isn’t a perfect method for all types of data with varied features and data distributions. There are machine-learning methods that perform better with certain data that aren’t as good with other types of data. In this thesis we will focus in supervised and semi-supervised learning algorithms:
Supervised learning: This type of machine learning algorithms requires a set of annotated data to be used for annotation inference. From this set of data a
20 40 60 80 100 120 20
40
60
80
100
predictor function is estimated, in a phase that can be described as the learning phase. This predictor function will then be applied to the automated annotation of new un-annotated data.
Semi-supervised learning: This type of machine learning technique uses both annotated and un-annotated data for the training/learning phase. As opposed to the Supervised Learning it is not required to have a full set of annotated data, which could be time consuming to annotate, but rather a small portion of annotated data with enough distinctive features that can be used to compare with the un-annotated data.
2.5 Annotation algorithms
Our research will be based around non-parametric annotation algorithms. These types of image annotation algorithms don’t require a learning or training phase of the algorithm parameters. These types of algorithms, which are also known as lazy learners, use local prediction functions that are calculated whenever a new query is made about the annotation of a new image. As such they can handle a varied number of annotations, avoid overfitting of parameters, due to the local prediction, and require no learning or training phase which makes them a suitable candidate for dynamic data-sets of images. An example of this type of algorithm is the k-Nearest Neighbor algorithm.
2.5.1 Graph based Methods and Semantics
The usage of graphs to map images and features has become more commonly used recently due to its efficiency and scalability in solving machine learning problems and as such applicable in automated image annotation. These methods in conjunction with non-parametric annotation have the advantage of being domain independent and have generally a simple parameter tuning, which are strong points shared by general graph model method. The drawback of these methods is in the difficulty of differentiating between the relevance of different types of features/nodes in one graph.
2.5.2 Graph Modeling
Concept relationship can be modeled with graph-based methods by representing semantic relations using edges. Graphs can be modeled in two ways: directed graphical models and undirected graphical models. The major difference between those two types is the explicit imposition of concept causality in the Directed Graphical Models. In Figure 10 an example of undirected and directed graphs is given.
Figure 10 - Undirected (left) and directed graphs (right).
In [20] a study is conducted comparing these two types of graphs (directed and undirected) in a concept learning task. The authors in [20] present a comparison between those two types of graphical models that ascertain the potential of the undirected graphical models for the task of annotation that can detect similar semantic concepts. This conclusion is explained by avoiding the existing concept causality in directed graphs, therefore removing hidden dependencies in the graph and allowing for faster graph-model manipulation. 2.5.3 Learning with Local and Global Consistency
A vast amount of un-annotated data is available while annotated data is scarce, as such there is an added difficulty to be able to adapt algorithms to unbalanced data, which corresponds to never seen concepts or with few examples. Approaches that can combine small amounts of annotated data with un-annotated data and handle unbalanced amounts of annotated/un-annotated data can improve this problem – namely using semi-supervised learning. A further improvement on the k-NN algorithm that uses semi-supervised learning is developed on [19] where the key to its success is the prior assumption of consistency. This consistency is achieved in two parts:
Local consistency – where nearby points are likely to have the same annotation, which is a natural consequence of k-NN algorithms.
Global consistency - where points on the same structure (typically referred to as a cluster or a manifold) are likely to have the same annotation.
point, or image in our case, will iteratively spread its annotation information to its neighbors until a global stable state is achieved. One of the advantages of this algorithm is its adaptability to include new parameters, like semantic distances, which would lead to more interesting annotation propagation.
2.5.4 Nearest Spanning Chain
Either using directed or undirected graph models the possibility to map concept relationships is a clear advantage in graph-based methods. When dealing with different feature spaces new mechanisms are needed to deal with these differences. In [21] a method to support various feature spaces (visual and textual) is created to deal with feature correlation. This method requires the construction of an adaptive graph that can support the multi-modality of features and also map their similarities. With this graph the annotations are propagated using semantic similarities from WordNet [22] and low-level visual features. This adaptive graph is a modification of the k-Nearest Neighbor algorithm with the graph organized using a Minimum Spanning Tree in which the authors call it the Nearest Spanning Chain (NSC). The NSC has good performance when compared to other annotation algorithms in controlled image data sets like the Corel Photo Database although their performance declines with “real world” image data sets with the increase of annotation errors as seen in [21].
2.6 Evaluation methods
2.6.1 Datasets
To further explore user photo tags a reference dataset from which we can draw sufficiently large samples is required. There are many different datasets with specific characteristics. Professional Stock-Photos (such as the Corel Database) are made of photographs taken by professional photographers and as such with controlled camera settings. The NUS-Wide [5] or MIR-Flickr [4] dataset which are consumer photo datasets with varied photo settings. The MIR-Flickr [4] and the NUS-WIDE [5] datasets will be used for the quantitative analysis developed in this thesis.
photographs with a varied set of concepts between them. From this dataset the three previously mentioned feature descriptors (Gabor, Tamura, and Marginal HSV) were extracted to be used in our research. There are about 69,000 unique tags in the dataset and a cardinality of 9 tags per image. In Figure 11 the distribution between the various types is seen using a sample from the MIR-Flickr dataset
Figure 11 - Tag frequency distribution in MIR-Flickr dataset.
The second dataset used, NUS-Wide, contains 269,648 images retrieved from Flickr. Although a larger dataset, only 5018 unique tags are used throughout this dataset. Unlike the MIR-Flickr dataset, the tags have been given a slight treatment for tags that can be considered noise and there is a much lower cardinality of tags per image than MIR-Flickr. Annotations for 81 concepts are also provided for the entire dataset.
Since both datasets come from public repositories folksonomies are present with usage of a varied range of languages in user annotations (tags) and as such semantic problems like noise, varied synonyms or abbreviations need to be dealt accordingly. 2.6.2 Metrics
To conduct this study we will use the Precision and Recall metrics to assess the performance of the results:
Correct result (concept presence)
Concept not present Concept present
Obtained result
Tagged false positive true positive Not tagged true negative false negative
10 100 1000 10000 e x p
lore 2008 man
cl ou d ro ck v e rd e su b w
ay pet
k10d xt i li b rary bu rn in g… e as ter in d ian a ai r su rf to d d le r sav e 6 m e e tu p coo ki n g sk u ll tra
cks ma rice
The Accuracy metric will also be present in some cases, which measures the proportion of true results in the population, where a score of 100% will mean the predicted values are exactly the same as the expected values.
We will also use the F-measure (or F-score) metric which corresponds to the harmonic mean or weighted average of precision and recall. F-measure is given by the expression:
The final metric used will be the root mean square error which is defined by:
̂ √ ̂
The root mean square error or RMSE is used to quantify the difference between an estimator and the true value of the quantity being estimated. RMSE measures the root square average of the square of the error. The error is the amount by which the estimator differs from the quantity to be estimated.
2.7 Summary
In this chapter we have first researched the two types of feature spaces prominently used in this thesis, textual and visual features. Initially we discussed textual features, namely tag relevance as a central concept in information retrieval and its correlation with incomplete and inconsistent tagging that occurs in user tagging. We explored the nature of tags and tagging motivations and further researched how tags can be categorized, introducing the taxonomy of tags.
Research has also been made on the visual features used in this thesis (Gabor, Tamura and Marginal color moments), how they can be obtained and what information can extracted from them.
3
Feature-based image annotation
3.1 Introduction
Effective image annotation algorithms have to address the common problems found in machine learning classification tasks: namely overfitting and the need of a learning phase. To address these problems, non-parametric image annotation algorithms have become prominently used, in particular k-Nearest Neighbor algorithm (k-NN), Kernel density estimation (KDE) and other graph-based methods. The focus on this chapter will be on the k-NN algorithm, which is a non-parametric machine-learning annotation algorithm which will be used to annotate images based on the closest training examples. Given a set of images { } , each image represented in a common feature space, and an annotation set , the first l images are annotated with , i.e. the training set, and the remaining images are un-annotated, i.e. the test set. The goal is to predict the annotation of the un-annotated images, therefore performing image annotation. When a new image needs to be annotated an approximation function computes its k -nearest neighbors, where { }. This function is a majority voting performing binary annotations (in its naïve form) using its k nearest neighbors and is described by:
( )
∑
of . The choice of neighbors relies on the distance between the new image and its neighboring images in a given feature space. The k parameter determines how many neighbors will be used in that function. Choosing the best k parameter depends on the data, with larger values of k reducing the effect of noise in the image annotation algorithm, but making the boundaries between annotations less distinct. A choice for an optimal k value can be made using cross-validation to assert an optimal value for a given dataset.
This algorithm has an inherent graphical architecture with nodes and edges connecting the images with the surrounding neighbors which provides the possibility to establish a network of similar images or concepts. But as other machine learning algorithms it is not without disadvantages, namely the high variance in the presence of limited sampling, the inequality of importance between neighbors and being a computationally intensive algorithm.
An example of the k-NN annotation algorithm is given in the picture below:
Figure 12 - NN Annotation algorithm with varying k.
The green circle is the new image to be annotated, the blue squares and red triangles are images with two distinct annotations. The annotation procedure goes as follows:
If k =3 it means that we are in the inner circle defined by the third nearest neighbor. The neighborhood consists of two red triangles and one blue square, which by majority voting the new image belongs to the annotation of the red triangles.
This example illustrates two problems of the k-NN algorithm:
High variance: when in the presence of limited data, results exhibit a high-variance and sensitivity to the number of neighbors;
Neighbor distance: the importance of each neighbor isn’t proportional to its distance, for example for k=5 the new image belongs to the annotation of blue rectangles although the red triangles annotation is much closer to the new image. This chapter implements a baseline k-NN algorithm which will be used to evaluate several variations of the nearest-neighbor algorithm using the various feature spaces. The first section describes the image representation and the feature spaces that compose it. The following section discusses the improvements made to the baseline implementation. The remaining sections consist in the experimental results obtained from the baseline and improved k-NN implementations.
3.2 Image feature vectors
To apply the k-NN algorithm we need to describe the image features used to represent images. There are several feature spaces than can be used to describe an image but in this chapter we will only focus on two types, tag/textual based features and visual-based features. Images will be represented using a vector space model containing the feature vectors for each feature space. A commonality between the two types of image vectors is the presence of the image annotations. These are represented by the vector which contains annotation confidence scores. To describe the semantics of multimedia information we define the set
as a vocabulary of L keywords which will be used as annotations. These keywords are linguistic representations of abstract or concrete concepts that we want to detect in images. The vector is formally defined as:
[ ]
3.2.1 Text-based feature vector
Images will be represented by two text-based feature vectors: the feature vector containing the tags added by the users and describing the semantics of the image,
{ }.
The vector is usually a cleaned version of the user tags (spell-checked, stemmed etc.). In this case, for simple noise reduction we will only use tags with a cardinality of at least twenty, therefore discarding tags that don’t occur often in the image dataset. The set of tags, also known as vocabulary, will be:
{ }
Where defines a lexicon of N tags used to annotate images. With this vocabulary we can construct the tag feature vector formally defined as:
{ }
The vector represents the image tags, where each component indicates the presence or non-presence of tags in image d.
3.2.2 Visual-based feature vector
Previously we have explored textual features –unfortunately this type of information isn’t always present in images. Low-level visual features capture the most important information encoded in the different color pixels composing the image. From this data we can gather information about the image using various techniques. In this chapter we will represent images in two ways: feature descriptors concerning the visual part of the image, and concerning the semantics of the image,
The feature vector is formally defined as:
{ }
where each corresponds to a given feature space. Three types of features will be computed from the images, two texture-based features (Gabor and Tamura) and one color based (HSV color moments). Thus, we shall have:
( ), for the HSV color moment descriptor, a n-dimensional vector;
( ), for the Tamura texture descriptor, a p-dimensional vector.
3.3 A k-NN framework
In this section we describe the implementation of a baseline k-NN algorithm. This is a non-parametric annotation algorithm that unlike others (Support Vector Machines) doesn’t require a learning phase. This algorithm maintains in memory all the images and associated features, and when a new image requires annotation a new local approximation function is created according to the most similar neighbor images found.
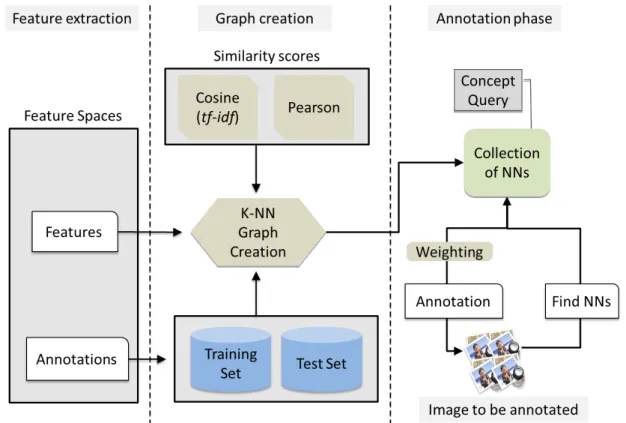
We first established a baseline implementation using textual features. This baseline implementation was used to discover the optimal similarity score to be used in the k-NN framework. Below a diagram depicting the annotation workflow of the k-NN implementation is shown:
Figure 13 - k-Nearest Neighbor Annotation workflow.
The workflow is divided in three sections:
Graph creation: the similarity scores between each test image and all training images are computed. Only the k nearest images are stored. The similarity scores are computed through the image tags.
Annotation phase: where each image from the test set is annotated by an approximation function that uses its k nearest neighbors to vote for the presence of the concept to be annotated.
3.3.1 Similarity scores
One of the most important elements in the k-NN algorithm is the similarity score or distance used to find the nearest neighbors. This is a simple calculation used to discover the distance between two images and corresponds to the human notion of distance between two points in space.
In the case of two images, the Euclidean distance is given by the square root of the sum of the square of the difference between the each dimension of two feature vectors. Given two images with their feature vectors and where or is equal to the dimension i of the image, the Euclidean distance is given by:
√∑
This distance is mostly applicable to continuous variables, and performs worse than other distances when the data isn’t well normalized or with an uneven distribution.
Other similarity scores yield better results in information retrieval, in particular the Pearson correlation and its variant, the Cosine similarity. These two distance metrics are invariant to scaling, and the Pearson correlation is also invariant to the addition of constants to its elements, disregarding the absolute value of the points being compared. The Pearson correlation is given by:
√∑ √∑
The cosine similarity is a specific case of the Pearson correlation where the similarity between two vectors corresponds to the angle defined by them. The Cosine similarity is given by:
These distances functions are used to search for the k-Nearest Neighbor of each vector. The result will be an undirected graph connecting each image to its neighbor using the distance functions.
3.3.2 Term weighting
Search engines commonly use term weighting to select the most relevant terms of a given document. Term weighting techniques allows giving emphasis to relevant terms. One of the most effective weighting technique is the term frequency-inverse document frequency (tf-idf) weighting. This technique gives more emphasis on terms that have a high frequency in the document but a low frequency throughout the dataset, which tends to make the weights significantly smaller on common terms. The tf-idf weighting is given by the expression:
∑
| | |{ }|
The weighting is composed by two parts, first the term frequency where a keyword importance increases proportionally with the number of times the same keyword appears in the document. And the second part, the inverse document frequency, which measures the frequency of the keyword in the collection of documents or images (it assesses how rare a keyword is).
This weighting is commonly used together with the cosine similarity in vector space models to determine the similarity between two documents. The cosine similarity yields results very close to the Pearson correlation, thus, allowing a viable alternative when used in conjunction with tf-idf weighting. Another advantage comes from using this improvement with the linguistic expansion and correction. Upon expanding the keywords of an image (in this case the user tags), and if duplicate keywords are added through linguistic expansion, a higher term frequency will occur for the given duplicate keyword. Therefore it will distinguish the importance of the keyword in the image and appropriately uses its new weight to calculate the similarity to other images.
3.3.3 Neighbors weighting
differentiate images according to the distance of the “voters” to the new data. Thus we will introduce the notion of weighted mean instead of simple voting:
This formula is a weighed mean composed by the weight of the neighbor, calculated according to the Gaussian function, which will be explained below, and the value for the neighbor (if it contains the annotation or not).
We will convert the distance to weight according to the distance to the image being annotated. The function used to convert distance to weight is the Gaussian function:
The weight in this function is maximum (the value 1) when the distance is 0, declining as the distance increases, although it never reaches zero, allowing to always make a prediction. The standard deviation, , parameter can take various values each one slightly modifying the shape of the Gaussian function.
A new heuristic will be used to calculate the optimal value of the standard deviation. This new heuristic relies on the k parameter, averaging the distance from all the worse nearest neighbors from the test set. It has the advantage of being dynamically adjusted according to the data. The heuristic is given by the expression:
√∑
The corresponds to the distance of the worst nearest neighbor for a given image from the test set.
3.3.4 Parameter estimation by cross validation
3.4 Tag-based image annotation
3.4.1 Experiment protocol and data
In this section we have performed a series of experiments to establish a baseline k-NN annotation algorithm. Tests were performed using all annotations (24 concepts) from the MIR-Flickr. We have two types of experiment protocols:
Cross-validation protocol: used to determine the best parameter/similarity score as in the case of choosing the similarity score and the best standard deviation parameter for neighbor weighting. For our cross-validation tests we randomly select a group of 10,000 images from the MIR-Flickr dataset, from which we will use 10% as the test data. This process is repeated 10 times to avoid bias. Only textual features were used in our cross-validation tests.
Annotation protocol: used to execute the automated annotation k-NN algorithm. For the annotation protocol we have chosen 20,000 images and their features (which vary in each section) from the image dataset from which 5% will be used as test data and the remainder as training set.
3.4.2 Similarity Scores
We compared the performance of different similarity scores on a baseline implementation of the k-NN algorithm using the cross-validation protocol on textual features. Test results were assessed using the root mean square error for the three distances with a varying number of neighbors (the k parameter). In Figure 14 we can see the results for the various similarity scores using the varying k parameter.
Figure 14 - RMSE from the various similarity scores with a varying k.
0 20 40 60 80 100 120
1 5 9 13 17 21 31 51 65 85 105
K
Pearson
Cosine
A closer analysis with k = 3 is detailed in the table below:
Distance Precision Recall Accuracy RMSE
Euclidean 27.96% 22.59% 78.82% 95.80
Pearson 55.23% 35.53% 85.43% 62.49
Cosine 54.12% 36.48% 85.25% 62.89
Table 3 - k-NN annotation algorithm with k=3.
The conclusions from the cross-validation are two-fold:
1. Experiments showed that the optimal number of neighbors is in the interval [ ] for the Pearson and Cosine similarity scores. Another conclusion that can be drawn from Figure 14 is that as k increases all similarity scores tend to converge. This can be explained by the occurrence of an increasingly higher number of k neighbors which decreases the number of relevant neighbors, thus over-generalizing the annotation algorithm.
2. Second, as Figure 14 shows, the Pearson and Cosine distances obtain significantly better results when compared to the Euclidean distance. Based on the presented results we have chosen the Pearson correlation distance for most of the work developed throughout this thesis.
3.4.3 Term weighing
The figure below shows tests made with the baseline k-NN implementation with the Pearson similarity score versus the k-NN baseline implementation with the Cosine and tf-idf addition. The tests were conducted with the annotation protocol described previously using only textual features.
Figure 15 - Baseline Pearson implementation versus Cosine tf-idf.
0% 10% 20% 30% 40% 50% 60% 70% 80% 90% 100%
1 3 5 7 9 11 13 15 17 19 21
K
Precision
Precision TFIDF
Recall
From the analysis of the chart we can conclude that the usage of the Cosine similarity score with tf-idf yields better results. A major leap in performance occurs in precision while recall only improves marginally over the baseline implementation. We can infer the validity of this improvement.
Further study could be conducted to assess the performance with each individual annotation.
3.4.4 Neighbors weighting
To validate the correctness of this heuristic a simpler cross-validation was made to obtain the optimal standard deviation (sigma parameter) for a fixed dataset which closely matches the values obtained by the new heuristic. For this test we used the cross-validation protocol described previously with textual features and the Pearson correlation as similarity score. Figure 16 depicts this validation where the sigma obtained by the heuristic is compared with other sigma values throughout a varying k.
Figure 16 - RMSE with sigma comparison.
We can infer from the chart that the dynamic sigma obtained by the heuristic performs better than a fixed value for sigma, therefore this heuristic is valid and can yield good results. After estimating the sigma parameter further experimentation was made to explore the results of the weighted nearest neighbors’ implementation versus the baseline using the annotation protocol (with textual features Pearson correlation). This comparison is depicted in the figure below:
0 10 20 30 40 50 60 70 80 90
1 3 5 7 9 11 13 15 17 19 21
K
Heuristic Sigma
Sigma = 0.1
Figure 17 - Comparison baseline versus weighted k-NN.
From this chart we can conclude that precision is better in the baseline implementation when compared to the weighted implementation. Regarding recall, the weighted algorithm results in a slightly better recall mitigating the low recall usually associated with human annotation. In theory the weighted neighbor improvement should yield better results, across all metrics, because it solves the problem of attributing the same weight to neighbors that can be at different distances. In practice, and given the amount of noise in our image dataset, it is normal to expect lower precision rates as the weight importance of the nearer neighbors is augmented which could lead to more false positives with noisy data.
3.4.5 Discussion
As seen in the previous tests, the improvements made to the baseline k-NN implementation can contribute to a higher performance annotation algorithm and solve some of the problems the naïve version of k-NN has. We offer a comparison of these implementations below using the results previously obtained:
0% 10% 20% 30% 40% 50% 60% 70% 80%
1 3 5 7 9 11 13 15 17 19 21
K
Precision
Precision Weighted
Recall
Figure 18 - k-NN comparison of improvements.
In regards to precision we can clearly see an advantage in using the term frequency over the remainder alternatives. In terms of recall the difference between the implementations is less distinct despite showing the baseline implementation having the worst recall. Further testing might find a mixture of the improvements yielding better results than the individual parameter tuning.
3.5 Visual-based image annotation
3.5.1 HSV Color moments
In this section we explored a k-NN implementation using the marginal HSV visual feature where our goal was to establish a baseline result for this feature descriptor. We performed this experiment using the annotation protocol with the baseline k-NN implementation and the Pearson correlation as the similarity score. For further comparison we added a k-NN implementation that randomly annotates images. Below are the results for this experiment:
0% 10% 20% 30% 40% 50% 60% 70% 80% 90% 100%
1 3 5 7 9 11 13 15 17 19 21
K
Precision
Precision Weighted
Precision TFIDF
Recall
Recall Weighted


![Figure 7 - Tamura features [19].](https://thumb-eu.123doks.com/thumbv2/123dok_br/16527471.736045/28.892.179.663.563.869/figure-tamura-features.webp)