Autor Responsável: Kalinny Patrícia Vaz Lafayette Data de envio: 21/06/2017 Data de aceite: 03/10/2017
10.1590/S1517-707620180003.0503
Analysis of generation and characterization
of construction and demolition waste on
construction sites in the city of
Recife, Brazil
Kalinny Patrícia Vaz Lafayette 1, Diogo Henrique Fernandes da Paz 2, Maria Júlia de Oliveira Holanda 1, Luiz Augusto Ramos de Castro Costa1
1 Escola Politécnica, Universidade de Pernambuco – UPE, CEP: 50720-001, Recife, Pernambuco, Brasil. 2 Universidade Federal de Pernambuco – UFPE, CEP: 50740-530, Recife, Pernambuco, Brasil.
e-mail: [email protected], [email protected], [email protected], [email protected]
ABSTRACT
In order to planning the Construction and Demolition Waste (CDW) management approach on a construction site, it is necessary to have a prior knowledge of what is being generated (qualitative analysis), the quantity that is being generated (quantitative analysis), and what is the proper final destination assigned to this material. This article proposes a new method to estimate CDW generation in Brazil from a qualitative and quantitative analysis of CDW generation in worksites. For the waste characterization, it was used the compression test with energy of Standard Proctor Test, granulometric analysis, microstructure analysis and direct shear tests. For the quantitative data collection, the research was limited to worksites of residential or commercial multi-story buildings, with reinforced concrete structure, which is the most common type used in Brazil. The data on the number of waste bins removed monthly, transportation and final disposal, CDW management costs, and constructive process were obtained from the construction companies.
Keywords: civil construction, waste management, characterization.
1. INTRODUCTION
The civil construction industry has a significant contribution to the development of the economies in countries, especially the considerable amount of jobs created and the direct influence in all sectors that produce raw materials, equipment, and services to supply the production process.
Despite the current state of decline of this activity in some countries, due to changes in the economic cycle, the problems caused by such waste, or rather by its management, must be constantly considered [1]. Construction and Demolition Waste (CDW) is a major problem in urban areas [1-4]. This is due to the substantial waste generation by construction companies, which improperly dispose the CDW, despite 90% of it being reusable, causing many economic, social, and environmental problems.
In Brazil, civil construction accounts for about 14% of Gross Domestic Product (GDP), making it one of the pillars of Brazilian economy and the largest generator of direct and indirect jobs in the country. The sector is also one of the largest consumers of natural raw materials, responsible for about 20% to 50% of natural resources consumed by society [5].
In recent years, there has been a significant increase in CDW generation because of the rapid urbanization and large-scale construction activities in Brazil [6, 7], accompanied by instability and/or unavailability of data and information on the waste generated in this activity. The study of CDW generation and effects is recent in Brazil [8] leading to a lack of data in agencies and environmental organizations. However, the emergence of legislation regarding this sector has encouraged developments and a greater mobilization of city councils and private companies to meet the new laws in force.
Waste reduction is considered the most effective method for minimizing the production of CDW and eliminates many of the environmental problems. However, CDW generation is inevitable and thus reuse and recycling are optional applicable methods for reducing the volume that reaches the landfill [9, 10].
construction sites to maintain constant the waste management system and the possibility to improve continuously. This causes an increased management cost and a reduced environmental performance of the company [11, 12].
To plan CDW management on the construction site, it is required a prior knowledge of what is being generated (qualitative data), the quantity that is being generated (quantitative data), and what is the proper final destination to assigned to this material. Although there is research being conducted to make the characterization of this waste, a reliable database that grants subsidies to companies in decision-making related to the management of CDW is still to be developed.
In this context, several studies are conducted to develop methods for estimating the amount of CDW in a worksite or in a city [13]. An estimate of CDW generation in Thailand was made using information on building permits issued, obtaining rates of 21.38 kg/m² for residential construction and 18.99 kg/m² for non-residential construction [14].
Sáez et al. [1] developed an empirical model to predict waste generation on the construction site by creation several indicators relating to the volume of waste generated (m³) and the total constructed area of the building (m²): the total quantity of CDW generated in the worksite, types of CDW, and the quantity of CDW generated at different stages of the worksite. The usage of two accurate indicators, along with a global indicator commonly in use, provides a significant improvement in tools for waste quantification, management, and planning.
A methodology was developed to provide a model that foresees the flow of CDW for new residential buildings. The quantity of waste and its components, produced in 10 large scale projects (7,000 - 32,000 m² of constructed area), was periodically monitored for a limited time. The developed model foresees that waste is generated exponentially, i.e.., smaller quantities are generated during the early stages of construction and larger quantities are generated by the end of the project. The total quantity of waste was estimated at 0.2 m³/m² of usable area [15].
More recently, Mália et al. [16] determined indicators that allowed estimating CDW generation at a worksite, both globally and by waste flow. The CDW generation is estimated for six specific sectors: new residential construction; new non-residential construction; residential demolition; non-residential demolition; residential remodeling; and non-residential remodeling. The data required to develop these indicators were found in previous studies in literature.
This article proposes a new method to estimate CDW generation in Brazil from a qualitative and quantitative analysis of CDW generation in worksites.
2. MATERIALS AND METHODS
2.1 Qualitative data collection
CDW samples were collected in worksites that were at different construction phases for testing. Projeto Entulho Limpo (Clean Waste Project), was directly involved in the project, guided by the Group of Engineering Applied to the Environment (AMBITEC), from the Polytechnic School of Pernambuco. It was possible to distinguish the stages of structure (Sample A), masonry (Sample B), finishing (Sample C), and demolition (Sample D). The samples were directly obtained from waste bins in worksites and sent to the Soil Mechanics Laboratory for gravimetric composition and processing by crushing, so that there would be a reduction in the size of the grains to diameters equal to or less than 4,75mm.
In this context, the Brazilian Association of Technical Standards (ABNT) codes were followed for the tests, as there are no specific rules for CDW. The codes used for the characterization tests were the following: NBR 6508 [17]; NBR 6459 [18]; NBR 7180 [19] e NBR 6457 [20]. The compression tests with energy of Standard Proctor Test were performed in accordance with NBR 7182 [21]. The CDW granulometric analysis was performed after completion of compression with the purpose of verifying any change in CDW particle size.
used. The shear tests were performed with samples A (Structure), B (Masonry), C (Finishing), and D (Demolition).
2.2 Quantitative data collection
During the collection of quantitative data on construction sites, a letter was sent to construction companies requesting their participation in the development of research and data availability of waste generation for each worksite, with the intention of correlating the levels of waste generation with technical data. The research was limited to worksites of residential or commercial multi-story buildings, with reinforced concrete structure, which is the most common type in Brazil. The data on the number of waste bins removed monthly, transportation and final disposal, CDW management costs, and constructive process were obtained from the construction companies.
As a result, data were obtained from 74 worksites. However, only 28 worksites presented a complete database of waste generation throughout the execution of the work (foundation + structure1 + finishing). Most of the works analyzed are still at construction stage or, in the case of the older ones, do not have complete and reliable records of waste generation. The greatest number of works was at the structure stage (84% overall). As most of the works are still in progress, the amount of data in finishing stage was considered low (61%).Companies did not provide quantitative demolition data.
The total number of waste bins needed to collect all the waste from a worksite was determined from the total waste generation, considering they are able to carry a volume of 6m³ and have unitary mass of 1.30 t/m³ [23,24,25,26], defined from the result of several surveys conducted in Brazil.In addition, percentage of waste per class was estimated from the accounts of the waste generated in accordanceto the National Council of Environment (CONAMA) resolution nº 307/2002. A comparison was made between the total waste generation from construction companies that were granted an ISO 14001 certification and construction companies that were not, to analyze the influence of the Environmental Management System in waste generation.
After identifying the number of waste bins, correlations were made between the total CDW generation and the constructed area, time of completion of the work, and the number of floors, to obtain indicators of waste generation.
Furthermore, to determine management costs, expenses related to transportation and final disposal of waste were considered. Expenses related to consulting, equipment purchasing, and others were not included.
3. RESULTS AND DISCUSSIONS
3.1 Qualitative data
3.1.1 Gravimetric composition of CDW samples
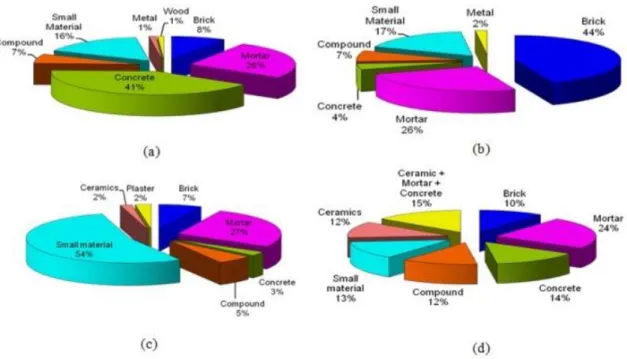
The gravimetric distribution of the samples contributed to obtaining the percentages of the constituents of each of the samples A, B, C and D, which are of structure, masonry, finishing and demolition, respectively, as shown in Figure 1.
Figure 1: Gravimetric composition of the constituents of Samples: (a) Structure; (b) masonry, (c) finishing and (d) demolition.
Materials most found in each sample were: concrete in Sample A (structure), at 42%; brick in Sample B (masonry), at 44%; small materials2 (54%) and mortar (27%) in sample C (finishing); and mortar in Sample D (demolition), at 25%.
3.1.2. Physical and chemical characterization
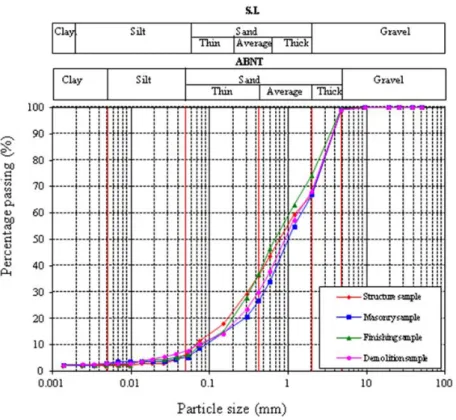
The pH analysis of CDW samples at different phases (structure, masonry, finishing and demolition) obtained a range of 7.3 – 12.4, and the median value at 10.1. This result confirmed that the aqueous extract of CDW is alkaline, due to the presence of lime and cement in its composition. In previous researches, a similar result was found for soil composites using CDW applied in roads sealing [22]. Granulometric curves (Figure 2) show that mainly granular (gravely) materials, with small quantities of silt and clay, compose the CDW samples studied.
Figure 2: Granulometric curves of CDW samples.
The values of the particles relative densities were 2.68 for sample A, 2.64 for samples B and C, and 2.63 for the sample D, which indicate a typically gravely material. This reason justifies that the CDW samples did not present liquid nor plastic limits.
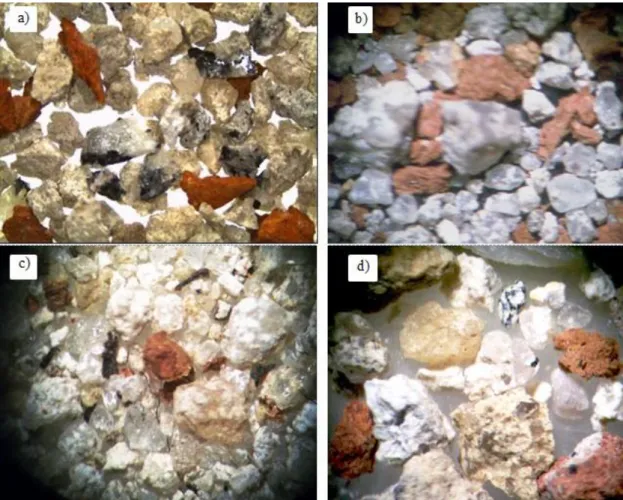
3.1.3. Mineralogical analysis
Figure 3: Mineralogical analysis: (a) Sample A – Structure; (b) Sample B – Masonry; (c) Sample C – Finishing; (d) Sample D - Demolition.
3.1.4 Compression test
The compression curves were obtained from the Standard Proctor energy used in each of the samples. Figure 4 shows the curves and Table 1 shows the results obtained in the compression tests.
Table 1: Values obtained in compression tests.
Sample Wot (%) dmáx (g/cm3)
A 14 1.75
B 21 1.64
C 15 1.63
D 21 1.57
Values referenced in Table 2 were responsible for shaping the samples for direct shear test, which will be discussed later.
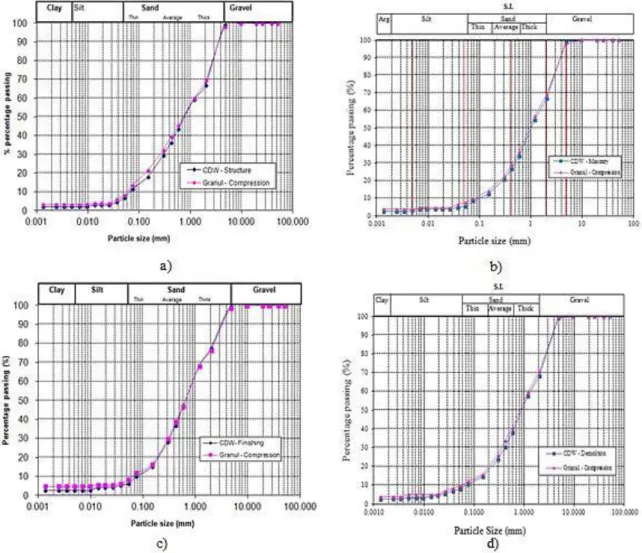
Granulometric curves obtained after the compression test were compared to curves obtained prior to the compression process, and an insignificant change in the particle size of the materials was observed, as shown in Figure 5. These behaviors are due to the many steps that CDW passes during the production process, such as: generation, transportation, and disposal in testing areas [30, 31].
Figure 5: Results of particle size: (a) Sample A – Structure; (b) Sample B – Masonry; (c) Sample C – Finishing; (d) Sample D - Demolition.
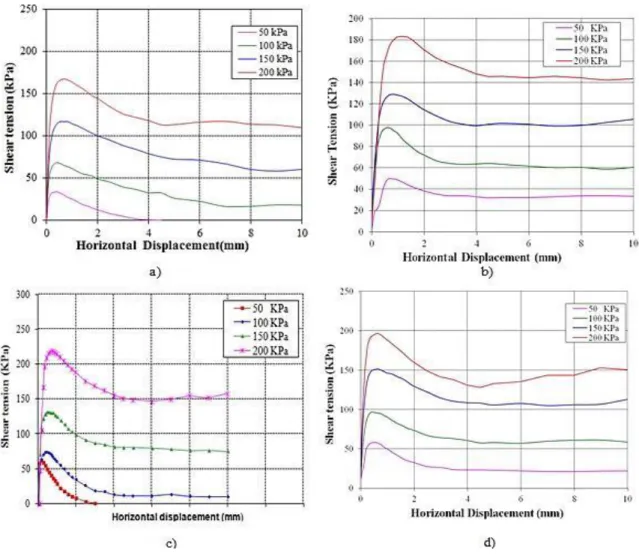
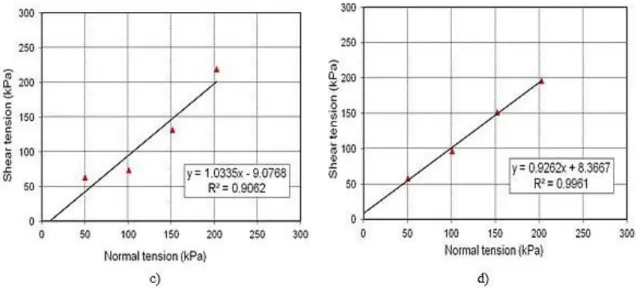
Figure 7: Envelopes of resistance: (a) Sample A – Structure; (b) Sample B – Masonry; (c) Sample C – Finishing; (d) Sample D - Demolition.
3.2 Quantitative data
The worksites were monitored from August to November, 2013. Table 2 presents a summary of monitored worksites along with data on constructed area, duration of work, and number of floors.
From the worksites analyzed, it was found that the total waste generation is between 484 tons and 8298 tons, and a mean value of 1,304 tons. Figure 8 shows three sets of data, which relate the amount of waste generated with the constructed area, with the number of floors and with the duration of the work in months, separately.
Therefore, it was obtained a mean rate of CDW generation by constructed area of 125 kg/m², for a total constructed area of 22,232 m², within the range estimated by GUSMÃO [31], which varies from 100 kg/m² to 150 kg/m².
Table 2: Characterization of the worksites visited.
Site Constructed area (m2) Nr. of floors Duration of work (months)
1 3,379 19 28
2 6,226 20 43
3 6,861 18 28
4 7,099 16 36
5 7,706 22 28
6 7,886 22 31
7 9,213 20 30
8 10,072 29 23
9 10,216 28 21
10 10,230 17 36
11 10,526 32 31
12 12,023 29 29
13 12,630 36 45
14 13,439 30 21
15 14,062 28 54
16 15,220 32 32
17 17,213 20 28
Figure 8: CDW generation in relation to constructed area, duration of the work and number of floors.
In addition to this indicator, which is the most used to estimate waste generation, it was obtained the average index of CDW generation by completion of the worksite, at 70.03 t/month, for an average completion of works in 34 months.
Furthermore, an average index of CDW generation by number of floors of 63.68 t/floor was obtained, for an average of 31 floors in worksites of Recife. The choice of the best indicator to be used will depend on its application and comparison with several other worksites.
In CDW management planning, it is essential to know in which extent each stage of work generates waste, as well as the type of material that is disposed of the most, in order to be able to plan the structure of the worksite. Figure 9 shows the CDW generation per stage of the work, considering the 28 worksites with a complete database. Figure 10 displays the percentage of CDW generation in each phase.
Figure 9: Waste Generation per stage of work. 0,0 0,1 1,0 10,0 100,0 1000,0
1 2 3 4 5 6 7 8 9 10111213141516171819202122232425262728
CDW g e n e ration ( t) Sites t/area (m2) t/pavement t/month 0 2000 4000 6000 8000 10000
1 2 3 4 5 6 7 8 9 10 11 12 13 14 15 16 17 18 19 20 21 22 23 24 25 26 27 28
Was te g e n e ration (t ) Sites
CDW Generation (tons) - FOUNDATION
CDW generation (tons) - STRUCTURE
CDW generation - FINISHING
Waste generation (tons)
19 19,370 34 46
Figure 10: Percentage of CDW generation per stage of work.
Considering the data from other worksites, it was obtained the following mean rates of generation per stage of construction: 17.20 t/month during the foundation stage, with an average duration of 6
months; 45.86 t/month during the structure (including masonry) stage, with an average duration of 11
months, and 107.93 t/month during the finishing stage, with an average duration of 15 months.
Figure 11 shows the costs of class A CDW management of 28 worksites with a complete database. The total cost for the transportation and disposal of CDW varies from R$ 28,000.00 to R$ 485,000.00, depending on the amount of waste bins collected and the final destination. For this calculation, only the steps of transportation and final disposal were considered. Other expenses, such as the purchase of new materials due to losses in the process, could not be included due to the difficulty of measurement.
Figure 11: CDW management costs in the worksites.
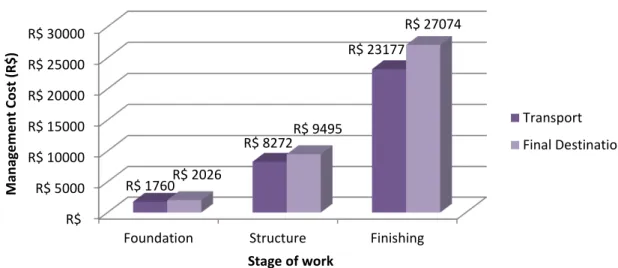
Along with data from other works, was calculated the average cost of CDW management by phase of work was calculated, using as a reference the average amount of collected waste bins and destinated at each construction phase, as presented in Figure 12.
The average cost per m² varies from R$ 1.63/m² to 14.17 R$/m², being the highest the cost of works of built area smaller than 8,000 m² (R$ 11.27/m²). Furthermore, worksites certified with ISO 14.001 have an average cost of R$ 6.64/m², while the worksites without certification have an average cost of R$12.49/m².
Foundation 4% Structure 22% Finishing 74% 0 50000 100000 150000 200000 250000 300000 350000 400000 450000 500000
1 2 3 4 5 6 7 8 9 10 11 12 13 14 15 16 17 18 19 20 21 22 23 24 25 26 27 28
Figure 12: Cost of CDW management per stage of work.
3.3 Model for estimating waste generation
The first step to estimate waste generation of a worksite is the calculation of the total CDW generation during the construction stage, where the manager can perform a calculation based on constructed area (m²), duration of work (months), or number of floors. The manager‟s decision will depend on the previous estimates in relation to the rate that best fits the worksites of the company. All parameters used in the model were obtained in the quantitative characterization, and the definition of constructed area ranges were defined using statistical analysis.
The calculation of the total waste generation by total constructed area is given by Equation 1:
(1)
Where: Gt is the total waste generation of the worksite (t)
Ia is the rate of waste generation by constructed area (kg/m²)
At is the total constructed area (m²)
To choose the rate of CDW generation by construction area, it is considered that: If At ≤ 8,000m², then Ia= 194 kg/m²;
If 8,000m²< At ≤ 15,000m², then Ia = 94 kg/m²; If 15,000m² < At ≤ 25,000m², then Ia = 66 kg/m²; If At > 25,000m², then Ia= 117 kg/m².
The calculation of the total waste generation by the time of completion of works is given by Equation 2.
(2) Where: ID is the rate of waste generation by time of completion of works (t/month);
Pc is the construction period of the project (months).
It is considered that:
If Pc ≤ 30, then ID = 68 t/month; If 30 < Pc ≤ 35, then ID = 73 t/month; If 35 < Pc ≤ 40, then ID = 112 t/month; If Pc > 40, then ID = 21 t/month.
The calculation of the total waste generation by number of floors is determined by Equation 3. R$ R$ 5000 R$ 10000 R$ 15000 R$ 20000 R$ 25000 R$ 30000
Foundation Structure Finishing R$ 1760 R$ 8272 R$ 23177 R$ 2026 R$ 9495 R$ 27074 M anag em en t Cost (R$)
Stage of work
Transport
(3) Where: Ip is the rate of waste generation by the number of floors (t/floor);
Np is the number of floors.
It is considered that:
If Np ≤ 25, then Ip= 74 t/floor; If 25 < Np ≤ 30, then Ip = 52 t/floor; If 30 < Np ≤ 40, then Ip = 29 t/floor; If Np > 40, then Ip= 88 t/floor.
For the calculation of daily waste generation of the worksite, Equation 4 is used.
Gd = (Gt/Pc) / 26 (4) Where: Gd is the daily waste generation of the worksite (t/day)
After determining the total waste generation, the number of waste bins needed to collect all waste generated is calculated using Equation 5.
(5) Where: Nc is the number of waste bins needed to collect all the waste of the worksite.
Cc is the waste bin capacity = 8.2 t
After estimating the total waste generation in the worksite, it is possible to calculate the quantity of waste per class according to the CONAMA Resolution Nº 307/2002. The percentage of waste of each class used in the database of the system was based on the data obtained in this study and in previous studies [29, 30]. Thus, the calculation of waste generation by class is performed as presented in Equation 6:
(6)
Where: Qcx is the quantity of waste generated by class X (t),
Pcx is the percentage of waste of class X (%).
The percentage of waste of each stage of the work is obtained from Equations 7, 8, and 9.
(7) (8) (9) Where: Gt is the total waste generation (t);
Qfoun is the quantity of waste during the foundation stage (t);
Pfoun is the percentage of waste during the foundation stage (%);
Qstru is the quantity of waste during the structure stage (t);
Pstru is the percentage of waste during the structure stage (%);
Qfini is quantity of waste during the finishing stage (t);
Pfini is the percentage of waste during the finishing stage (%).
The system also provides, for each material, the amount (in tons) that will be generated throughout the work, from the gravimetric composition, as presented in Equation 10.
(10) Where: QMATy is the quantity of waste regarding material (Y);
4. CONCLUSIONS
By analyzing the results of the qualitative data, it can conclude that the physical and chemical characteristics of CDW contributed to classifying it as a typically gravely material. Furthermore, through the mineralogical analysis, it was observed that the contribution of the sample grains is made up of poorly selected and sub-rounded grains, in which quartz predominates.
The compression test was essential for molding the specimens for direct shear testing, from the optimum humidity found in each sample.
Despite the difficulty in obtaining data on waste generation in the worksites, a database with appropriate information for the correct development of the model has been created, making it possible to comprehend the main characteristics of the waste management of the worksites, such as: total CDW generation; generation by stage of work (foundation, structure and finishing); CDW generation in relation to constructed area, time of completion, and number of floors; CDW generation by class, according to Resolution Nº 307/2002 of CONAMA, and waste management costs.
By analyzing the worksites that had a complete database, that is, data of waste generation from the foundation stage to its conclusion, was obtained an average value of 1.304 tons, and a rate of generation by constructed area of 125 kg/m², for an average constructed area of 22,232 m². When comparing this information with data from literature [31; 34-37], was found that it is very similar to the data obtained by the researchers mentioned.
Considering that some researchers and construction companies question the efficiency the CDW generation rate by constructed area, were evaluated other rates, such as waste generation by time of completion of the construction work, which was of 70.03 t/month, for an average duration of 34 months, or the generation by number of floors, which had as a result 63.68 t/floor, for an average of 31 floors.
5. BIBLIOGRAFIA
[1] SÁEZ, P.V., MERINO, M.R., PORRAS-AMORES, C. “Estimation of construction and demolition waste volume generation in new residential buildings in Spain”, Journal of Waste Management & Research., v.30,
pp.137-146, 2011.
[2] YE, G., YUAN, H., SHEN, L., et al., “Simulating effects of management measures on the improvement
of the environmental performance of construction waste management”, Resources, Conservation and
Recycling., v. 62, pp.56-63, 2012.
[3] YUAN, H., LU, W., HAO, J. J. “The evolution of construction waste sorting on-site”, Renewable and Sustainable Energy Reviews., v.30, pp.483-490, 2013.
[4] GUERRERO, L.A., MASS, G., HOGLAND, W. “Solid waste management challenges for cities in developing countries”,Waste Management., v.33, pp.220-232, 2013.
[5] MESQUITA, A.S.G. “Análise da geração de resíduos sólidos da construção civil em Teresina, Piauí [Analysis of the generation of solid waste from construction in Teresina, Piauí]”, Holos, v.2, pp.58-65, 2012.
[6] NUNES, K.R.A., MAHLER, C.F., VALLE, R., et al., “Evaluation of investments in recycling centres for
construction and demolition wastes in Brazilian municipalities”, Waste Management, v.27, pp.1531-1540,
2007.
[7] OLIVEIRA, F.M.D.R., BUFFON, N.M., FREITAS, S.S. “The effectiveness of C&D Waste management considering the stationary buckets contents”, Electronic Journal of Geotechnical Engineering,v.19,
pp.3047-3060, 2014.
[8] MIRANDA, L.F.R., ÂNGULO, S.C., CARELI, E.D. “A reciclagem de resíduos de construção e demolição no Brasil: 1986-2008 [The recycling of construction and demolition waste in Brazil: 1986-2008]”,
Ambiente Construído, v.9, n.1, pp.57-71, 2009.
[9] YUAN, H., SHEN, L. “Trend of the research on construction and demolition waste management”, Waste Management, v. 31, pp.670-679, 2011.
[10] BANIAS, G., ACHILLAS, C., VLACHOKOSTAS, C., et al., “A web-based decision support system for
the optimal management of construction and demolition waste”, Waste Management, v.31, pp. 2497-2502,
2011.
Construction, v. 11, pp. 521-533, 2002.
[12] MENDIS, D., HEWAGE, K.H., WRZESNIEWSKI, J. “Reduction of construction wastes by improving construction contract management: a multinational evaluation”, Waste Management & Research, v.31, n.10,
pp. 1062-1069, 2013.
[13] TAM, V.W.Y., LI, J., CAI, H. „System dynamic modeling on construction waste management in Shenzhen, China”, Waste Management & Research, v.32, n.5, pp.441-453, 2014.
[14] KOFOWOROLA, O.F., GHEEWALA, S.H. „Estimation of construction waste generation and management in Thailand”,Waste Management, v. 29, pp.731-738, 2009.
[15] KATZ, A., BAUM, H. “A novel methodology to estimate the evolution of construction waste in construction sites”,Waste Management, v.31, pp.353-358, 2011.
[16] MÁLIA, M.A.B., BRITO, J., PINHEIRO, M.D., et al., “Construction and demolition waste indicators”, Waste Management & Research. v.31, pp.241-255, 2013.
[17] ASSOCIAÇÃO BRASILEIRA DE NORMAS TÉCNICAS (ABNT): Soil grains which pass the 4.8 mm sieve: determination of density, NBR 6508, Rio de Janeiro, Brazil, 1984.
[18] ASSOCIAÇÃO BRASILEIRA DE NORMAS TÉCNICAS (ABNT): Determination of the liquidity limit: procedure, NBR 6459, Rio de Janeiro, Brazil, 1984.
[19] ASSOCIAÇÃO BRASILEIRA DE NORMAS TÉCNICAS (ABNT): Determination of the plasticity limit: procedure, NBR 7180, Rio de Janeiro, Brazil, 1984.
[20] ASSOCIAÇÃO BRASILEIRA DE NORMAS TÉCNICAS (ABNT): Soil samples: preparation for compression testing and characterization tests, NBR 6457, Rio de Janeiro, Brazil, 1986.
[21] ASSOCIAÇÃO BRASILEIRA DE NORMAS TÉCNICAS (ABNT): Soil – Compression test: procedure, NBR 7182, Rio de Janeiro, Brazil, 1986.
[22] EMBRAPA. “Manual de métdos de análise de solo”, Ministério da Agricultura e do Abastecimento, 2º edição, 2012p, 1997.
[23] MACEDO, T.F. Análise do desempenho mecânico da mistura agregado reciclado-solo-cimento para pavimentação, [Analysis of mechanical performance of the mix recycled-soil-cement aggregate for paving].
Doctorate thesis, Polytechnic School of Pernambuco, University of Pernambuco, Recife, 2013.
[24] PIMENTEL, U.H.O. Análise da geração de resíduos da construção civil da cidade de João Pessoa/PB,
[Analysis of civil construction waste generation of João Pessoa/PB city], Master dissertation, Architecture College, Federal University of Bahia, Salvador, 2013.
[25] FALCÃO, N.C.B. Diagnóstico da situação atual dos resíduos da construção civil no município de Olinda, [Diagnosis of civil construction waste current situation in the municipality of Olinda], Master
dissertation, Polytechnic School of Pernambuco, University of Pernambuco, Recife, 2011.
[26] PRATA, V.C. Gestão de resíduos da construção civil na zona urbana do município de Lagarto-SE: do diagnóstico a uma proposta de modelo gerencial, [Management of waste from civil construction in the urban area of Lagarto municipality: from diagnosis to a management model proposal], Master disseration, Federal University of Sergipe, São Cristóvão, 2013.
[27] WERLE, A. P., TROIAN, A., ALCÂNTARA, J., et al. “Análise de Metodologias Utilizadas Para a
Caracterização da Absorção de Água de Concreto Reciclado Como Agregado”, [Analysis of Methodologies Used to Characterize Water Absorption of Recycled Concrete as Aggregate]. In: Encontro Nacional de Tecnologia do Ambiente Construído, 13., Canela, 2010. Anais. Porto Alegre, ANTAC, v. 1, p. 1-11, 2010.
[28] DESCARREGA, A. Quality improvement of the recycled aggregates through surfasse treatment. Escola
Técnica Superior d`Enginyers de Camins, Canals I Ports de Barcelona, Universitat Politecnica de Catalunya, Barcelona, 2011.
[29] ARAÚJO, N. N. Desempeho de argamassas de revestimento produzidas com agregados reciclados oriundos do resíduo de construção e demolição da grande Natal – RN, [Performance of coating mortars produced with recycled aggregates from the construction residue and demolition of the Great Natal – RN]. Masters Dissertation, Federal University of Rio Grande do Norte, 2014.
[30] SANTOS, E.C.G. Aplicação de Resíduos da Construção e Demolição reciclados (RCD-R) em estruturas de solos reforçados, Masters Dissertation, Polytechnic School of São Carlos, University of São Paulo, São
[31] SILVA, T.C.R., FUCALE, S.P., FERREIRA, S.R.M., et al., “Investigação laboratorial do
comportamento mecânico de RCD para uso em estacas de compactação”,[Laboratory investigation of mechanical behavior of RCD for use in compression stakes], In: XI Congresso Nacional de Geotecnia,
Proceedings of XI Congresso Nacional de Geotecnia, Coimbra, Portugal, 2008.
[32] GUSMÃO, A.D. “Manual de Gestão de Resíduos Sólidos da Construção civil”, [Handbook of Construction Solid Waste Management], CCS Gráfica Editora, Camaragibe, Brazil, 2008.
[33] TESSARO, A.B., SÁ, J.S., SCREMIN, L.B. “Quantificação e classificação dos resíduos procedentes da construção civil e demolição no município de Pelotas, RS”, [Quantification and classification of waste from construction and demolition in the city of Pelotas, Brazil], Ambiente Construído, v.12, n.2, pp.121-130, 2012.
[34] BERTOL, C.A., RAFFLER, A., SANTOS, J.P. Análise da correlação entre a geração de resíduos da construção civil e as características das obras, [Correlation analysis of the generation of waste from the
construction and characteristics of the Works]. Masters Dissertation, Federal Technological University of Paraná, Curitiba, 2013.
[35] CARNEIRO, F.P. Diagnóstico e ações da atual situação dos resíduos de construção e demolição na Cidade do Recife, [Diagnosis and actions of current situation of waste from construction and demolition in
Recife City], Masters Dissertation, Federal University of Paraíba, João Pessoa, 2005.
[36] MARQUES NETO, J.C., SCHALCH, V. “Diagnóstico ambiental para gestão sustentável dos resíduos de construção e demolição”, [Environmental assessment for sustainable management of waste from construction and demolition], In: XIII Simpósio Luso Brasileiro de Engenharia Sanitária, Proceding of XIII
Simpósio Luso Brasileiro de Engenharia Sanitária, Figueira da Foz, Portugal, 2010.
[37] COSTA, R.V.G. Taxa de geração de resíduos da construção civil em edificações na cidade de João Pessoa, [Waste generation rate of construction in buildings in João Pessoa], Masters Dissertation, Federal