Ocean modelling for coastal management – Case studies with MOHID M. Mateus and R. Neves (eds.), IST Press, 2013
MOHID AS A TOOL TO EVALUATE THE IMPACT OF WATER DISCHARGE FROM DAMS ON THE ADVECTION OF ESTUARINE FISH LARVAL STAGES
P. Morais•F. Martins•M. A. Ch´ıcharo•J. Lopes•L. Ch´ıcharo
CHAPTER SYNOPSIS Background
The impoundment of rivers by dams is the biggest direct anthropogenic impact on the hydrological cycle. The utility of dams, as providers of water for human consumption, irrigation and electrical production, is undeniable. However, the price to pay, weighting benefits versus ecological impacts caused by dams, is enormous and often questionable. The deleterious ecological impacts caused by dams are detected at the dam’s site are and at hundreds of kilometers downstream from dams, even in estuaries and coastal areas.
The uncontrolled water discharge from dams, both high volumes of water and inappro-priate timing, compromise fish recruitment because eggs are flushed from estuarine spawning and nursery areas. Thus, our goal was to develop an hydrodynamic mod-elling approach that evaluates the impact of water discharge from dams on the advection of fish larval stages off estuaries and into coastal areas. This goal was accomplished by merging the abundance of anchovy eggs along the Guadiana estuary in MOHID.
Results
MOHID hydrodynamic model for the Guadiana estuary was able to replicate the spawn-ing and nursery areas of anchovy, as well as the general distribution pattern of younger anchovy larvae observed in this estuary in June 2002. Seven river discharge scena-rios, each lasting for 10 days, were tested. Scenarios B ( Qmax= 20 m3s−1) and C2
( Qmax= 50 m3s−1, sudden end at day 5) reduce the abundance of anchovy larval stages
in their spawning and nursery areas by 17% and 47%, respectively.
Theoretically, these two scenarios can solve the eutrophication problem in the upper Guadiana estuary and, simultaneously, do not flush a significant quantity of fish eggs to the coast. Scenario C2 is preferable to scenario C1( Qmax= 50 m3s−1 slow end)
because it requires 30% less water.
Conclusions
MOHID was decisive to choose among the river discharge scenarios defined to solve or mitigate eutrophication problems in the upper Guadiana estuary, and without compro-mising the nursery function of the estuary. The definitive choice between the two best scenarios for solving the eutrophication problem will depend on the degree of the eu-trophication and on the effectiveness of an inexistent monitoring program. This work’s approach developed an easy-to-use management tool for Guadiana managers, serving as an example to other basin managers around the world.
1 INTRODUCTION
Estuaries are highly dynamic systems, where complex interactions occur linking the phy-sical, chemical, geological and biological components [1, 2]. Estuaries undergo anthropogenic impact along their path, and also from the disturbances occurring in the entire basin [3]. Dams are one of such disturbances that cause meaningful deleterious changes to down-stream ecosystems [4, 5], forcing estuarine managers to re-act to an updown-stream-originated event rather than acting on a problem together with dam managers.
The achievement of sustainable water management, i.e. to manage water resources taking into account the needs of present and future users, is being attained with the imple-mentation of UNESCO International Hydrological Programmes (UNESCO-IHP) [6]. The joint efforts of UNESCO-IHP and the Man and Biosphere Programme set the concepts and princi-ples of Ecohydrology, and defined as the study of functional inter-relations between hydrology and biota [7]. Ecohydrology advocates that sustainable management and development of wa-ter resources is possible by restoring and maintaining evolutionary established processes of water and nutrient circulation and energy flow at the basin scale [8].
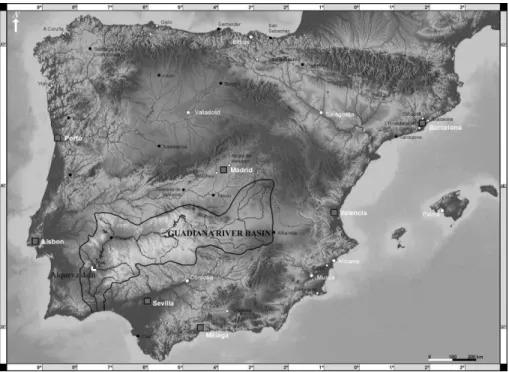
The ecohydrological approach was initially applied in freshwater ecosystems [9-11], and then expanded to estuarine and coastal ecosystems [12]. In the Guadiana estuary (SW Iberian Peninsula) (Figure 1), the ecohydrological approach is pursued since 1996 [13-16]. The ecosystem health of this estuary is regulated by bottom-up and top-down processes [14], which are threatened by dam’s river flow regulation [16].
Successful estuarine and coastal management demands an Ecohydrology-based and basin-wide management, focused on how to adapt, mitigate and restore the functioning of estuaries and coastal areas impacted by dams [15]. For example, controlling eutrophication and preventing harmful algal blooms may occur when the magnitude and periodicity of dams’ hydraulic flushing and nutrient loading are large [17]. In the Guadiana basin, water discharged from dams might be a useful tool to prevent or mitigate eutrophication in the upper estuary [18, 19]. However, unsuitable management practices may cause ecological impacts in the estuary [20], particularly when frequency and intensity of hydraulic flushing are neglected. The pres-cription of flow pulses should also consider the impact on estuarine fish recruitment, because estuaries are the spawning and nursery areas of many coastal and estuarine fishes [21].
High flow pulses increase the advection of fish eggs off an estuary [16] and compromise fish recruitment, mainly of species with reduced reproductive periods and non-competent lar-vae (i.e. larlar-vae are unable to regulate their position in the water column) [22]. As an example, the overall abundance of anchovy eggs decreased 99.9% in the Guadiana estuary after an in-tense river discharge from the Alqueva dam [16]. Thus, our goal was to develop an easy-to-use approach in MOHID to allow dam managers to evaluate the impact of water discharge from dams on fish larval stages advection off estuaries. Fish eggs are excellent natural lagrangian tracers and for validating lagrangian models. In return, these models allow the definition of spawning [23] and nursery areas [24] and infer on larval transport mechanisms [25]. However, finding an appropriate model species and incorporate data on their abundance and distribution in a lagrangian transport model is difficult (consult the next chapter).
In the Guadiana estuary, the most appropriate species to use in lagrangian modelling is the European anchovy (Pisces: Engraulidae - Engraulis encrasicolus (Linnaeus, 1758)) (anchovy hereafter). The eggs and larvae of anchovy are identified unambiguously and are an excellent indicator of river flow impacts in the Guadiana estuary [16]. Moreover, anchovy is the most abundant planktivorous fish in this estuary [26], it has a wide reproductive period (March to November) [27], a central position in Guadiana’s trophic web [28] and was designated as a potential key species in detecting ecosystem changes [29, 30].
P. Morais•F. Martins•M. A. Ch´ıcharo•J. Lopes•L. Ch´ıcharo
1.1 Requisites that fish larval stages have to comply to be used in lagrangian modelling
Not all larval stages can be used for lagrangian modelling. Field surveys ought to aim to collect data on fish larval stages with pelagic eggs and larvae, undoubtedly identified to species level, abundant and broadly distributed along the study site.
Fish eggs must be pelagic because data on its abundance and distribution has to be used in a lagrangian model. It is also relevant to determine how egg’s buoyancy change with salinity, particularly if the study site is deep, if halocline or picnocline exist [31] and if a 3D model is to be implemented. Any species with non-pelagic eggs (e.g. eggs laid on rocks, shells, algae, marine plants) are unsuitable for lagrangian modelling. Recently hatched non-competent larvae are passive tracers, as they only perform micro-adjustments in their position [32, 33]. Larvae’s buoyancy change as the yolk sac is absorbed, and larvae might then tend to sink. Larvae become fully competent, i.e. larvae are able to regulate their position in the water column, when the gas bladder and the fin rays are formed. The time until larvae become competent varies within the same population due to temperature-dependent development [34-36]. Competent larvae are unsuited for lagrangian modelling because they exhibit migratory strategies to counter-act currents and tides [37, 38], or because they settle and remain in their preferred habitat [39].
The identification of fish larval stages until species level is difficult and often impossible; particularly the identification of fish eggs [40]. The incorrect identification of fish larval stages compromises the success of the project for disabling correct calibration and interpretation of impacts on a species or population.
The abundance of fish larval stages have to be high enough and with a broad distribution to allow accurate model predictions. Otherwise, the model will not capture the small and abrupt variations observed in nature. Ideally, the species’ reproduction period should occur along a broad range of river discharges to allow better model calibration.
Finding a species fulfilling all these requisites is difficult. The European anchovy E.
en-crasicolus is the most suited species to use in the lagrangian models of Portuguese estuaries.
This species has pelagic eggs, both eggs and larvae are easily identifiable, larval stages are abundant and present for at least six consecutive months in many Portuguese estuaries [27, 41, 42], therefore comprising distinct river inflow regimes. Other European anchovy popula-tions [43, 44] and other anchovy species are abundant in many European and world estuaries and respective offshore ecosystems [45-49].
1.2 Characteristics of European anchovy larval stages
Anchovy eggs are slightly positive buoyant [50] and its development is temperature de-pendent [34]. The time elapsed from spawning to hatching vary between 24 h and 67 h in the Guadiana estuary [27].
Anchovy larvae hatch from pelagic eggs and recently hatched larvae (∼3.5 mm) tend to have neutral floatability, due to its huge yolk sac. The yolk sac causes drag and any movement is highly expensive in terms of energy. At this stage, larvae just perform regular short bursts to adjust their position and search for microhabitats with oxygen saturation higher than 60%,
since oxygen is exchanged by cutaneous diffusion until the gills are developed. Anchovy larvae move by active swimming when smaller than 5 mm, because viscosity and drag will force them to stop when they beat-and-glide. Larvae tend to have negative floatability as the yolk sac is consumed. The yolk sac is fully absorbed at day 5 (∼5 mm) and intermittent motion becomes the more efficient way of swimming [32, 33]. The development of the dorsal fin and the gas bladder occurs at days 11 and 13, respectively. The gas bladder is completely formed at day 20 (10 mm), allowing larvae to control their position and perform diel rhythms of vertical migration [51]. Thus, lagrangian tracers released in a hydrodynamic model and set to run for 10 days would correspond to anchovy larvae with ages ranging from 7.2 to 9 days, i.e. before larvae develop the morphological characteristics that allow them to regulate actively their position in the water column [51].
2 STUDY AREA
The Guadiana estuary (SE-Portugal/SW-Spain) (Figure 1) is approximately 76 km long, with an area of 22 km2and an average depth of 6.5 m. It is a mesotidal estuary, tide am-plitudes range from 1.3 to 3.5 m, and partially stratified at the entrance of the estuary [27], where an average river flow of 150 m3s−1and tidal prism (∼3 x 10⁷m3) are observed [52].
The estuary is not stratified, both at high and low tides, during periods of low river inflow [27]. River flow has a striking variability between and within years, since the majority of the basin is under the influence of a climate with Mediterranean characteristics. The annual average temperature varies from 14oC to 18oC. Rainfall is irregular among seasons, ∼80% occurs
during autumn and winter, while summers are very dry. The annual average rainfall fluctuates from 561 mm to 600 mm in the Portuguese basin, however higher variations are expected among years. Climate variability imposes a similar trend to river flow; thus, the average river flows are as follows: dry years, 8 – 63 m3s−1; average years, 170 – 190 m3s−1; humid years,
412 – 463 m3s−1[53].
The main ecological constraints observed in the Guadiana basin are damming, water abstraction from aquifers and water pollution. Even so, the estuary is one of the best preserved estuaries of the Iberian Peninsula. Nevertheless, nowadays it has to deal with i) the impact caused by one of the major European dams, the Alqueva dam, ii) the creation of 110,000 ha of irrigation areas in the surroundings of this dam and iii) the destruction of vast natural areas along the estuary margins to build tourist resorts [3].
The Alqueva dam was inaugurated in 8 February 2002, it is located approximately at 150 km from the river mouth. The Alqueva reservoir is one of the biggest in Europe, with a maximum area of 250 km2, a perimeter of more than 1000 km and a total capacity of 4150
hm3[54]. A proper water management is undoubtedly a challenging task to accomplish in this
reservoir, due to the multiple uses that water has, e.g. hydroelectric production and river flow regularization. The major concern that dam managers must have regarding water discharge is to comply with the international political agreement made between Portugal and Spain. This agreement states that the average daily flow in Badajoz (Spain) and Pomar ˜ao (Portugal) cannot be lower than 2 m3s−1and the minimum annual inflow in Badajoz has to vary from 300
P. Morais•F. Martins•M. A. Ch´ıcharo•J. Lopes•L. Ch´ıcharo
Figure 1. Location of the Guadiana basin in the Iberian Peninsula (Europe).
hm3year−1to 600 hm3year−1(except during drought years), but depending on the volume of
water stored in dams and precipitation [55]. From the ecological point of view, this agreement does not have into account the dynamics of biota, which depends on the natural variability of river inflow [56].
3 METHODS
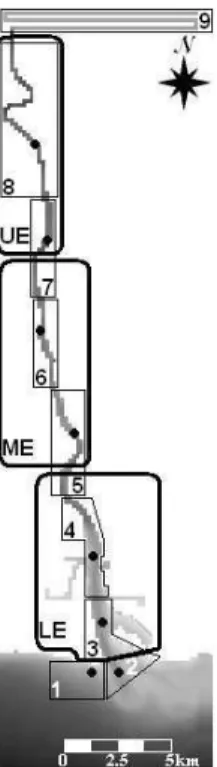
Anchovy larval stages were collected monthly in the Guadiana estuary from March 2002 to February 2003, during new moon spring tides at low and high tides. Nine sampling stations were sampled, seven inside the estuary and two in the coastal area. Sampling started at the beginning of the flood in station 1 and continued upstream, towards station 9. Station 1 was re-sampled at the beginning of the ebb; the remaining stations were sampled afterwards (Figure 2). Sub-superficial zooplankton trawls were made with a 250 µm net mesh, equipped with a flowmeter (General Oceanics). Samples were preserved with buffered formaldehyde (4% final concentration) until processing. In each station, vertical profiles of temperature and salinity were recorded with an YSI 6600 probe. In the laboratory, anchovy eggs and larvae were sorted from the zooplankton samples to estimate their abundance.
Data on anchovy eggs abundance and distribution determined in June 2002, when the highest abundance of anchovy eggs was registered, were incorporated in MOHID’s lagrangian module.
Figure 2. Grid used in MOHID hydrodynamic model for hydrodynamic simulation of the Guadiana estuary.
Legend: Black dots: discharge points and sampling stations; Thick lines: release and monitor boxes used in simulation 1; Thin lines: monitor boxes used in simulation 2.
3.1 MOHID hydrodynamic model for the Guadiana estuary and simulations’ setup
The grid defined to model the hydrodynamic processes in the Guadiana estuary begins in the coast at 5 km from the estuary mouth, ending few kilometers downstream of Alcoutim (station 9). This grid holds ∼45% of the estuary and comprises the area where anchovy eggs were collected (Figure 2). The domain of calculus is made by 205 x 53 cells with a spatial step of 180 x 180 m. The bathymetry was crafted on the grid and one sigma layer was used for the vertical discrimination; thus the model behaves as a 2D depth integrated model. Field measurements of hydrodynamic parameters (water level, velocity and direction) and water properties (salinity and cohesive sediments) were used for calibration purposes [57]. River discharge was determined at 16 km above the tidal limit of the estuary, in Pulo do Lobo hydrometric station (code: 27L/01) [54], where ∼90% of the water going to the estuary passes [58].
A constant river discharge of 5 m3s−1(average Guadiana river discharge between the
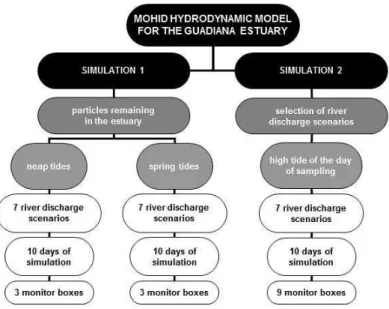
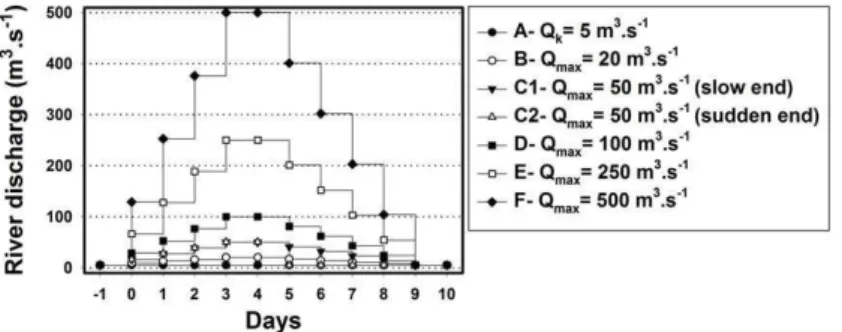
samplings of April and June 2002) was used to stabilize hydrodynamics and salt transport. Then, two simulation setups were set (Figure 3) and tested in seven river discharge scenarios (scenarios A, B, C1, C2, D, E and F) (Figure 4) and two tidal situations, during the weaker neap tides and strongest spring tides of late May and early June 2002, respectively. Scenario A has
P. Morais•F. Martins•M. A. Ch´ıcharo•J. Lopes•L. Ch´ıcharo
Figure 3. Summary of the two simulation setups.
a constant river discharge of 5 m3s−1, while the remaining six scenarios have maximum river
discharges of 20 m3s−1(scenario B), 50 m3s−1(scenarios C1 and C2), 100 m3s−1(scenario
D), 250 m3s−1(scenario E) and 500 m3s−1(scenario F). In scenarios B to F, the discharge
increases steadily during 4 days until reaching the maximum discharge, remains constant for 2 days and then decreases progressively until reaching 5 m3s−1at day 10, except for scenario
C2. This scenario has an abrupt decrease at day 6, from 50 m3s−1to 5 m3s−1(Figure 4). Two
simulations were set to: Simulation 1) determine the percentage of particles released from the upper, middle and lower Guadiana estuary remaining in the estuary along 10 days and for seven river discharge scenarios; Simulation 2) select the discharge scenario(s) that do not compromise the presence of anchovy eggs and non-competent larvae inside the Guadiana estuary, by merging the abundance of anchovy eggs in the hydrodynamic model.
3.2 Simulation 1 – Percentage of particles remaining in the estuary
Three release and monitor boxes were set, corresponding to the upper, middle and lower estuary (Figure 2). This subdivision was made according to the hydrology, sedimentology and biology of the estuary [13, 40, 59]. The number of particles released in each box was proportional to its volume; thus, 1140, 1110 and 1610 particles were released in the upper, middle and low estuary, respectively. The duration of each simulation was 10 days (Figures 3 and 4). The effect of tides on the number of particles in the estuary at day 10, for each river discharge scenario, was evaluated with a t-test. This analysis compares the means of two groups. Mann-Whitney rank sum test will be used when the Kolmogorov-Smirnov test (with Lilliesfors’ correction) reveals that data has not a normal distribution [60].
Figure 4. River discharge scenarios applied in MOHID hydrodynamic model for the Guadiana estuary.
3.3 Simulation 2 – Selection of river discharge scenarios
The seven river discharge scenarios were tested to select those that do not compromise the presence of anchovy larval stages inside the estuary. The number of particles released in each releasing point was proportional to the abundance of anchovy eggs registered in the survey made during the high tide of June 2002 [27]. Thus, 1, 111, 175, 614, 21064, 6202, 2782 and 13 lagrangian tracers were released in releasing points 1 to 8, respectively. Simulation started at the high tide of the sampling day and lasted for 10 days. The number of particles was calculated in nine monitor boxes, at the high tide of days 5 and 10. Boxes boundaries were set at the half way between stations (boxes 3 to 8) or comprising a particular area (boxes 1, 2 and 9). No particles were released in box 9, but the number of particles entering the box was monitored (Figure 2). The median was calculated because it is less sensitive to extreme scores than the mean, thus providing a better measure of highly skewed distributions [60].
4 RESULTS
4.1 Anchovy eggs and larvae
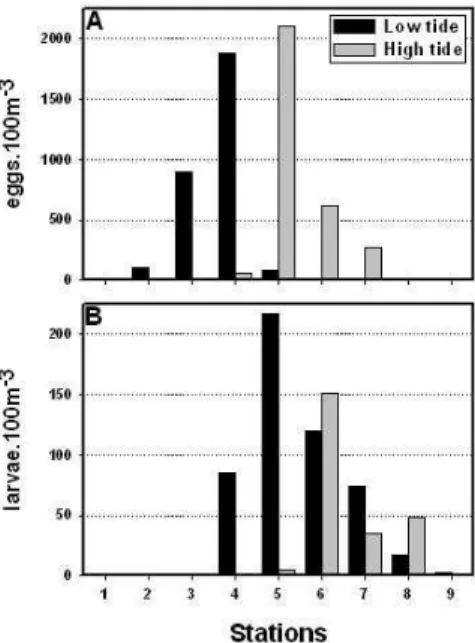
In June 2002, anchovy eggs were distributed from stations 2 to 7 and were more abundant in the low estuary (stations 3 and 4) during the low tide. At the high tide, the distribution ranged from stations 2 to 8 and were more abundant in the middle estuary (stations 5 to 7). The maximum abundance of anchovy eggs was registered in station 4 at the low tide (1883 eggs 100 m−3) and in station 5 at the high tide (2106 eggs 100 m−3) (Figure 5A). Maximum larvae
abundance was registered in station 5 during the low tide (218 larvae 100 m−3) and in station
6 during the high tide (151 larvae 100 m−3). Anchovy larvae were collected from stations 4
to 9, but were more abundant in the middle estuary at both tides (Figure 5B). Younger larvae (8.2 ± 0.5 days) were collected in the middle estuary, while older larvae (15.1 ± 4.7 days) were in the upper estuary at station 9 (data not shown) [27].
4.2 Percentage of particles remaining in the estuary (Simulation 1)
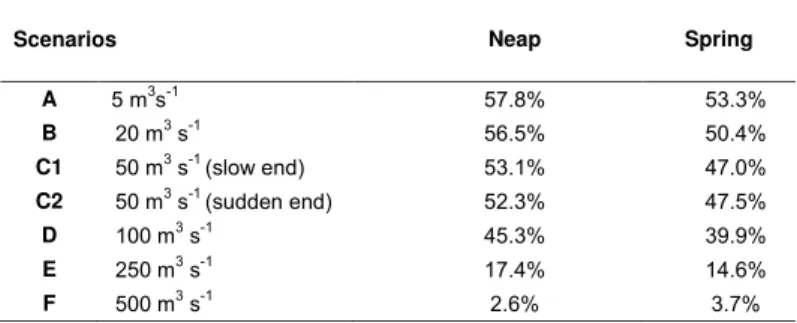
The median percentages of particles inside the estuary for each scenario and tide, along 10 days, are summarized in table 1. The number of particles remaining in the estuary after 10
P. Morais•F. Martins•M. A. Ch´ıcharo•J. Lopes•L. Ch´ıcharo
Figure 5. Abundance of anchovy eggs (A) and larvae (B), in each sampling station, at the low and high
tides of June 2002.
days was significantly lower during spring tides, except for scenario F ( Qmax= 500 m3s−1) (for
all comparisons, P ≤ 0.001). Hereafter, the analyzed scenarios correspond only to the spring tide. Thus, in scenario A ( Qk= 5 m3s−1), 53.3% of the particles remained in the estuary after
10 days. The number of particles in the estuary decreased, as maximum river discharge in-creased, down to 3.7% in scenario F ( Qmax= 500 m3s−1), corresponding to a water residence
time of 3.7 days. Scenarios C1 ( Qmax= 50 m3s−1slow end) and C2 ( Qmax= 50 m3s−1sudden
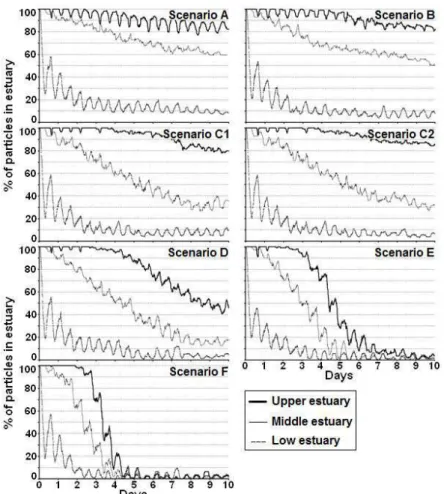
end) are significantly different (P ≤ 0.001), for the period when river discharge pattern started to differ. The median values were 39.2% (scenario C1) and 39.7% (scenario C2) (Figure 6). The water residence time of the low estuary was 9.5 days in scenario A, decreasing to 1.6 days in scenario F (Figure 7). Also for scenario F, the middle and upper estuary had residence times of 3.8 days and 4.7 days, respectively (Figure 7). For scenarios D, E and F, the particles in the estuary after 10 days correspond to 28.7%, 5.8% and 1.5% of those in the estuary for scenario A, respectively (Figure 6).
4.3 Selection of river discharge scenarios (Simulation 2)
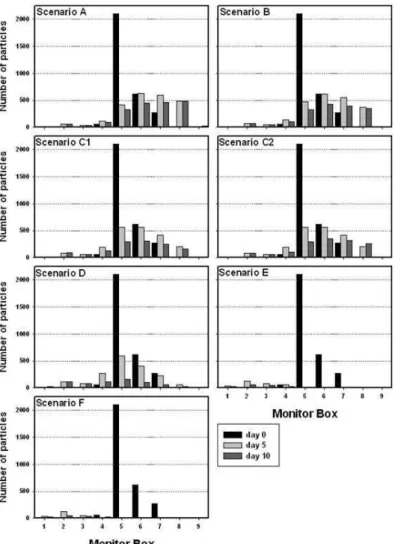
For scenario A ( Qk= 5 m3s−1), 76.2% and 63.2% of the particles released in each station
remained in the estuary after 5 and 10 days, respectively. Particles remained largely in the middle estuary. The distribution pattern of particles along the estuary observed in scenarios B ( Qmax= 20 m3s−1), C1 ( Qmax= 50 m3s−1slow end) and C2 ( Qmax= 50 m3s−1sudden end)
was similar to that of scenario A, despite their reduction in the estuary. For scenarios C1 and C2, 67.8% of particles were in the estuary after 5 days, decreasing to 42.6% and 47.6%
after 10 days, respectively. In scenario D ( Qmax= 100 m3s−1), 22.5% of particles were in
the estuary after 10 days, but their distribution pattern was more even than for the previous scenarios. For scenarios E ( Qmax= 250 m3s−1) and F ( Qmax= 500 m3s−1), only 5.0% and
4.8% of the particles remained in the low estuary after 10 days, respectively (Figure 8).
Table 1. Median percentage of particles in the estuary for each tidal condition, throughout the 10 days of
simulation.
Scenarios Neap Spring
A 5 m3s-1 57.8% 53.3% B 20 m3 s-1 56.5% 50.4% C1 50 m3 s-1 (slow end) 53.1% 47.0% C2 50 m3 s-1 (sudden end) 52.3% 47.5% D 100 m3 s-1 45.3% 39.9% E 250 m3 s-1 17.4% 14.6% F 500 m3 s-1 2.6% 3.7%
Figure 6. Percentage of particles remaining in the estuary for each discharge scenarios, throughout the
10 days during the spring tide simulation (Simulation 1).
5 MANAGING RIVER FLOW IN THE LOWER GUADIANA BASIN
Water and ecosystem management policies are often based on economic decisions, with little concern towards fish conservation [61]. In the Guadiana basin, the political treaties be-tween Portugal and Spain on minimum river flow and annual inflow have also to be considered during management [55]. The ecosystem services provided by the Guadiana to humans are broad and management programs, based on the preservation of these services, require a full
P. Morais•F. Martins•M. A. Ch´ıcharo•J. Lopes•L. Ch´ıcharo
Figure 7. Percentage of particles in each estuarine section for each discharge scenario, throughout the
10 days of simulation (Simulation 1).
knowledge of the complexity in which they benefit humans [62]. However, the inexistence of long term monitoring programs in the Guadiana basin, as well as in many worldwide aquatic ecosystems, difficults the proposal of scientific based management policies [63] and the evalu-ation of how these measures protect nature and benefit humans [62].
The prescription of flushing flows is one of the most important river management tools [64, 65]. Thus, a wise prescription of flushing flows can be made with the approach we developed with MOHID, which take into account the locations of fish spawning and nursery areas. Field observations showed that anchovy was the most abundant pelagic fish in the Guadiana es-tuary, with one spawning area located in the transition between the low and middle estuary [27]. The approach we applied with MOHID corroborated field observations, since particles released in station 5 (in the transition between the low and middle estuary) were those that better reproduced the distribution pattern of anchovy eggs in the estuary (data not shown)
Figure 8. Number of particles, in each monitor box, at the high tide of days 0, 5 and 10, for each river
discharge scenario (Simulation 2).
[27]. The transition between the low and middle estuary seems to be the best spawning area for anchovy, since circulation patterns and residence times of this area allow larval stages to fulfill their need for exogenous food and develop their capability to actively control their dis-tribution [23, 66]. In this transition zone, the estuary has pronounced S shape morphology, forming secondary flows that enable the retention of particles [77]. This hypothesis explains the marked difference between the number of particles remaining in the low and middle es-tuary, after 5 and 10 days at Q = 5 m3s−1. Moreover, there is an upstream residual transport
of particles, because the length of the ebb is longer than the flood, even if water velocity is higher during the flood and in periods of low river flow [68, 69].
P. Morais•F. Martins•M. A. Ch´ıcharo•J. Lopes•L. Ch´ıcharo
The distribution pattern of particles obtained with a Q = 5 m3s−1after 10 days of
simula-tion is comparable with the one observed for anchovy larvae [27], which had an average age of 8 days and without active swimming abilities [51]. A more analogous pattern could have been obtained if egg and larvae mortality were integrated in the model and if more samples were collected along the estuary. The elder anchovy larvae were found in the upper estuary [27], indicating that they used active retention strategies, other than passive retention mecha-nisms, to reach this area and remain there [37, 38]. The active retention mechanisms used by anchovy could be: (a) selective tidal stream transport and residual bottom inflow, which might be synchronized with vertical migrations of larvae with formed gas bladder [51]; and (b) lateral migrations to the margins, where the river flow is lower, or to take advantage of the residual up-estuary flow near the margins of the low Guadiana estuary [70]. On the other hand, passive retention mechanisms are exemplified by tidal and wind advection; however in narrow estuaries, as the Guadiana estuary, inert particles seem to be under little effect by these agents [71].
Significant differences in the number of particles remaining in the estuary were calculated between neap tides and spring tides. This means that setting one of the chosen river discharge scenarios should occur during neap tide, because the chances of anchovy larval stages to re-main inside the estuary are higher. Scenarios D ( Qmax= 100 m3s−1), E ( Qmax= 250 m3s−1)
and F ( Qmax= 500 m3s−1) flush anchovy larval stages from their spawning and nursery areas.
In contrast, scenario A ( Q = 5 m3s−1), the low and continuous inflow provides a stationary
state of the different biological compartments unlikely to trigger the mitigation/prevention of eu-trophication [20]. Thus, depending on the magnitude of the eueu-trophication in the upper estuary, scenarios B ( Qmax= 20 m3s−1), C1 ( Qmax= 50 m3s−1slow end) or C2 ( Qmax= 50 m3s−1
sud-den end), could be set during the neap tides. The two similar scenarios, scenarios C1 and C2 ( Qmax= 50 m3s−1), imply the loss of ∼50% of the anchovy larval stages from the estuary,
therefore the timing of the pulse (i.e. if it coincides or not with anchovy spawning) and the benefits resulting from this action have to be ecologically and economically evaluated [62, 64]. Scenario C2 is more conservative, i.e. the number of particles remaining inside the estuary is greater, and requires 30% less water. This is a crucial aspect to consider in a region with reduced water resources and highly variable supply [54]. A final choice between scenarios has also to rely on conclusions obtained with plankton experiments [17].
The management tool we developed with MOHID has fish and fisheries conservation into account, it is easy and fast to implement and is a step-forward in modelling the dispersion of fish eggs in estuarine ecosystems. This tool can be applied in estuaries of different structures, circulation patterns and climatic regions, as long as the hydrodynamic model is calibrated and the requisites assigned for fish larval stages to be used in lagrangian models are fulfilled.
The prescription of flow pulses is not restricted to mitigate/prevent eutrophication. The utility of our approach using MOHID can be adapted to test the impact of flow pulses and the simulation of natural flow regimes in refraining the invasion success of non-indigenous species, since invasiveness success is facilitated by the alteration of flow regimes [56]. In the Guadiana estuary, flow pulses or setting natural flow regimes could be useful to refrain
the invasiveness success of the hydromedusae Blackfordia virginica (Cnidaria, Hydrozoa), the oriental shrimp Palaemon macrodactylus (Crustacea, Decapoda) [72] and the asian clam
Corbicula fluminea (Bivalvia, Corbiculidae) [73]. Regarding non-indigenous fish, it was shown
that natural flow regime per se is unlikely to ensure persistence of native fish assemblages, be-ing necessary a combination of active management of natural flow regimes with concurrently suppressing or excluding the non-indigenous fishes from the fish population [74].
In conclusion, the work we developed with MOHID is an important contribution for the ecohydrological knowledge on the Guadiana estuary. With MOHID, we set river discharge scenarios that would not jeopardize the presence of fish larval stages inside the estuary, in order to solve or mitigate eutrophication in the upper estuary. The results obtained with MOHID are encouraging us to develop a new MOHID module, specifically designed to study the lagrangian transport of fish eggs. The ultimate ecohydrological model has to compulsory merge physical, chemical, biological and hydrological processes in one dynamic model, which ought to be social and economical contextualized. Thus, MOHID has also an important role to play in the ecohydrological management of the Guadiana estuary. The current management paradigm of the Guadiana river flow is primarily based on economical and political premises. However, just a management program guided by robust ecological studies and adequate so-ciological framework will ensure conservation of the Guadiana estuary and the maintenance of ecosystem services.
ACKNOWLEDGEMENTS
We are grateful to Ana Faria, Anabela Ven ˆancio, Alberto Brito, Antero Fernandes, Isabel Marques, Jo ˜ao Janeiro, Lu´ıs Crist ´ov ˜ao and Selma Gabriel for their help during this work. Fundac¸ ˜ao para a Ci ˆencia e a Tecnologia (Portugal) funded this work through project ERIC (FCT/P/MAR/15263/1999) and through the scholarships granted to Pedro Morais (SFRH/BD/5187/2001, SFRH/BPD/40832/2007).
REFERENCES
1. Struyf, E., Van Damme, S., Meire, P., 2004. Possible effects of climate change on estuarine nutrient fluxes: a case study in the highly nutrified Schelde estuary (Belgium, The Netherlands). Estuarine, Coastal and Shelf Science, 60: 649-661.
2. Trigo, R.M., V ´azques, D.P., Osborn, T.J., Castro-D´ıez Y., G ´amiz-Fortis S., Esteban-Parra M.J., 2004. North Atlantic Oscillation influence on precipitation, river flow and water resources in the Iberian Peninsula. International Journal of Climatology, 24: 925-944.
3. Morais, P., 2008. Review on the major ecosystem impacts caused by damming and watershed development in an Iberian basin (SW-Europe): Focus on the Guadiana estuary. Annales de Limnologie-International Journal of Limnology, 44: 105-117.
4. Ly, C.K., 1980. The role of the Akosombo Dam on the Volta river in causing coastal erosion in central and eastern Ghana (West Africa). Marine Geology, 37: 323-332.
5. Nixon, S.W., 2004. The artificial Nile. American Scientist, 92: 158-165.
6. IHP (International Hydrological Programme), 2007. Updated draft strategic plan for the 7th phase of the IHP (2008-2013). UNESCO, Delft, The Netherlands, 34 p.
7. Zalewski, M., Janauer, G.A., Jol ´ankai, G., 1997. Ecohydrology- a new paradigm for the sus-tainable use of aquatic resources. UNESCO International Hydrological Programme- V Technical Documents in Hydrology. UNESCO, Paris, France, 58 p.
8. Ch´ıcharo, L., Ch´ıcharo, M.A., 2006. Applying the ecohydrology approach to the Guadiana estuary and coastal areas: Lessons learned from dam impacted ecosystems. Estuarine, Coastal and Shelf Science, 70: 1-2.
P. Morais•F. Martins•M. A. Ch´ıcharo•J. Lopes•L. Ch´ıcharo
9. Boruah, S., Biswas, S.P., 2002. Ecohydrology and fisheries of the upper Brahmaputra basin. The Environmentalist, 22: 119-131.
10. Porporato, A., Odorico, P., Laio, F., Ridolfi, L., Rodriguez-Iturbe, I., 2002. Ecohydrology of water-controlled ecosystems. Advances in Water Resources, 25: 1335-1348.
11. Luz, L.D., Loucks, D.P., 2003. Developing habitat suitability criteria for water manage-ment: A case study. International Journal of River Basin Management, 1: 283-295.
12. Wolanski, E., Boorman, L.A., Ch´ıcharo, L., Langlois-Saliou, E., Lara, R., Plater, A.J., Uncles, R.J., Zalewski, M., 2004. Ecohydrology as a new tool for sustainable manage-ment of estuaries and coastal waters. Wetlands Ecology and Management, 12: 235-276.
13. Ch´ıcharo, M.A., Ch´ıcharo, L., Galv ˜ao, H., Barbosa, A., Marques, M.H., Andrade, J.P., Esteves, E., Miguel, C., Gouveia, I., 2001. Status of the Guadiana Estuary (south Portugal) during 1996-1998: An ecohydrological approach. Aquatic Ecosystem Health and Management Society, 4: 73-89. 14. Wolanski, E., Chicharo, L., Chicharo, M.A., Morais, P., 2006. An ecohydrology model of the
Guadi-ana Estuary (South Portugal). Estuarine, Coastal and Shelf Science, 70: 132-143.
15. Ch´ıcharo, L., Ben Hamadou, R., Amaral, A., Range, P., Mateus, C., Pil ´o, D., Marques, R., Morais, P., Ch´ıcharo, M.A., 2009. Application and demonstration of the Ecohydrology approach for the sustainable functioning of the Guadiana estuary (South Portugal). Ecohydrology and Hydrobiology, 9: 55-71.
16. Morais, P., Ch´ıcharo, M.A., Ch´ıcharo, L., 2009. Changes in a temperate estuary during the filling of the biggest European dam. Science of the Total Environment, 407: 2245-2259.
17. Roelke, D., Augustine, S., Buyukates, Y., 2003. Directing the fall of Darwin’s “Grain in the balance”: Manipulation of hydraulic flushing as a potential control of phytoplankton dynamics. Texas Water Resources Institute, College Station, USA, 14p.
18. Ch´ıcharo, L., Ch´ıcharo, M.A., Ben-Hamadou, R., 2006. Use of a hydrotechnical infrastructure (Alqueva Dam) to regulate planktonic assemblages in the Guadiana estuary: Basis for sustainable water and ecosystem services management. Estuarine, Coastal and Shelf Science, 70: 3-18. 19. Sobrino, C., Matthiensen, A., Vidal, S., Galv ˜ao, H. 2004. Occurrence of microcystins along the
Guadiana estuary. Limnetica, 23: 133-144.
20. Small, M., Bonner, T., Baccus, J., 2009. Hydrologic alteration of the lower Rio Grande terminus: a quantitive assessment. River Research and Applications, 25: 241-252.
21. Blaber, S.J.M., Brewer, D.T., Salini, J.P., 1995. Fish communities and the nursery role of the shallow inshore waters of a tropical bay in the Gulf of Carpentaria, Australia. Estuarine, Coastal and Shelf Science, 40: 177-193.
22. Strydom, N.A., Whitfield, A.K., Paterson, A.W., 2002. Influence of altered freshwater flow regimes on abundance of larval and juvenile Gilchristella aestuaria (Pisces: Clupeidae) in the upper reaches of two South African estuaries. Marine and Freshwater Research, 53: 431-438.
23. Page, F.H., Sinclair, M., Naimie, C.E., Loder, J.W., Losier, R.J., Berrien, P.L., Lough, R.G., 1999. Cod and haddock spawning on Georges Bank in relation to water residence times. Fisheries Oceanography, 8: 212-226.
24. Parada, C., van der Lingen, C.D., Mullon, C., Penven, P., 2003. Modelling the effect of buoyancy on the transport of anchovy (Engraulis capensis) eggs from spawning to nursery grounds in the southern Benguela: an IBM approach. Fisheries Oceanography, 12: 170-184.
25. Allain, G., Petitgas, P., Grellier, P., Lazure, P., 2003. The selection process from larval to juve-nile stages of anchovy (Engraulis encrasicolus) in the Bay of Biscay investigated by lagrangian simulations and comparative otolith growth. Fisheries Oceanography, 12: 407-418.
26. Ch´ıcharo, M.A., Ch´ıcharo, L., Morais, P., 2006. Inter-annual differences of ichthyofauna structure of the Guadiana estuary and adjacent coastal area (SE Portugal/SW Spain): Before and after Alqueva dam construction. Estuarine, Coastal and Shelf Science, 70: 39-51.
27. Morais, P., 2007. The life cycle of Engraulis encrasicolus sensu lato in the Guadiana estuary: Ecology, Ecohydrology and Biology. PhD Thesis. Univ. do Algarve, Faro, Portugal, 238 p.
28. Can ´ario, A., 2001. Estudo das condic¸ ˜oes ambientais no estu ´ario do rio Guadiana e na zona de Vila Real de Santo Ant ´onio. Componente ecosistemas. Diagn ´ostico da situac¸ ˜ao actual e definic¸ ˜ao da situac¸ ˜ao de refer ˆencia. CCMAR, Faro, Portugal, 168 p.
29. Ch´ıcharo, L., Ch´ıcharo, M.A., Esteves, E., Andrade, J.P., Morais, P., 2001. Effects of alterations in fresh water supply on the abundance and distribution of Engraulis encrasicolus in the Guadiana estuary and adjacent coastal areas of south Portugal. Ecohydrology and Hydrobiology, 1: 341-345. 30. Ch´ıcharo, L., Ch´ıcharo, M.A., Morais, P., 2003. Effects of Guadiana river inflow on coastal fisheries.
Thalassas, 19: 99-100.
31. Mullon, C., Fr ´eon, P., Parada, C., van der Lingen, C., Huggett, J., 2003. From particles to indi-viduals: modelling the early stages of anchovy (Engraulis capensis / encrasicolus) in the southern Benguela. Fisheries Oceanography, 12: 396-406.
32. Weihs, D., 1980. Energetic significance of changes in swimming modes during growth of larval anchovy, Engraulis mordax. Fishery Bulletin, 77: 597-604.
33. Weihs, D., 1980. Respiration and depth control as possible reasons for swimming of northern anchovy, Engraulis mordax, yolk-sac larvae. Fishery Bulletin, 78: 109-117.
34. Lo, N.C.H., 1985. A model for temperature-dependent northern anchovy egg development and an automated procedure for the assignment of age to staged eggs. NOAA Technical Report NMFS, 36: 43-50.
35. Bernal, M., Borchers, D.L., Vald ´es, L., Lago de Lanz ´os, A., Buckland, S.T., 2001. A new ageing method for eggs of fish species with daily spawning synchronicity. Canadian Journal of Fisheries and Aquatic Sciences, 58: 2330-2340.
36. Fox, C.J., Geffen, A.J., Blyth, R., Nash R.D.M., 2003. Temperature-dependent development rates of plaice (Pleuronectes platessa L.) eggs from the Irish Sea. Journal of Plankton Research, 25: 1319-1329.
37. Kimura, R., Secor, D.H., Houde, E.D., Piccoli, P.M., 2000. Up-estuary dispersal of young-of-the-year bay anchovy Anchoa mitchilli in the Chesapeake Bay: inferences from microprobe analysis of strontium in otoliths. Marine Ecology Progress Series, 208: 217-227.
38. Hare, J.A., Thorrold, S., Walsh, H., Reiss, C., Valle-Levinson, A., Jones, C., 2005. Biophysical mechanisms of larval fish ingress into Chesapeake Bay. Marine Ecology Progress Series, 303: 295-310.
39. Borges, R., 2006. Composition, temporal and spatial patterns of very-nearshore larval fish assem-blages at the Arr ´abida Marine Park. PhD Thesis. Univ. do Algarve, Faro, Portugal, 341 p. 40. Faria, A., Morais, P., Ch´ıcharo, M.A., 2006. Ichthyoplankton dynamics in the Guadiana estuary and
adjacent coastal area (SE-Portugal/SW-Spain). Estuarine, Coastal and Shelf Science, 70: 85-97. 41. R ´e, P., 1984. Ictiopl ˆancton da regi ˜ao central da costa portuguesa e do estu ´ario do Tejo. Ecologia
da postura e da fase planct ´onica de Sardina pilchardus (Walbaum, 1792) e de Engraulis encrasi-colus (Linn ´e, 1758). PhD Thesis. Univ. de Lisboa, Lisboa, Portugal, 425 p.
42. Ribeiro, R., 1991. Ecologia do ictiopl ˆancton e reproduc¸ ˜ao da anchova Engraulis encrasicolus (L.) (Pisces, Engraulidae) no estu ´ario do rio Mondego. PhD Thesis. Univ. de Coimbra, Coimbra, Portugal, 356 p.
43. Sinovˇci´c, G., 2004. Growth and length-weight relationship of the juvenile anchovy, Engraulis en-crasicolus, in the nursery ground (Zrmanja River estuary-eastern Adriatic Sea). Journal of Applied Ichthyology, 20: 79-80.
44. Drake, P., Borla, A., Gonz ´alez-Orteg ´on, E., Bald ´o, F., Vilas, C., Fern ´andez-Delgado, C., 2007. Spatio-temporal distribution of early life stages of the European anchovy Engraulis encrasicolus L. within a European temperate estuary with regulated freshwater inflow: effects of environmental variables. Journal of Fish Biology, 70: 1689-1709.
45. Vi ˜nas, M.D., Negri, R., Ram´ırez, F.C., Hern ´andez, D., 2002. Zooplankton assemblages and hydrography in the spawning area of anchovy (Engraulis anchoita) off R´ıo de la Plata estuary (Argentina-Uruguay). Marine and Freshwater Research, 53: 1031-1043.
P. Morais•F. Martins•M. A. Ch´ıcharo•J. Lopes•L. Ch´ıcharo
46. Wang, Y.-T., Tzeng, W.-N., 1999. Differences in growth rates among cohorts of Encrasicholina punctifer and Engraulis japonicus larvae in the coastal waters off Tanshui River Estuary, Taiwan, as indicated by otolith microstructure analysis. Journal of Fish Biology, 54: 1002-1016.
47. Iseki, K., Kiyomoto, Y., 1997. Distribution and settling of Japanese anchovy (Engraulis japonicus) eggs at the spawning ground off Changjiang River in the East China Sea. Fisheries Oceanography, 6: 205-210.
48. Olney, J.E., 1983. Eggs and early larvae of the bay anchovy, Anchoa mitchilli, and the weakfish, Cynoscion regalis, in lower Chesapeake Bay with notes on associated ichthyoplankton. Estuaries, 6: 20-35.
49. Yang, J., Arai, T., Liu, H., Miyazaki, N., 2006. Environmental signature in the otolith elemental fingerprint of the tapertail anchovy, Coilia mystus, from the Changjiang estuary, China. Journal of Applied Ichthyology, 22: 459-462.
50. Blaxter, J.H.S., 1969. Development: eggs and larvae. In: Fish Physiology, Hoar WS, Randall DJ (Eds). Academic Press, New York, USA, 177-252 pp.
51. R ´e, P., 1986. Otolith microstructure and the detection of life history events in sardine and anchovy larvae. Ci ˆencia Biol ´ogica, 6: 9-18.
52. Michel, D., 1980. Synthese des donnes physiques mesures dans le Rio Guadiana. Evaluation de l’intrusion saline dans l’estuaire. Univ. de Bruxelles, Bruxelles, Belgium.
53. Bettencourt, A., Gomes, V., Dias, J.A., Ferreira, G., Silva, M.C., Costa, L., 2003. Estu ´arios Por-tugueses. Instituto da ´Agua, Lisboa, Portugal, 300 p.
54. INAG (Instituto Nacional da ´Agua), 2005. http://www.inag.pt.
55. Di ´ario da Rep ´ublica, 1999. Resoluc¸ ˜ao da Assembleia da Rep ´ublica no66/99. Convenc¸ ˜ao sobre
cooperac¸ ˜ao para a protecc¸ ˜ao e o aproveitamento sustent ´avel das ´aguas das bacias hidrogr ´aficas Luso-Espanholas. Di ´ario da Rep ´ublica, 191: 5410-5430.
56. Bunn, S.E., Arthinghton, H., 2002. Basic principles and ecological consequences of altered flow regimes for aquatic biodiversity. Environmental Management, 30: 492-507.
57. Lopes, J., 2004. Modelac¸ ˜ao matem ´atica do transporte de sedimentos no Estu ´ario do Guadiana. MSc Thesis. Universidade do Minho, Braga, Portugal, 92 p.
58. Ribeiro, O., Lautensach, H., Daveau, S., 1988. Geografia de Portugal. II- O ritmo clim ´atico e a paisagem. Edic¸ ˜oes Jo ˜ao S ´a da Costa, Lisboa, Portugal, 288 p.
59. Morales, J.A., 1993. Sedimentolog´ıa del Estu ´ario del R´ıo Guadiana. PhD Thesis. Univ. de Huelva, Huelva, Spain, 322 p.
60. Sokal, R.R., Rolph, F.J., 1981. Biometry. 2nd Edition. W.H. Freeman and Co.: San Francisco. 61. Huckstorf, V., Lewin, W.-C., Wolter, C., 2008. Environmental flow methodologies to protect fisheries
resources in human modified large lowland rivers. River Research and Applications, 24: 519-527. 62. Farber, S., Constanza, R., Childers, D.L., Erickson, J., Gross, K., Grove, M., Hopkinson, C.S., Kahn, J., Pincetl, S., Troy, A., Warren, P., Wilson, M., 2006. Linking ecology and economics for ecosystem management. Bioscience, 56: 121-133.
63. Souchon, Y., Sabaton, C., Deibel, R., Reiser, D., Kershner, J., Gard, M., Katopodis, C., Leonard, P., Poff, N.L., Miller, W.J., Lamb, L., 2008. Detecting biological responses to flow management: missed opportunities; future directions. River Research and Applications, 24: 506-518.
64. Chi, J.-H., Chang, N.-B., 2005. Risk assessment for optimal freshwater inflow in response to sustainability indicators in semi-arid coastal bay. Stochastic Environmental Research and Risk Assessment, 19: 111-124.
65. Batalla, R.J., Vericat, D., 2008. Hydrological and sediment transport mechanisms of flushing flows: implications for management in large Mediterranean rivers. River Research and Applications, 25: 297-314.
66. Brown, C.A., Jackson, G.A., Holt, S.A., Holt, G.J., 2005. Spatial and temporal patterns in modelled particle transport to estuarine habitat with comparisons to larval fish settlement patterns. Estuar-ine, Coastal and Shelf Science, 64: 33-46.
67. Martins, F., Leit ˜ao, P., Neves, R., 2002. Simulating vertical water mixing in homogeneous estuaries: the Sado Estuary case. Hydrobiologia, 475/476: 221-227.
68. Fortunato, A.B., Oliveira, A., Alves, E.T., 2002. Circulation and salinity intrusion in the Guadiana estuary. Thalassas, 18: 43-65.
69. Pinto, L.L., Oliveira, A., Fortunato, A.B., Baptista, A.M., 2003. Analysis of the stratification in the Guadiana estuary. Estuarine and Coastal Modelling, 8: 1094-1113.
70. Oliveira, A., Fortunato, A.B., Pinto, L., 2006. Modelling the hydrodynamics and the fate of passive and active organisms in the Guadiana estuary. Estuarine, Coastal and Shelf Science, 70: 76-84. 71. Braunschweig, F., Martins, F., Chambel, P., Neves, R., 2003. A methodology to estimate renewal
time scales in estuaries: the Tagus Estuary case. Ocean Dynamics, 53: 137-145.
72. Ch´ıcharo, M.A., Leit ˜ao, T., Range, P., Gutierrez, C., Morales, J., Morais, P., Ch´ıcharo, L. 2009. Alien species in the Guadiana Estuary (SE-Portugal/SW-Spain): Blackfordia virginica (Cnidaria, Hydrozoa) and Palaemon macrodactylus (Crustacea, Decapoda): potential impacts and mitigation measures. Aquatic Invasions, 4: 501-506
73. Morais, P., Teod ´osio, J., Reis, J., Ch´ıcharo, M.A., Ch´ıcharo, L., 2009. The Asian clam Corbicula fluminea (M ¨uller, 1774) in the Guadiana River Basin (southwestern Iberian Peninsula): Setting the record straight. Aquatic Invasions, 4: 681-684.
74. Gozlan, R.E., Britton, J.R., Cowx, I., Copp, G.H., 2010. Current knowledge on non-native freshwa-ter fish introductions. Journal of Fish Biology, 76: 751-786.