A Mobile approach for
Farmer-Computer Interaction
Maria João Ribeiro Marques
Mestrado Integrado em Engenharia Informática e Computação Supervisor: Miguel Pimenta Monteiro
Co Supervisor: Bruno Giesteira Co Supervisor: Eduardo Pereira
Maria João Ribeiro Marques
Mestrado Integrado em Engenharia Informática e Computação
Agriculture has been responsible of sustaining and enhancing human life starting at least 105,000 years ago. Nowadays, traditional approaches to farming can be enhanced with technology, helping farmers make more informed decisions when it comes to their farming activities. Information and communication technologies, specifically, mobile phones, are now enabling farmers to improve efficiency and optimize production, while preserving resources.
However, due to limited technological proficiency, a problem emerges. The adoption and acceptance of these solutions are dependent on the skill for handling and understanding digital media and this can be a challenge in specific demographics, where age can be a constraint and access to technology, in rural areas, be scarce.
The aim of this study was to conduct a Human computer Interaction research centred around the potential end-users of a mobile application in the agricultural field. Therefore a User-centred Design methodology was followed, allowing to narrow the scope of the study, from Agriculture in general, to Prevention and Control of the Grapevine moth in Viticulture in the Douro Region of Portugal. In this process, explicit and implicit methods were used, such as Personas, Focus Groups, Individual Interviews, Field Observation and Usability Testing. Farmers and other stakeholders were involved in the all phases of the design process, from requirements gathering, analysis, de-sign and evaluation of the prototypes created. The outcome of this study was to accommodate and support farmers’ needs and expectations while also studying how these users interact with technology.
First and foremost I would like to thank my family and friends for all the support given during my whole academic life.
Secondly I would like to thank Professor Miguel Pimenta Monteiro and Professor Bruno Gi-esteira for guiding me through the process of writing this dissertation. A special thanks has to be given to Eduardo Pereira and all of those at Fraunhofer AICOS who received me with open arms and always made themselves available.
At last but not least, I want to thank all the winegrowers and other members of Casa do Douro that without whom none of this would have been possible and in particular Eng. Anabela Carneiro for her valuable feedback and assistance.
1 Introduction 1
1.1 Context . . . 1
1.2 Motivation . . . 1
1.3 Goals . . . 2
1.4 Report Structure . . . 2
2 Information and communications technologies in Agriculture 3 2.1 mAgriculture . . . 3
2.1.1 mAgriculture Solutions . . . 5
2.1.2 Mobile Applications in the Market . . . 6
2.1.3 Potencial of mAgri . . . 6
2.2 Precision Agriculture . . . 7
2.2.1 History and Technologies . . . 7
2.2.2 Benefits . . . 8
2.2.3 Concerns . . . 9
2.2.4 Adoption . . . 9
2.3 Summary . . . 10
3 User-centred Design 11 3.1 Disciplines surrounding UCD . . . 12
3.1.1 Human-computer interaction . . . 12
3.1.2 Ergonomics . . . 12
3.1.3 Interaction Design . . . 12
3.2 Usability and User Experience . . . 13
3.3 Understanding the user . . . 14
3.3.1 Problem Space . . . 14
3.3.2 Conceptual Models . . . 14
3.3.3 Mental Models . . . 15
3.3.4 Cognition . . . 15
3.4 The Process of Design . . . 16
3.4.1 Requirements . . . 17
3.4.2 Analysis . . . 19
3.4.3 Design . . . 22
3.4.4 Evaluation, Iteration and Prototyping . . . 25
3.4.5 Implementation and deployment . . . 26
4 Methodology 29
4.1 Phase One - Requirements gathering . . . 29
4.1.1 Market Analysis . . . 29
4.1.2 Research sample . . . 31
4.1.3 Research Methods . . . 33
4.1.4 Findings . . . 35
4.2 Phase Two - Analysis . . . 40
4.2.1 Personas and Scenarios . . . 41
4.2.2 Use Cases . . . 42
4.2.3 Hierarchical task analysis . . . 43
4.2.4 Non-functional requirements . . . 46
4.3 Phase Three - Design . . . 46
4.3.1 Material Design . . . 46
4.3.2 HCI4D Guidelines . . . 47
4.3.3 Designing for Older People . . . 49
4.3.4 Context of Use . . . 49
4.3.5 Conflicts . . . 50
4.4 Phase Four - Prototyping and Evaluation . . . 51
4.4.1 Application’s Navigation . . . 51
4.4.2 Low Fidelity Prototype . . . 51
4.4.3 High Fidelity Prototype . . . 57
4.4.4 Evaluation . . . 61
4.5 Summary . . . 65
5 Results and Discussion 67 5.1 Participants . . . 67 5.2 Performance results . . . 68 5.3 Satisfaction results . . . 71 5.4 Observations . . . 72 5.5 Recommendations . . . 75 5.6 Guidelines . . . 77 5.7 Summary . . . 78
6 Conclusions and Future Work 79 6.1 Contribution . . . 79 6.2 Challenges . . . 79 6.3 Future Work . . . 79 References 81 A Market Analysis 87 B Categorizing Activity 101 B.1 Introduction . . . 101 B.2 Goal . . . 102 B.3 Participants . . . 102 B.4 Methodology . . . 102 B.5 Findings . . . 103 B.5.1 Participant 1 . . . 103
B.5.2 Participant 2 . . . 104
B.5.3 Participant 3 . . . 105
B.6 Conclusion . . . 106
C Statistical Data - Portugal and Douro Region 107 C.1 People and Society . . . 107
C.2 Education . . . 109 C.3 Information Society . . . 111 D Script of Interview 113 D.1 Introduction . . . 113 D.2 Warm-up . . . 113 D.3 General questions . . . 114 D.3.1 For Farmers . . . 114 D.3.2 Other stakeholders . . . 114 D.4 Consent Form . . . 115
E Pests and Diseases in Vineyard 117 F Brainstorming Activity 125 F.1 Introduction . . . 125 F.2 Goal . . . 125 F.3 Participants . . . 125 F.4 Methodology . . . 125 F.5 Conclusion . . . 126
G Personas and Scenarios 129 H High-Fidelity Prototype Interface 133 I Usability Testing Protocol 139 I.1 SUS . . . 145
2.1 Mobile cellular subscriptions (per 100 people) in Least Developed Countries: UN
Classification . . . 4
2.2 Personal mobile devices and delivery technologies . . . 5
2.3 mAgri use cases and benefits – the opportunity for mobile . . . 6
2.4 Mobile Apps categories of mobile agriculture apps . . . 7
2.5 Factors affecting attitude to adopt – Ex-Post . . . 9
2.6 Factors affecting attitude to adopt – Ex-Ante . . . 10
3.1 Interaction design process . . . 16
3.2 Overview of scenario-based design (SBD) framework . . . 21
3.3 Relationship between Scenario and Persona . . . 21
3.4 Hierarchical task analysis example for ordering a book . . . 21
3.5 Example taxonomic structure of car controls . . . 22
3.6 Example listing of some of the attributes of each object . . . 22
4.1 Categorizing activity . . . 30
4.2 Findings of Market Analysis . . . 30
4.3 Smartphone adoption in Portugal . . . 32
(a) Google Consumer Barometer - Percentage of people who use a smartphone in Portugal . . . 32
(b) Marktest study of Smartphone adoption in Portugal . . . 32
4.4 Degree of Urbanization - Douro Region . . . 32
4.5 Area per Producer . . . 33
4.6 Vineyards on steep slopes and terraces . . . 34
4.7 Winegrowing Calendar . . . 35
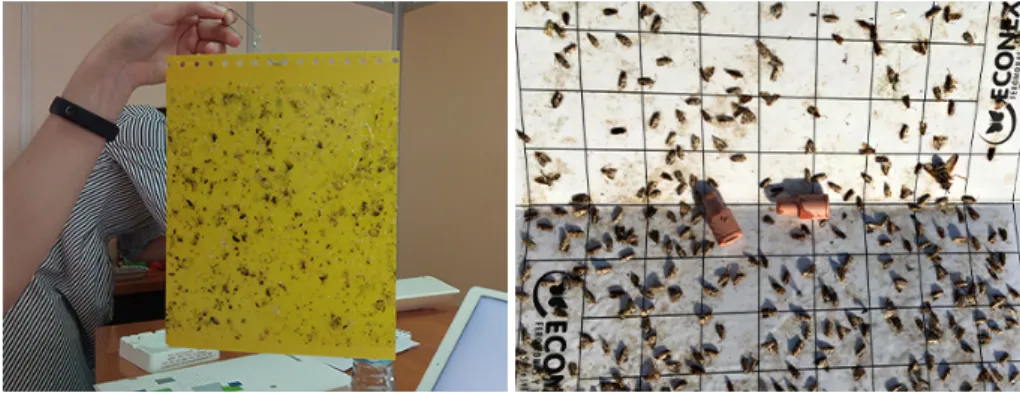
4.8 Two types of traps: Yellow sticky trap and Pheromone trap . . . 36
4.9 Brainstorming activity . . . 37
4.10 Warning displayed at the Parish Council . . . 38
4.11 Morphology of the Grapevine - Adult and Egg . . . 39
(a) Adult Lobesia botrana . . . 39
(b) Viable egg . . . 39
4.12 Damages of 1st, 2nd and 3rd Generation . . . 39
4.13 Pheromone dispenser . . . 40
4.14 Evolution of the scope of the study . . . 41
4.15 Use Cases . . . 44
4.16 Hierarchical task analysis . . . 45
4.17 Thumb Zone Mapping . . . 49
4.19 Prioritisation of common user tasks . . . 51
4.20 Paper Sketches . . . 52
4.21 App Flow - Start . . . 52
4.22 App Flow - Homepage . . . 53
4.23 App Flow - Mapping . . . 54
4.24 App Flow - Prevention . . . 55
4.25 App Flow - Control . . . 56
4.26 Craft in Sketch . . . 62
5.1 Participants during the test . . . 68
5.2 Task completion rates . . . 69
5.3 Total errors and assists . . . 69
5.4 User metrics by task . . . 70
(a) User errors by task . . . 70
(b) User light assists by task . . . 70
(c) User heavy assists by task . . . 70
(d) User total assists by task . . . 70
5.5 Total metrics by task . . . 71
(a) Total errors by task . . . 71
(b) Total light assists by task . . . 71
(c) Total heavy assists by task . . . 71
(d) Total both assists by task . . . 71
5.6 SUS Scores and Sub-scores . . . 72
B.1 Activity Setup . . . 102 B.2 Categorizing by Participant 1 . . . 103 B.3 Categorizing by Participant 2 . . . 104 B.4 Categorizing by Participant 3 . . . 105 B.5 Activity conclusion . . . 106 C.1 Population pyramid . . . 107
C.2 Employment rate, persons aged 20-64 . . . 108
C.3 Working age population . . . 108
C.4 Iliteracy Rate . . . 109
C.5 Share of early leavers from education . . . 110
C.6 Share of persons with tertiary education . . . 111
C.7 Proportion of households with broadband connections . . . 111
C.8 Proportion of people who never used the internet . . . 112
4.1 Problem and Activity Scenarios for Small winegrower . . . 42
4.2 Problem and Activity Scenarios for Medium/Large winegrower . . . 43
4.3 Colour Scheme . . . 58
4.4 Icons intended meaning . . . 59
4.5 Other icons . . . 59
4.6 Design Changes . . . 61
4.7 Usability Test Tasks . . . 64
5.1 Participants . . . 67
5.2 Summary of results . . . 68
5.3 SUS Scores and Sub-scores . . . 71
5.4 Commentaries about each user . . . 75
5.5 Recommendations . . . 77
DDR Demarcated Douro Region
GIS Geographic Information System
GPS Global Positioning System
GSMA Groupe Speciale Mobile Association
GUI Graphical user interface
HCI Human-computer interaction
HTA Hierarchical Task Analysis
hi-fi High Fidelity
ICT Information and communication technology
ICT4D Information and Communications Technologies for Development
ISCE International Standard Classification of Education
ISO Internation Organization for Standardization
IT Information technology
IxD Interaction Design
low-fi Low Fidelity
PA Precision Agriculture
PEU Perceived ease of use
PU Perceived usefulness
RDD Região Demarcada Douro
SSM Site-specific management
SUS System Usability Scale
TAM Technology Acceptance Model
UCD User-centered design
UI User interface
UX User Experience
Introduction
The application of Information and Communications Technology (ICT) in the agricultural sector opened up a whole new world of opportunity. mAgriculture and Precision Agriculture (PA) are based on using ICTs to provide information and data to assist farmers when making site-specific management (SSM) decisions.
1.1
Context
The huge technological improvements in personal electronics made it possible for farmers in rural areas to access real-time information, delivered through devices such as mobile phones and tablets. Farmers are challenged when using these devices due to limited technological proficiency and the way they interact with devices that collect large amounts of data and information will have a direct impact in their farming activities. The adoption of mobile technology in the agriculture sector is dependent of the end-users technological proficiency, so it is necessary to study the existing scenario on the general use of ICTs on the field by farmers, in order to guarantee the success of mobile agriculture applications.
1.2
Motivation
This dissertation was proposed by Fraunhofer Portugal Research Center for Assistive Information and Communication Solutions (Fraunhofer AICOS) and performed there. The project consists on designing a mobile solution adapted to farmers’ needs in rural areas of Portugal.
In Portugal there’s a lack of research literature regarding farmer’s needs and expectations when interacting with mobile agriculture applications, thus it’s relevant to conduct a research, using a user-centred design (UCD) approach within the field of human–computer interaction (HCI) aiming to develop and adapt the ICT system based on the users’ needs as well as the context of use.
1.3
Goals
The ultimate goal is to better understand farmers’ needs and technology acceptances through user research and analysis and it’ll also be necessary to:
• Conduct thorough research on visual aspects to inform the design of graphical user inter-faces (GUIs);
• Develop prototypes that will explore new and efficient methods of visualization and inter-action on Android devices;
• Evaluate concrete designs with real farmers;
1.4
Report Structure
Besides the introduction, this report has four more chapters. Bothchapter 2andchapter 3are part
of the literature review. Inchapter 2it’s possible to take a look into the use of ICTs in Agriculture.
Inchapter 3, the process of user-centred design is presented. Thechapter 4presents the followed
methodology, divided into phases. In order to conduct this study, the UCD methodology will be divided in four major phases:
• Phase One - Requirement gathering: encompasses market analysis of existing solutions, defining the research sample, research methods used and findings.
• Phase Two - Analysis: entails scenarios and personas creation, specification of prototype’s requirements with different levels of abstraction.
• Phase Three - Design: where according to the specified requirements different guidelines and design principles are taken into account in order to support design decisions in the following next phase.
• Phase Four - Prototyping and Evaluation: refers to the creation of low and high fidelity prototypes. In this phase usability tests are performed by real users.
Information and communications
technologies in Agriculture
With the increased use of Information and Communications Technologies (ICTs) in the agriculture field various areas of opportunity arise. This chapter is composed by two main topics:
mAgricul-ture and Precision AgriculmAgricul-ture. Section2.1will address the various types of mobile solutions for
agriculture, examples of those in the market, and the potential of mAgriculture. Section2.2will
address the history of Precision Agriculture, technologies used, the benefits, concerns and drivers of adoption of this management approach.
2.1
mAgriculture
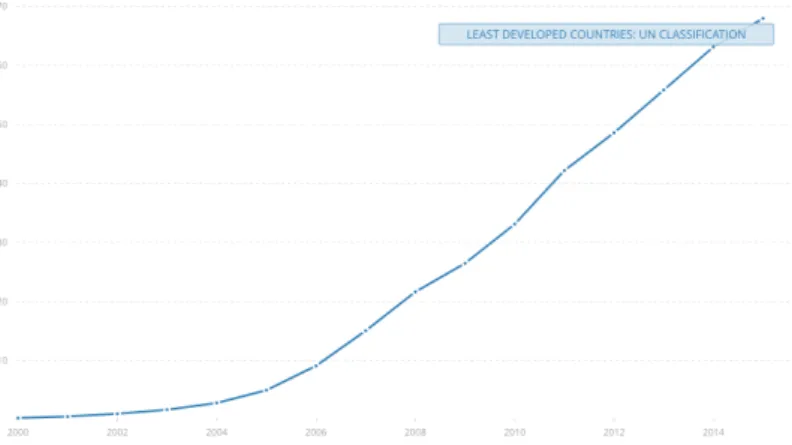
E-Agriculture is an emerging field focused on the enhancement of agricultural and rural develop-ment through the use of ICTs. The mobile phone has become one of the most used ICT devices globally and with the increase of it is penetration in developing countries’ markets, as presented
in Fig. 2.1, there’s an opportunity to impact and empower small holder farmers in rural areas.
Therefore mAgriculture or mAgri is a subset of E-Agriculture and is the research area concerned with the improvement of the economic environment through the use of mobile computing.
Since the introduction of tablets and the higher adoption of smartphones and tablets by farmers,
mAgriculture has also become relevant in developed countries [WEU12]. With the use of mobile
applications it is possible for small holder farmers in rural or underdeveloped areas to have access
to a number of services, from simple tasks like checking the weather [Acc17,Agr16,Bar16] to
more complex ones like pests and disease diagnosis [Esp16,PEA17].
It is important to understand the context in which mAgri has evolved and adapted to user’s
needs. Some mAgri solutions rely on Short Messaging Services (SMS)2 or Unstructured
Sup-plementary Service Data (USSD) protocols [air15], sending brief messages to communicate with
1http://data.worldbank.org/indicator/IT.CEL.SETS.P2?end=2015&locations=XL&start=
1960&view=chart
Figure 2.1: Mobile cellular subscriptions (per 100 people) in Least Developed Countries: UN
Classification1
farmers. These require less bandwidth, making them less expensive than a phone call but are
lim-ited by other factors such as low literacy and lack of knowledge [WSC+16]. SMS compared to
USSD can have a higher cost and be a slower service and also has a restriction on the number of
characters [Ira10]. Other solutions rely on Interactive Voice Response (IVR)3. This can be a great
way to overcome the obstacle of illiterate users. All these technologies can be combined and some proposed solutions encompass SMS, USSD and even IVR all in the same service, while other ser-vices evolve and adapt to their costumers’ needs, like the Airtel Kilimo service that evolved from
a SMS & IVR solution to USSD only [air15].
Even though mAgri services are supposed to empower smallholder farmers it’s hard to do so if farmers aren’t aware those services or if they do not know how to interact with them. A
research study conducted in rural Kenya [WSC+16] indicated that novice or low-literate users
preferred making voice calls rather than sending text messages due to their limited technological proficiency. Other variations of mAgri services are the use of call centres and video calls to better instruct farmers. Even more advanced, and something developed countries are investing more
on, is the mobile web4 and installable applications [Ava13], these allow infinite possibilities of
integration with other devices and technologies and provide a much more sophisticated interaction.
Findings from another research [GWO+16] conducted in Kenya involving 56 farmers
evalu-ating an mAgri application that contained SMS, Voice and web-based components indicated that all the interviewed farmers mentioned that the delivery platform (i.e., IVR, USSD, SMS) would determine if they would use the system, being SMS the preferred mode of interaction. Therefore several external factors should be taken into account when developing ICT solutions for farm-ers, for instance access to electricity, network coverage, users education level, cultural, social and
gender constrains [M+16]. The choice of technology should be adapted to the users needs, kind
3http://farmerline.co/
of devices they have access to (see figure 2.2 relating mobile phone type to technologies) and
capabilities [GWO+16].
Figure 2.2: Personal mobile devices and delivery technologies [HGWH13]
2.1.1 mAgriculture Solutions
The GSMA mAgri Programme5was founded in 2009 and works with the mobile operators, who
are members of the GSMA, together with agricultural organizations and development organiza-tions to look at where mobile technology can bring benefits to the agriculture sector. GSMA
proposes [Int15b] that mAgri solutions should be divided into three categories:
1. Agricultural value added services (Agri VAS) — These consist of machine-to-human interaction and are delivered through SMS, USSR, helplines, interactive voice responses (IVR) and, increasingly, by web and mobile applications. Even though farming is one of the main drivers of the economy in developing countries there’s a key challenge that arises, the productivity level of farmers in developing countries is lacking when compared to that of developed countries.
2. Machine-to-machine (M2M) — This category is, as the name indicates, related to tech-nology that coordinates multiple machines, devices and appliances connected via commu-nication channels. This category features devices like smartphones or tablets and Precision Agriculture is an example of an application of M2M in agriculture (this concept is covered
in detail insection 2.2) [Int15a].
3. Mobile financial services tailored for the agricultural sector — This third category con-sists of solutions in Agri MFS (Mobile financial services), combating farmer’s financial
exclusion. Some farmers in developing countries don’t have access to a bank account and they should be able to have loans, savings, insurance.
Figure 2.3: mAgri use cases and benefits – the opportunity for mobile [WEU12]
2.1.2 Mobile Applications in the Market
Mobile agriculture applications fall in many different categories. A study published in 2012 by Gary Woodill and Chad Udell from Float Mobile Learning focused on applications (apps) devel-oped for the agriculture industry in Canada and the United States and compiled a list of 60 apps
and grouped them in 9 distinct categories, as shown in figure2.4.
Contrasting with GSMA’s mAgri Programme, that is focused in developing mobile solutions to impact smallholder farmers, this report only collected and analysed solutions developed for the Canada and North America’s market, therefore, developed regions.
2.1.3 Potencial of mAgri
Nowadays most solutions for mAgri encompass technology that is easy to use and not very sophis-ticated, using more common phones with a lower price point. The success rate of using Voice/IVR, SMS or USSR protocols in developing countries is higher when compared to rich media, like in-stallable applications, because of constraints like purchasing power and technological proficiency
of the users [T+16].
“The number of potential Agri VAS users using rich media services will increase by
2020, accounting for approximately 60% of total potential VAS users.” [T+16]
Rich media services, are the future of mAgri. With declining prices of smartphones in emerging
Figure 2.4: Mobile Apps categories of mobile agriculture apps [WEU12]
such as sensors and making it possible for small farm holders to optimize their production and increase their yield.
2.2
Precision Agriculture
The concept of Precision Agriculture, sometimes called Precision Farming, originated in the mid 80s and was made possible by the development of information technology and remote sensing. A traditional management approach to farming would be to perform a particular task, such as harvesting, against a predetermined schedule. Now with PA, by using site-specific knowledge, it is possible to access and control in real-time data on weather, soil, air quality and therefore make smarter decisions and assist farmers in making the right decisions at the right time.
PA provides a way to automate Site-specific management (SSM), which can be defined as "electronic monitoring and control applied to data collection, information processing and decision
support for the temporal and spatial allocation of inputs for crop production." [PSLDS97], using
information technology (IT). SSM can be described as the idea of doing the right thing, at the right
place, at the right time [BLD04].
2.2.1 History and Technologies
The idea of collecting data to inform decision making has been around for a long time, but
inte-grating technology with this process is somewhat recent [Bra]. In the past, the size of farms made
possible to work around the problem of within field variability because farmers had the capacity to manually adapt to the temporal and spatial variability of the plot. But as farms became larger and
processes became mechanized, it was necessary to create a solution to combat soil heterogeneity
and manage variability of nutrients, seeding rate, weeds and other inputs [Bra].
According to David Franzen and David Mulla’s brief review of PA history [Z+15] this research
began in the early 1920s, using as a foundation small fields and resulting in the first published study by Linsley and Bauer, dating back to 1929, that recommended soil sampling to address this problem. This evolved to self-propelled fertilizer application equipment and by 1938 [Salter, 1938] various machines were available to farmers. Following the authors’ findings, to process the data generated from sampling required a computational power that at that time was not enough, but nowadays with technological advances in Geographical Information Systems (GIS), it is possible to keep precise information about crops, such as soil type and nutrient levels, providing techniques needed for data visualization and interpretation of particular field locations, with the production
of maps6.
Later in 1993 the introduction of GPS and GPS receivers led to the breakthrough of PA7.
Previously only available for military uses, GPS was opened for civilian application, allowing to perform unbiased sampling performed in a random order from unusual areas, rather than taking into account specific locations and distances. Nowadays these network of satellites also help with
Automated steering systems that help reduce human error8.
GPS receivers combined with yield monitors and with Variable Rate Technologies (VRT) al-lowed the monitoring and mapping of yield variations within fields and the ability to apply inputs (seeds, herbicides, pesticides) at varying rates, depending on the exact variations of factors such
as soil nutrients, type, among others9.
2.2.2 Benefits
The obvious benefits of PA are allowing the monitoring and control of various parameters, in real time and making remote accessing possible. Besides these benefits the main ones are increase of profitability, and sustainability.
One of the most relevant benefits is how PA can be a positive factor to the environment, by reducing losses from excess applications due to nutrient imbalances and also reduction in pesticide resistance development. It has been proven that PA, by using site-specific knowledge, should reduce environmental loading, that being by applying fertilizers and pesticides in a more targeted
way, only where and when they are needed [BLD04].
Profitability of PA is difficult to predict and we can conclude that because precision farming
practices are site-specific, profitability potential is also site-specific [SLD98]. For instance the use
of VRT is highly profitable in some areas of the world and when used on certain crops and, in others, it doesn’t even cover the costs.
6https://www.gislounge.com/use-gis-agriculture/ 7http://www.agriprecisione.it/wp-content/uploads/2010/11/general_introduction_ to_precision_agriculture.pdf 8http://www.gps.gov/applications/agriculture/ 9http://w3.ufsm.br/projetoaquarius/index.php/en/the-project/ precision-agriculture-history
2.2.3 Concerns
Some of the main concerns that come up with the use of PA are the high costs of implementation and keeping up with advancing technology and return on investment. Regarding farm-level data generated by PA, the biggest issues most frequently identified by the users were interpreting the
data, privacy, ownership, and accuracy of the data [CLL15].
Several factors such as “cultural perception, infrastructure, institutional constraints, knowledge
and technical gaps” [KL15] are also some of the major obstacles to the adoption of PA.
The degree of digital literacy of the end-user makes the use of PA much harder in rural, remote or underdeveloped areas, and therefore, is important to develop PA tools using user centric design approach, with the users’ requirements in consideration.
2.2.4 Adoption
Both benefits and concerns of PA will facilitate or inhibit the adoption of ICTs in the agricultural sector.
A literature review [PCPC13] of the drivers of PA technologies adoption, identified the key
drivers that affect the intention to adopt tools available for PA management. The review was divided in an ex-post and ex-ante context, being ex-post Latin for "after the fact" and ex-ante, the opposite, meaning "before the event".
Ex-post studies demonstrated the motives or reasons that encouraged and were still encourag-ing farmers to adopt PA technologies. The most cited parameter was the size of the farm, where the intention to adopt was greater when the size of the farm was bigger. The second most important driver was the adopter’s confidence with computers.
Figure 2.5: Factors affecting attitude to adopt – Ex-Post [PCPC13]
The ex-ante studies were predictive investigations that revealed which drivers could affect the potential user’s behaviour before a decision was made to use, or not to use, a new PA technol-ogy. They allow the analysis of acceptance of new technology prior to their introduction. These indicated that increasing profitability was the main motivation that stimulated the use of new tech-nology. In the approach of the Technology Acceptance Model (TAM), used to explain the process of adopting new technology, there is a construct named Perceived Usefulness (PU) that relates to
this issue is defined as “the degree to which a person believes that using a particular system would
enhance his or her job performance” [Dav89]. Another relevant factor is the Perceived Ease of
Use (PEU), “the degree to which a person believes that using a particular system would be free of
effort” [Dav89].
Figure 2.6: Factors affecting attitude to adopt – Ex-Ante [PCPC13]
2.3
Summary
With the use of ICT solutions farmers can nowadays have access to information that will support their decision making process. There are several applications in the market which rely on different choices of technologies to support different user needs. mAgriculture is a research area focused on enhancing rural development by using ICT solutions that provide different functionalities, some rely on SMS or USSD protocols while others rely on more complex systems, such as, installable applications.
Precision Agriculture provides many benefits such as increase of profitability and sustainabil-ity, by using site-specific knowledge using sensors and other technologies.
In order to develop software that is going to be adopted and accepted by users it is necessary to design with them at the centre of the process. The next chapter focuses on literature review on the user centred design methodology.
User-centred Design
There are a number of interaction design methodologies but only a certain number pursue a user-centred philosophy and one of the most widely used is the also known as User-Centred Design
(UCD) [AMkP04]. UCD is an approach within the field of HCI (see 3.1.1) that deals with the
development of a system always focusing, during the design process, on the wants, needs and limitations of the users. User can be a very broad term, but one of the most obvious interpreta-tions is the person who interacts directly with a product to perform a task. There are many other interpretations, where some include those who test the product, who manage direct users, etc.
[HJ93]. Another one may be primary (frequent hands-on users), secondary (occasional users) and
tertiary (affected by the system or purchase influencer) users [Eas87]. Stakeholders are “people or
organizations who will be affected by the system and who have a direct or indirect influence on
the system requirements” [KS98], and that includes end-users, the formal client who orders the
product, the development team or others.
According to a partnership between Frog Design Inc. and GSMA, that focused on unlocking
the rural market with UCD [Wes14], farmers have a hard time trusting mobile services and relying
on them for tips on how to run more efficiently their practice.
“Only 25% of registered farmers on Mobile Agriculture product use the service more
than once” [Tse15]
They have a hard time because their livelihood for a season depends on 2 to 3 chances during a whole year to profit from a harvest and if they listen to the wrong advice that can jeopardize their business. UCD is one step to earn that trust, constituting a great methodology to follow when centred around costumers that are harder to reach. Investing in design has been proven to outperform businesses that don’t integrate design in their life cycle.
“Results show that over the last 10 years design-led companies have maintained sig-nificant stock market advantage, outperforming the S&P by an extraordinary 228%.”
[Wes14]
UCD is not only about focusing on making products with better usability and user experience, but about innovating and having an impact in the world, creating awareness for the product and
subsequent adoption and making sure that even after deployment the product will continue to be improved.
Gould and Lewis [GL85] state that three principles should be followed in order to lead to a
“useful and easy to use computer system”:
• “Early focus on users and tasks” — studying and observing them and involving the users since the beginning of the design process;
• “Empirical measurement” — recording and analysing users’ performance and reaction; • “Iterative design” — when problems are encountered, fix them and continue testing. These principles are timeless and now accepted as the basis for a user-centred approach
[PSR15].
3.1
Disciplines surrounding UCD
3.1.1 Human-computer interactionHuman-computer interaction (HCI) is an interdisciplinary field that is defined as “a discipline concerned with the design, evaluation and implementation of interactive computing systems for
human use and with the study of major phenomena surrounding them.” [DFAB03]. It has become
an umbrella term that encompasses diverse disciplines.
HCI is a subset of usability (see 3.2) and focuses on how humans interact with computing
products while UCD is a methodology used to ensure that the products meet the users’ needs
[Low13].
3.1.2 Ergonomics
The International Ergonomics Association establishes that “Ergonomics is the scientific discipline concerned with the understanding of interactions among humans and other elements of a system, and the profession that applies theory, principles, data and methods to design in order to optimize
human well-being and overall system performance.”1
Ergonomics is traditionally a study of the physical characteristics of interaction [DFAB03], is
a field closely related to HCI but distinct, and helps constraining the design of systems based on user performance and the role of the interface in that performance. It goes from how controls are designed to the physical environment in which the interaction takes place.
3.1.3 Interaction Design
Interaction Design (IxD) is about “designing interactive products to support people in their
ev-eryday and working lives” [PSR15]. Winograd [DM97] described it as “the design of spaces for
human communication and interaction”. IxD encompasses academic disciplines like engineering, informatics, amongst others and also design practices such as graphic design and product design. HCI is an area of study opposed to IxD, a design craft that deals with interaction, not necessarily being specific to computers.
The process of interaction design goes through the identification of user needs, developing alternative designs to fit these, building interactive prototypes that can be communicated and as-sessed, and evaluating throughout this process what is being built and the user experience it offers.
3.2
Usability and User Experience
UsabilityNowadays it’s common to hear the term “user-friendly” to connote ease of use and interaction, but “in reality, different users have different needs, and a system that is “friendly” to one may feel
very tedious to another” [Nie94]. Usability is considered by Jakob Nielsen as a multi-dimensional
property that refers to how easy interfaces are to use2defined by five quality components [Nie94]:
• Learnability — a system should be easy to perform basic tasks by a first time user; • Efficiency — once the user has learned the system he should be able to be highly productive; • Memorability — after a period of inactivity a user should be able to pick up easily and
re-establish proficiency;
• Errors — the system should have a low error-rate and allow users to easily recover if they make errors;
• Satisfaction — the system should be pleasant to use.
“if the system forces the user to adopt an unacceptable mode of work then it is not
usable” [DFAB03]
Users should not only find a system efficient and effective, they should also want to use it, and that comes with the development of interactive products that ensure usability, and most im-portantly, that measure it.
User Experience
User Experience (UX) is defined by Don Norman and Jakob Nielsen through the sentences: “The first requirement for an exemplary user experience is to meet the exact needs of the customer, without fuss or bother. Next comes simplicity and elegance that produce products that are a joy to own, a joy to use. True user experience goes far beyond giving customers what they say they
want, or providing check-list features. In order to achieve high-quality user experience in a com-pany’s offerings there must be a seamless merging of the services of multiple disciplines, including
engineering, marketing, graphical and industrial design, and interface design” [NN].
UX and usability should be distinguished, the latter term being a quality attribute of the UI, related to how easy a system is to use, how efficient and so forth. UX is an even broader term, related to how the person feels when using a product. Some examples of those feelings can be excitement, fun or aesthetic pleasure.
3.3
Understanding the user
3.3.1 Problem Space
In order to solve any problem it’s necessary to understand the problem space, therefore ask what,
why and how [PSR15]. Identifying usability and user experience goals are a part of that process,
being those of an existing product, how it can be changed or improved, or those of a new one. Having a good understanding of the problem space can help inform the design space what kind of interface, behaviour and functionality to provide.
3.3.2 Conceptual Models
When designing a system is crucial to, in the early stages, understand and conceptualize the user experience. It’s necessary to have a good understanding of the problem space, meaning what you want to create, why and how it will support users in the intended way. A conceptual model is “a
high-level description of how a system is organized and operates.” [JH02]. It helps to outline what
people can do with a product and what concepts are needed to understand in order to interact with it. Thus it includes all concepts exposed to the user and the sequence of operations performed to complete a task.
The better the conceptual model matches the user’s existing mental models the better the user experience will be.
3.3.2.1 Metaphors
Metaphors can be used to convey the understanding of how an interface works and help users
interaction. They provide a way to teach new concepts and familiarise the user [DFAB03], helping
them understand the underlying conceptual model [PSR15]. They should be used with this purpose
but sometimes can have negative effects, being important to understand when the use of a metaphor breaks design principles.
3.3.2.2 Interaction types
There are different ways a person interacts with a product and Jenny Preece, Helen Sharp and
Yvonne Rogers [PSR15] propose there are four different types of interaction that are not meant to
be mutually exclusive nor meant to be definitive.
• Instructing — issuing commands using keyboard and function keys and selecting options via menus;
• Conversing — interacting with the system as if having a conversation;
• Direct Manipulation — interacting with objects in a virtual or physical space by manipu-lating them;
• Exploring — moving through a virtual environment or a physical space.
3.3.3 Mental Models
Mental models can be described as internal constructions of reality made by the mind that it
uses to anticipate events, describing the user’s view of how things work [Cra43]. The difference
between conceptual models and mental models is that conceptual models are “devised as tools for
the understanding or teaching of physical systems” [RB88] and mental models are “what people
really have in their heads and what guides their use of things” [RB88].
3.3.4 Cognition
Interacting with technology involves a lot of cognitive processes. Cognition can be distinguished
between two general modes [Nor93]: Experiential Cognition, a state of mind in which we perceive,
act and react to events around us effectively and effortlessly (e.g. driving a car), and Reflective Cognition that involves thinking, comparing, and decision-making (e.g. learning or writing).
3.3.4.1 Cognition Processes
Some of the processes that affect behaviour are:
• Attention — Information structure at the interface that better captures user’s attention, e.g. use of perceptual boundaries, colour and sound.
• Perception and recognition — Perception refers to how information is acquired. Obvious implication is to design representations that are readily perceivable, e.g. text should be legible and icons should be easy to distinguish and read.
• Memory — Humans recognize things better than recalling, for instance we’re better at remembering images than words. Interfaces should help people remember essential in-formation, promoting recognition rather than recall. Memory involves encoding and then
retrieving of knowledge. Context is important when it comes to memorization, sometimes it can be difficult to recall information encoded in a different context.
• Reading — Reading can be quicker than speaking or listening but some users avoid reading
[CR87]. It’s easier to recognize word shapes and because lower-case words have more
distinct shapes, they are quicker to read.
3.4
The Process of Design
According to Alan Dix et al. [DFAB03] there are four main phases plus an iteration loop relating
to the design of interaction, represented in Figure 3.1. The first being the “What is wanted”
- requirements phase (3.4.1), then the “Analysis” phase (3.4.2), after that the “Design” phase
(3.4.3), a loop of “Prototype” - evaluation, iteration and prototyping phase (3.4.4) and finally the
“Implement and deploy” phase (3.4.5).
Figure 3.1: Interaction design process [DFAB03]
Life cyle models
It’s important to have an understanding about how the design process can fit in the software de-velopment process. Life cycle models help show how activities are related to each other, as they are management tools and simplified versions of reality. Traditional models are more adequate for smaller teams, providing a simple process, in contrast to larger systems that need a more detailed and sophisticated model. Here are a few of these models:
• Waterfall Model — In software engineering this model was the basis of many develop-ment cycle in use nowadays. This traditional view consists of a number of processes in a sequential fashion.
• Spiral Model — The Spiral Model [Boe88] takes into account prototyping throughout the
design process. The spiral process follows the main stages described in the Waterfall Model, but does it iterating several times, checking and evaluating ideas and enabling risk analysis.
• The Star Model — The Star Model [HH89] also features an iterative nature, but with Evaluation at the centre stage of activities. There’s also a lack of ordering, making it possible to go from each activity to the other, provided you go through Evaluation in the process. This model is a reflection of empirical studies conducted on how designers went about their work.
3.4.1 Requirements
Requirements are obtained through data gathering and data collection with the help of certain techniques and activities to get a better understanding of users’ needs. Conventionally,
require-ments can be divided into two types, functional and non-functional [Ben10]. According to Benyon
functional requirements relate to what the system must do while non-functional requirements are a quality that the system must have and these include for instance usability, aesthetics and cultural acceptability.
3.4.1.1 Research Methods
In order to capture requirements it is important to understand users and conduct user research. To define the research goals, a look should be taken at the existing issues that should be presented as goals. After, these goals should be prioritized and finally rewritten as questions to be answered
[GKM12].
There are several methods of design research, and according to Dan Saffer [Saf09] these can
be roughly divided into three categories: observations, interviews and activities, where the later one includes subjects performing and self-reporting their activities.
Observations
Observing what people do can be one of the most elucidating methods of design research. Subjects can be observed without any interference from the designer or with interaction, like asking them questions about what they are doing and most importantly, why. Some ways of doing observations include:
• Fly on the wall — unobtrusively observing users’ behaviour on location [Saf09].
• Shadowing — following subjects while they go about their daily activities [Saf09].
• Undercover agent — by posing as a normal person in an environment it’s possible to
ob-serve people interacting as they naturally would [Saf09].
• Ethnography — a form of observation deriving from anthropology [DFAB03].
Ethnogra-phers observe users in their natural environment, making it possible to analyse the behaviour of individuals in the context of use. This process can take hours to months and the goal of
this observation is to collect data that’ll influence the interface design process [SP03]. Com-pared to other approaches to data gathering Ethnography has the aim of observing without
“imposing any a priori structure or framework upon it” [PSR15].
• Contextual inquiry — also studies the user in context but it differs from pure ethnographic study due to the intention: “the intention is to understand and to interpret the data gathered, and rather than attempting to take an open-ended view, the investigator acknowledges and
challenges her particular focus” [DFAB03]. This is a variation on shadowing because the
subjects are asked questions [Saf09];
• Participatory Design — in this approach the user comes out of their work situation, either mentally or physically and becomes apart of the design team, entering into the subjective
experience of the workplace [DFAB03].
Interviews
Talking to users and hearing their stories can provide a great insight into their experiences and attitudes but can also be dangerous when performed alone because what people say and do are
typically very different [Saf09].
• Directed storytelling — asking subjects to talk about how they performed an action or their
experience in a specific time [Saf09].
• Focus group — by assembling a group of representative users in the same group can be helpful to gain a consensus view and to get a better understanding about areas of conflict.
• Unfocus group — a variation of Focus groups, developed by IDEO3where extreme people
passionate about the product/service are brought together allowing to explore the subject
from different viewpoints [Saf09].
• Role playing — consists of acting out different scenarios by a group or individual in order
to perceive how a subject/product/system affects users’ emotions and attitudes [Saf09].
• Extreme-user interviews — another method created by IDEO4requires interviewing
peo-ple on either extreme of the spectrum, not only the big broad mainstream [Saf09]. This
method is used to spark creativity and spur new thinking.
Activities
In design research, doing activities allows designers to go beyond observing and talking to sub-jects. There are a number of activities proposed by different authors and each can be a great tool
3http://www.ideo.org/
depending on the project and design goals. Collaging5and drawing6are creative activities, allow-ing subjects to be more involved by makallow-ing and explainallow-ing their creations and allowallow-ing designers
to get a better understanding of their values and thought process. Card sorting7 can also be a
quick and easy method of understanding, by having concepts written or printed on cards and the participant arranging, grouping, categorising or organizing them.
Self Reporting
With this approach subjects, without the direct involvement off designers, record their activities and thoughts, allowing them to feel more comfortable and less embarrassed, and then the re-searcher collects and analyses the findings
• Journals — the subject journals particular activities [Saf09].
• Beeper studies — the subject is given a beeper and when the designer sets it off during the
day the subject records on a journal what they were doing at the time [Saf09].
• Photo/video journals — the subject is given a camera and is told to document his life or
for instance to take a picture of people in his trust-circle or who influence him8.
Other data gathering techniques for establishing requirements are the use of questionnaires,
studying documentation and researching similar products [PSR15]. Questionnaires can be made
up off open-ended or close-ended questions and therefore can be a more qualitative or quantitative technique, depending on what is pretended. Studying documentation is a technique that doesn’t require the involvement of stakeholders and can be a good source of data about steps and regula-tions governing a task. Lastly, researching similar products can be helpful to get a better insight on features and interactions already provided in the market and to prompt requirements.
3.4.2 Analysis
The results from the methods and activities previously referenced need to be analysed in order to bring out key issues that’ll guide the Design Phase.
3.4.2.1 Scenarios
According to Alan Dix et al. [DFAB03] Scenarios are stories or narratives of interaction and
they’re perhaps the simplest design representation. They can be very powerful and can go from a simple description to a full on script describing the situation or context of interaction. Scenarios can also be augmented by sketches, storyboards or other mock-ups and force the developing team to act out potential patterns of use and to anticipate possible problems that could be encountered
5http://www.designkit.org/methods/25 6http://www.designkit.org/methods/49 7http://www.designkit.org/methods/24 8http://www.designkit.org/methods/65
later on. There are other applications for scenarios, for instance telling stories in a natural way allows stakeholders to get a better understanding of users, with the use of non-technical vocabulary
and phrasing, and be more participative in the development process [PSR15].
“The basic argument behind scenario-based methods is that descriptions of people using technology are essential in discussing and analysing how the technology is (or could be) used to reshape their activities. A secondary advantage is that scenario
descriptions can be created before a system is built and its impacts felt.” [RC01]
Rosson and Carroll (2002) [RC01] explain an approach that illustrates the use of scenarios within
a usability engineering framework. Distinct types of scenarios are illustrated in Fig.3.2, showing:
• Problem Scenarios — these tell the story about how users currently engage in their activ-ities and enumerate what features of the current situation have an important consequence. They do not necessarily “emphasize problematic aspects of current practices, but rather [...]
describe activities in the problem domain.” 9;
• Activity Scenarios — after the staring point provided by problem scenarios, activity sce-narios are related to how the user could possibly be doing their activities, “maintaining or even enhancing the positive consequences for the actors while minimizing or removing the
negatives” [RC12].
• Information and Interaction Design Scenarios — “After completing the claims analysis, the goal of information design is to specify representations of a task’s objects and actions that will help users perceive, interpret, and make sense of what is happening. The goal of interaction design is to specify the mechanisms for accessing and manipulating the task
information and activities.”10
3.4.2.2 Personas
Related to scenarios it is also possible to define personas. A persona is an invented person used to represent a type of user inserted in a scenario. Assigning to each persona a name, face, personality and possibly other information, allows to talk concretely about a potential end-user. These can be very helpful. The difference between Scenarios and Personas is that the first one describes the use of a product or an activity to achieve a goal, while the latter characterizes a typical user, defining
who the story is about, their main motivations, goals and pain points (see Figure3.3).
3.4.2.3 Task Analysis
Task Analysis can contribute to the statement of requirements when creating a new system or can help in the production of training materials and documentation when existing systems are
analysed. Alan Dix et al. [DFAB03] describe three different approaches to task analysis:
9http://ldt.stanford.edu/~gimiller/Scenario-Based/ProblemScen.htm
Figure 3.2: Overview of scenario-based design (SBD) framework [RC12]
Figure 3.3: Relationship between Scenario and Persona11
• Task decomposition — “which looks at the way a task is split into subtasks, and the order in which these are performed”. Hierarchical task analysis (HTA) is an technique that provides an understanding of the tasks users need to perform to achieve a certain goal and can be
recorded in a tree diagram or a textual outline format (see Figure3.4).
Figure 3.4: Hierarchical task analysis example for ordering a book12
11https://www.smashingmagazine.com/2014/08/a-closer-look-at-personas-part-1/ 12http://www.uxmatters.com/mt/archives/2010/02/hierarchical-task-analysis.php
• Knowledge-based techniques — “which look at what users need to know about the objects and actions involved in a task, and how that knowledge is organized”. Through the creation of taxonomies about the object used during a task and the actions performed against it it’s possible to get a better understanding of the knowledge needed to perform a task (see
Figure3.5).
Figure 3.5: Example taxonomic structure of car controls [DFAB03]
• Entity–relation-based analysis — “is an object-based approach where the emphasis is on identifying the actors and objects, the relationships between them and the actions they
perform” (see Figure3.6).
Figure 3.6: Example listing of some of the attributes of each objects [DFAB03]
3.4.3 Design
After gathering requirements and analysing them it’s time to design. This process can be guided by a set of abstract and more specific design rules. Principles are the most abstract, “providing
generic knowledge about good design” [DFAB03] and standards and guidelines are more specific,
having standards the highest authority. Heuristics and golden rules help design principles and advice to be assimilated by the designer.
3.4.3.1 Design Principles
Design Principles are abstractions created for designers to think about different aspects of design
• Visibility — The more visible a feature is the more likely the user will be able to know what to do.
• Feedback — Information should be sent back to the user to make him aware of what action was performed and what was accomplished, that being with sound, highlighting, animation or a combination of these for instance.
• Constraints — Constraints are important to restrict possible actions and help preventing the user of selecting incorrect options.
• Mapping — An example of good mapping is the relation between the up and down arrows on the keyboard having the effect of the up and down movement of the cursor. It’s also important to take into account the mapping of the relative position of controls.
• Consistency — Interfaces designed to have similar operations should use similar elements for similar tasks, making the system easier to use.
• Affordance — Is used to refer to an attribute of an object that allows people to know how to use it.
3.4.3.2 Standards
The International Organization for Standardization (ISO) has developed standards for HCI and usability. ISO 9241 is a standard relating to “Ergonomics of Human-System Interaction”, it first appeared in the 1980s and nowadays covers the best practices or definitions from Software
Er-gonomics to Workplace ErEr-gonomics13. “ISO 9241-11: Guidance on Usability” defines usability
as “The extent to which a product can be used by specified users to achieve specified goals with
effectiveness, efficiency and satisfaction in a specified context of use”14. This standard
empha-sizes that usability is dependent on the context of use, it includes an explanation on how to specify and evaluate the usability of a product and on how to measure user satisfaction and performance.
3.4.3.3 Guidelines
There is a vast number of published guidelines for interactive system design, and we can see that the more abstract the guideline is the more it resembles a design principle. Also the more specific
the guideline is, the more it suits detailed design [DFAB03]. Specifically for android development,
developers are provided with a set of Material Design guidelines15that account for motion, style,
layout and a number of aspects that help guiding designers.
13http://www.uxbooth.com/articles/what-on-earth-is-iso-9241/ 14https://www.iso.org/obp/ui/#iso:std:iso:ts:20282:-2:ed-2:v1:en 15https://material.io/
3.4.3.4 Golden Rules and Heuristics
Design rules provide a simpler way for designers to commit and track down guidelines and
prin-ciples [DFAB03]. Golden rules and heuristics can be used during the design phase or during
evaluation, and sometimes in both.
Shneiderman’s Eight Golden Rules of Interface Design
Shneiderman’s eight golden rules are an example of key principles of interface design that can be applied both during the design and the evaluation phases.
1. “Strive for consistency in action sequences, layout, terminology, command use and so on.” 2. “Enable frequent users to use shortcuts, such as abbreviations, special key sequences and
macros, to perform regular, familiar actions more quickly.”
3. “Offer informative feedback for every user action, at a level appropriate to the magnitude of the action.”
4. “Design dialogs to yield closure so that the user knows when they have completed a task.” 5. “Offer error prevention and simple error handling so that, ideally, users are prevented from
making mistakes and, if they do, they are offered clear and informative instructions to enable them to recover.”
6. “Permit easy reversal of actions in order to relieve anxiety and encourage exploration, since the user knows that he can always return to the previous state.”
7. “Support internal locus of control so that the user is in control of the system, which responds to his actions.”
8. “Reduce short-term memory load by keeping displays simple, consolidating multiple page displays and providing time for learning action sequences.”
Norman’s Seven Principles for Transforming Difficult Tasks into Simple Ones
In the book “The Design of Everyday Things” [Nor11] Norman summarizes UCD using the
fol-lowing principles:
1. “Use both knowledge in the world and knowledge in the head.” 2. “Simplify the structure of tasks.”
3. “Make things visible: bridge the gulfs of Execution and Evaluation.” 4. “Get the mappings right.”
6. “Design for error.”
7. “When all else fails, standardize.”
3.4.4 Evaluation, Iteration and Prototyping
3.4.4.1 Prototyping
In order to test the system that is going to be developed, drafts are created with different levels of complexity and interaction. These can be divided in two main categories:
• Low Fidelity Prototypes — enable a fast way to test prototypes due to their low complexity,
and “range from a series of hand-drawn mock-ups to printouts”[Pro]. They provide limited
interaction but allow to quickly create alternate versions and for users to easily suggest changes.
• High Fidelity Prototypes — are much more realistic when it comes to interaction and because they are more robust they are “much more effective in collecting true human
per-formance data” [Pro].
3.4.4.2 Evaluation
After gathering the system’s requirements it’s time to test them to ensure they behave as expected by the users. Evaluation should occur during the design life cycle, making iterative redesign possible.
Taking time and money to invest in making more usable products can make traditional man-agers and engineers sceptical, but there are many papers with evidence supporting that usability
testing can pay off [BM05]. Economic analyses showed not only the benefits of spending money
in usability, concerning costs reduction, client’s satisfaction and user efficiency and productivity
[Kar94], but also the improvement in productivity when designers kept usability in mind since the
beginning of the design process [Lan95].
Evaluation through expert analysis
It can be difficult to evaluate a design from an incomplete design or prototype and it can be costly and time consuming to conduct usability testing with users. A great complement to tests that require user involvement is conducting tests with experts. The goal of these tests are to detect cognitive principles that are violated and also to ignore accepted empirical results. Different eval-uation approaches and methods can be combined to achieve better results.
Some of the methods of evaluation used are:
• Cognitive walk-through — is task-specific and is used to identify how easy it is for new users to accomplish tasks in the system.
• Heuristic Evaluation — heuristics are “broad rules of thumb and not specific usability
guidelines” [Nie95]. The most popular being the 10 Usability heuristics developed by Jakob
Nielsen. These resulted in a study of 249 usability problems. • Model-based Evaluation
– GOMS — the GOMS model “predicts user performance with a particular interface
and can be used to filter particular design options” [DFAB03]: GOMS stands for Goals
(eg. send an email), Operators (eg. double click), Methods (recalling what to do/how to do) and Selection Rules (deciding which method to use to achieve the goal). – Keystroke-Level Model — predicts how long it takes for an expert user to perform
and accomplish a routine task without any errors.
– Fitt’s Law — Fitts’ Law [Fit54] “predicts the time it takes to reach a target using a
pointing device” [PSR15].
• Using previous studies in evaluation — a final approach is to support or refute aspects of the design based on previous studies by reviewing relevant literature based on the design
under consideration [DFAB03].
Evaluation though user participation
While the previous approaches centred around experts, this approach centres around the user. • Styles of evaluation
– Laboratory studies — done in a controlled environment, user’s are asked to perform tasks, data is recorded on video or key presses are logged. User satisfaction is evalu-ated using questionnaires and interview.
– Field studies — are performed in a natural setting, to get a better understanding of how user’s behave in the natural context of product use. Observation, interviews and surveys are some of the methods used.
It’s important to emphasize the constant iterative development needed, from prototyping, to evaluating that prototype, to circling back to the Analysis phase, in order to achieve a product that truly fits users’ needs and expectations.
3.4.5 Implementation and deployment
This is the final phase, after the final design has been created it’s time to implement and deploy,
involving writing code, perhaps making hardware, writing documentation and manuals [DFAB03].
3.5
Summary
User-centred design is a methodology that focuses on the users’ wants, needs and limitations when developing a system. There are many disciplines connected to this approach, such as, HCI, ergonomics and interaction design. The interaction design process calls for collecting data about what is wanted, analysing that data using different methods, studying design principles and guide-lines to inform concrete designs, iteratively creating and testing prototypes with users and finally implementing and deploy the product. This chapter helped to inform the methodology followed
Methodology
The purpose of this research is to come up with a mobile solution, while having farmers at the centre of the design cycle.
The previous chapters introduced literacy relating to ICT in Agriculture and UCD, both crucial to guide the following research methodology. As such, the following phases presented are based
on the process of design presented in3.4.
As previously mentioned in chapter2there are various types of mAgri solutions, from relying
on SMS or USSD protocols to more complex ones, such as web and installable applications. In this study, the choice of technology was requested by Fraunhofer AICOS. It should be an android installable app, because of the interest in researching a solution with a higher level of interaction.
4.1
Phase One - Requirements gathering
The first phase, as described in the previous chapter (see3.4.1), encompasses various methods and
activities to gather requirements.
4.1.1 Market Analysis
Different users and stakeholders are crucial to this phase, but due to a delay in getting in contact with important organizations and associations, that would be the bridge between the research team and farmers working in the field. The first step of this phase was researching what the
market already offered in regards to Agriculture Apps. As mentioned in section2.1.2, a study
developed by Gary Woodill and Chad Udell dating back to 2012 pooled and categorized mobile agriculture applications existing in the market to that date. This study is considered outdated nowadays and also was restrictive, only including solutions created towards the Canada and United States markets. To get a better understanding of what is offered nowadays to the general public a new updated study was made on agriculture apps in different categories, such as, Learning and Reference Apps, Farm Management Apps, Diseases and Pests Apps and others (presented
in Appendix A), gathering applications available up until March of 2017 on the Google Play
sample was selected by: analysing the most popular apps in different categories of mAgri. The categories selected are the ones referenced in the outdated study, minus the category “Conference Apps”, because it was not relevant to this study. The sampling was made to include apps from different locations, supporting different languages and ranging from multiple features, in different categories, to single purpose apps. This allowed for a diverse sample and for a broader view of what is available in the market nowadays.
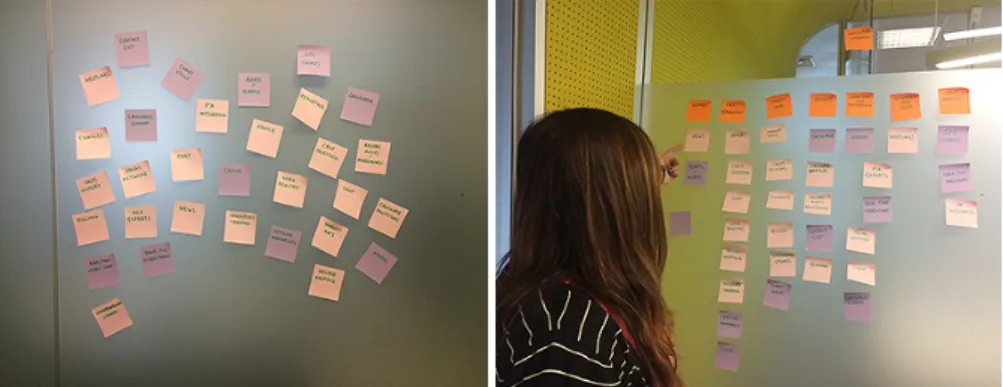
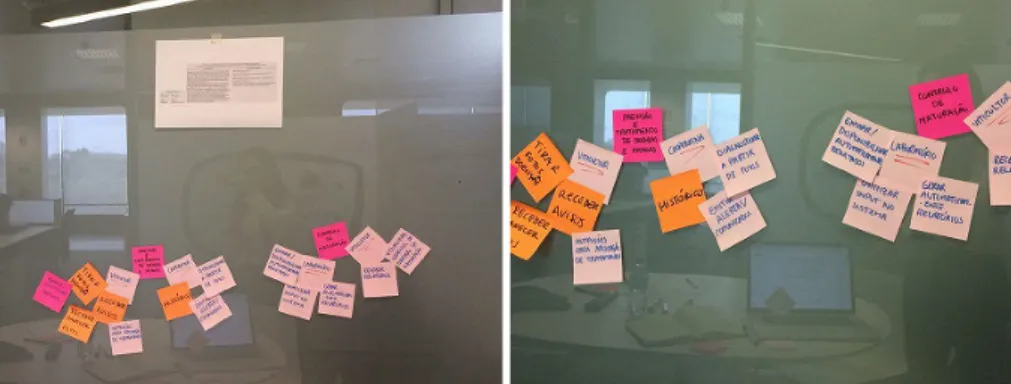
After collecting various data about each app, such as: number of installs, rating, age, sup-ported languages, source location, and some others, it was also important to assign to each app the categories that best fit the functionalities marketed or provided by the developer. Due to the difficulty found assigning this categories, because the apps usually provided multiple functional-ities, and sometimes cross-cutting ones, various professionals with distinct backgrounds in areas such as Design, HCI and Software Engineer participated in an activity where they would assign
different features to “super-categories” (see Fig. 4.1). A more in-depth report on the activity is
provided in AppendixB.
Figure 4.1: Categorizing activity
Here are some relevant findings from the study:
Figure 4.2: Findings of Market Analysis
The most popular categories are Weather Apps, Farm Management Apps, Market Data Apps and Learning and Reference Apps. By far the most common location is India followed by the
![Figure 2.2: Personal mobile devices and delivery technologies [HGWH13]](https://thumb-eu.123doks.com/thumbv2/123dok_br/18721315.918684/25.892.203.734.220.505/figure-personal-mobile-devices-delivery-technologies-hgwh.webp)
![Figure 2.3: mAgri use cases and benefits – the opportunity for mobile [WEU12]](https://thumb-eu.123doks.com/thumbv2/123dok_br/18721315.918684/26.892.157.693.218.534/figure-magri-use-cases-benefits-opportunity-mobile-weu.webp)
![Figure 2.4: Mobile Apps categories of mobile agriculture apps [WEU12]](https://thumb-eu.123doks.com/thumbv2/123dok_br/18721315.918684/27.892.260.670.153.464/figure-mobile-apps-categories-mobile-agriculture-apps-weu.webp)