1
!" !# $# %
&'(
) ) * )* +
,
#$ --# # . /
2 ABSTRACT
In a context of intensive structural reform, this paper estimates optimum bed sizes for the
Portuguese public hospitals. Considering costs and production data for the period 2003 2006, we
estimate a production theoretic quadratic cost function, adjusted to better describe the underlying
technology. Room for short run scale economies exploitation is found, but long run scale
diseconomies are unambiguous. In light of these predictions and of an optimum around 233 fully
occupied beds, there is mixed evidence of potential gains from two hospital mergers and from
one of the forthcoming constructions of public hospitals. The results are expected to contribute to
shape the hospital network in a cost efficient manner.
Keywords: optimum bed sizes for hospitals, public hospitals, quadratic cost function, scale
3 1. INTRODUCTION
1.1 Motivation and overview
Public health expenditures tend to move towards non sustainable paths in developed countries,
and Portugal is no exception. Publicly funded health expenditures reach 70.6% of total health
expenditures, which represent 10.2% of GDP1. Given that the hospital system absorbs more than
50% of the total public health expenditures, roughly speaking, this study is concerned with
productive efficiency of a non negligible portion of about 3.6% of the Portuguese GDP.
In relatively small health systems like the Portuguese, efficiency gains such as hospital scale
economies are sometimes overlooked. The government´s intention to build 11 new public
hospitals in the forthcoming years2, as well as the numerous mergers recently pursued, both
between hospitals (hospital centers, CH), and between hospitals and primary care centers (local
health units, ULS), support the timeliness of this study.
Moreira (2008) footnoted the need of a study focused on scale efficiencies in Portuguese
hospitals, while Gonçalves (2008) suggested it for future research. Hence, we also intend to fill an
acknowledged gap in the empirical literature on the Portuguese hospital sector.
In order to pursue the quantitative objectives, a database of 74 general acute care public
hospitals was constructed. The database comprises financial, technology, production, control and
binary variables, for the period 2003 2006. The quadratic cost function Preyra and Pink
(2006) was selected among production theoretic functional forms. It was adjusted ad hoc, after
early estimations, to improve its econometric properties. The main adjustments were conducted
to account for the sample heterogeneity with respect to complexity/severity and quality of outputs,
and to better reflect the structural and contextual specificities of the Portuguese public hospitals.
1 Source: OECD DSI Data Service & Information: statistical databases, 2006.
2 , , , , and may come first, followed by
4
The cost function was able to provide a minimum efficient scale (MES) of 233 fully occupied
beds, as well as the extent of scale economies in the short run and in the long run. Expanded by
the mean occupancy rate, the estimated optimum of 315 beds is surprisingly higher than the 214
bed size found by Carreira (1999). As a complementary exercise, the application of the method is
illustrated through the simulation of two hospital mergers and of a new hospital.
1.2 Context
The Portuguese public hospital is under intensive structural reform, started with the (gradual)
implementation of a prospective financing scheme (1990). Compared with the competing
schemes, such as direct reimbursement, prospective schemes are proved to better align the
incentives for resource savings3. Another relevant innovation was the establishment of public
private partnerships (PPP) in the conception, construction and operation of new hospitals.
However, the major reform experienced was the progressive but exceptionally quick
transformation (since late 2002) of most publicly managed public hospitals (SPA) into more firm
like management and legal entities (SA/EPE)4. This transformation was accompanied by
numerous hospitals mergers, intended to stimulate a more global and effective view of health
care provision at the local/regional level, assure minimum standards of service quality and citizen
accessibility and increase the hospital sector efficiency. While the EPE transformation introduces
flexibility in labor contracts and renewed incentives for budget rationalization, the mergers exploit
synergies and strategic management centralization among closely located hospitals.
Most reforms had been tested through pioneer experiments undergone in governmentally
selected hospitals5. The overall success of these innovative experiments, coupled with
3 Hospital financing is beyond the scope of this study; see Lima and Whynes (2003) for insights on the issue.
4 In 2005, all the 31 hospitals which were previously transformed into publicly owned companies, SA %
$ &), along with two other hospitals still in the SPA (% ' $ &) sphere, were transformed into corporate public entities, EPE (“( ' ( ) &). Since the main drive of the name change was political, rather than conceptual, we adopt the more recent denomination, “EPE”, from this point on.
5 $ * + + * $ + * ,
5
international trends in the sector, gave important support to the reforms implemented. For
detailed descriptions of these experiments see Barros (2009), or Harfouche (2008).
Legal and market spaces were opened recently to private initiatives6, but most hospitals in
Portugal are still within the public sphere. Idiosyncrasies of the public administration make public
health care provision particularly inefficient (though more equity concerned). As implicitly
suggested, the reforms were essentially designed to promote efficiency in hospitals’ use of public
resources. Despite the non profit nature, the Portuguese public hospitals are now constrained by
more credible budgets and have limited capacity to raise revenues, which makes efficiency an
internal concern also. For snapshots of the Portuguese public health sector and its most recent
reforms see Moreira (2008), or Barros and Simões (2007).
In what follows: section 2 provides a brief literature review; section 3 describes the model,
presents the empirical results, checks their robustness, and illustrates their application to three
specific cases; section 4 concludes and provides hints for future research.7
2. LITERATURE REVIEW
The study of efficiency of hospitals as multi product firms is recursive in Heath Economics’
empirical and theoretical literature. First of all, it is fundamental to define the level of efficiency
that is to be treated. From the literature, the most natural options are technical and allocative
efficiencies. Since substitutability between inputs is not essential to understand scale effects, and
reliable input prices would not be readily available (as discussed below), we explicitly disregard
allocative efficiency considerations.
Two types of frontier methods became popular in (global) technical efficiency measurement:
Data Envelopment Analysis (DEA) – non parametric; and Stochastic Frontier Analysis (SFA)
6 The most remarkable in terms of service range and size are 0 ) and 0 ) 1 * in Lisbon.
6
parametric. Resorting to linear programming techniques, DEA has the advantage of not requiring
) imposition of a functional form. The most attractive feature of SFA is that total inefficiency,
measured by the distance of each observation to the production frontier, may be attributed to
exogenous random disturbances and decomposed into technological change and technical
efficiency. In Portugal, Afonso and Fernandes (2008) employ DEA after providing an extensive
literature review of its international applications to the hospital sector. Moreira (2008) and
Harfouche (2008) use the same method to assess the consequences of the EPE transformation
on technical efficiency. Franco (2001) and Menezes et al. (2006), in turn, study technical
efficiency through SFA. Gonçalves (2008) employs both DEA and SFA concluding that the
frontier improved in 2002 2004 due to the competition created, mainly by the SPA hospitals. C.
Barros et al. (2008) innovate in the analysis of hospital efficiency (and productivity growth) by
employing the Luenberger productivity indicator to Portuguese hospitals in 1997 2004. The low
productivity growth found is consistent with principal agent problems and X inefficiency, targets of
the hospital sector reforms. The non comparability of the results, together with poor quality of
data, also recognized by Moreira (2008) and Harfouche (2008), implies cautious adoption of the
results, but not of the methodology. All these authors discuss hospitals efficiency and illustrate
that room for efficiency improvements exist. However, none of the methodologies used has
proved suitable to estimate optimum sizes and scale economies turning points.
The international literature is fertile in attempts to measure the optimum size of hospitals,
especially in the US. Until early 1980s no consensus could be reached, with the optimum ranging
from 150 to 900 beds. The 1980s were particularly intense in contributions for this literature
branch but, given methodological divergences, convergence still sounded ambiguous. The 1990s
were less active, but interesting contributions emerged, such as Dranove (1998). Relying on data
about 14 non revenue producing cost centers (e.g.: administration, medical records,
housekeeping), Dranove concludes that substantial scale economies exist up to 10.000 annual
7
hospitals since data on cost centers are sparse, scarce, or simply unpublished. More recently,
Preyra and Pink (2006), based on a sample of 210 acute and non acute care Ontario (Canada)
hospitals, came up with an optimum of 180 beds, well below commonly observed figures.
In Portugal, three authors estimated public hospital’s optimum bed sizes: Paiva (1993), 363;
Carreira (1999), 214; and Lima (2003), 241. Paiva (1993) applied a transformed Cobb Douglas to
late 1980s data, while Lima, based on 1984 1994 data, used a .
( ) cost function to analyze district hospitals’ efficiency8. In none of the cases the optimum
size had a central role. Aletras (1999) alerts for the bias risk of adopting second best practices in
estimating scale efficiency. Therefore, it is worth to focus and redouble efforts on the issue, while
trying to figure out whether the low optimum found by Preyra and Pink (2006) is due to the
methodology adopted, country specific factors, or, interestingly, to the decreasing trend of
average lengths of stay (ALS) and bed usage in production of hospital care. In a broad sense,
our hospital efficiency analysis has a strong background in the Portuguese literature, but is
unique on its main goals and methodology.
3. METHODOLOGY AND EMPIRICAL RESULTS
3.1 Theoretical issues
Hospitals are firms that use multi combinations of multi inputs to produce multi outputs. Despite
complexity, if certain regularity conditions are met, the cost function has the advantage of being
represented as dual of the technically efficient production function9. This is true as long as
hospitals minimize costs and the cost function carries the economically relevant information for
the production process. Grannemann et al. (1986) emphasizes the duality property, but casts
doubts on the required pace of adjustment of some inputs, such as capital, in supporting the cost
8 Public hospitals are administratively divided into Central, District (D) and District Level 1 (D1), according to a set of
criteria such as bed size and amplitude of services provided (C is largest, D1 is smallest). Lima (2003) addresses D+D1 hospitals.
9 The function regularity conditions are: non negative; linearly homogeneous in factor prices (P); non decreasing in P;
8
minimization assumption. The departure from automatic adjustment to long run equilibrium
justifies the inclusion of a separate category of inputs, the fixed factors. Carreira (1999) rejects
the profit maximizing nature of Portuguese public hospitals, but admits that by maximizing the
level of service with a prearranged budget, hospitals in fact minimize costs. Considering that
budgets were fairly credible in the period analyzed, and that maximizing the level of service
improves the utility of Portuguese hospitals managers, we keep cost function duality10.
One of the key choices the researcher must face when estimating cost functions is between ad
hoc and production theoretic forms. Among micro founded forms, the so called flexible functional
forms assumed a central role in the international literature (e.g. Aletras, 1999, Vita, 1990). Those
forms are also abundant in the Portuguese literature, where the takes the forefront:
Paiva (1993), Carreira (1999), Franco (2001), Lima (2003), Menezes et al. (2006), Gonçalves
(2008). The is the second order Taylor approximation to the true cost function. Despite
its desirable features, such as the goodness of fit, the possible existence of multiple local
minimums complicates the determination of the global minimum in the numerical optimization
process. In addition, Vita (1990) remarks the apparent performance deterioration of these
functions in points distant from the approximation point, what limits the evaluation of large output
expansions or contractions. We stick to the family of flexible forms, but differently from any form
used with Portuguese data, a second order polynomial is imposed. Convexity allows our
functional form’s behavior to be consistent with a single MES of straightforward computation.
Vita (1990) closes a decade of intensive production in this branch of literature with a seminal
contribution that insists on the superiority of the long run functions compared to the short run
ones. Cowing and Holtmann (1983) had argued the opposite.Both authors and Preyra (1998)
obtain the long run cost function by substituting the first order conditions (FOC) in order to the
10 The dual cost function is represented as . Where Y is a vector of hospital
9
fixed factor in the short run estimates. Intuitively, the optimum size of hospitals should be
determined under long run optimal capital levels. However, data available for empirical
estimations is short run, when capital levels do not adjust quickly. Thus, transforming short run
cost functions into long run require strongly sustained assumptions (e.g. Preyra and Pink, 2006).
The rigidities of the public property regime in Portugal make it unlikely that public hospitals’
capital is sold or transformed in the short run. Even though, it is not unrealistic to imagine hospital
facilities and equipment being rented for other purposes (e.g. research labs). In addition, the EPE
transformation introduced the possibility of adjusting both quantity and prices of medical staff in a
faster pace towards long run levels. These arguments bring the input flexibility needed to support
the long run conjecture. Therefore, we estimate the short and derive long run cost functions.
3.2 The model
3.2.1 Functional form: structural part
The functional form used to describe the hospital production technology is quadratic, inspired by
Preyra and Pink (1998). Accordingly, the total operating costs of a hospital are dependent on the
vector of outputs it produces (Y)11, and on fixed factors it has to maintain to operate (K):
C=C(Y,K). The components of both categories are allowed to interact with each other and
themselves. In case it can be assumed further that fixed factor prices (R) are constant, not
capturing any cost variability between hospitals, the second order polynomial is:
! ! "
Clearly, hospitals in urban areas are not comparable in opportunity costs of land and
infrastructures to hospitals in the suburbs, or in rural areas. It is common to include a rural/urban
dummy variable to control for this predictable cost divergence, but not in Portuguese studies.
11 Under the constitutional clause stating the right to “free” National Health Service (NHS) coverage, the exclusion
10
Since public hospitals administrations are exempted from renting the properties they occupy
(government owned), and accounting rather than economic information is required, opportunity
costs should be disregarded and the constant fixed factor prices assumption is adopted.
Cowing and Holtmann (1983) highlight the incorrectness of assuming no substitution
possibilities between inputs through the omission of input prices. The omitted variable bias would
threat the validity of numerous studies focusing solely on technical efficiency were not two
observations made: hospitals may sometimes be assumed to face equal prices (Preyra, 1998);
data on input prices are often very difficult to get (the Portuguese case) and their proxies are
unreliable. If price variation between units is unimportant in explaining cost variation, price
information may be dropped. As long as purchases are centralized, wages are administratively
determined, and the government owns the hospitals facilities, it seems reasonable to assume
constant prices without further testing. Besides centralized purchases, the other two conditions fit
very well to the Portuguese reality, at least in the pre EPE period.
The EPE transformation consents wage flexibility and the hiring of labor as an external service.
Two types of labor persist in the financial statements: hired permanently; bought as a
subcontracted service. Labor costs are expected to become more volatile and, based on publicly
available information, it is harder to disentangle labor costs from other contracted services.
Searching for a proxy for labor prices, Carreira (1999) obtains the average cost of a “unit of labor”
dividing total staff costs by total staff. However, the input combinations may differ substantially
among hospitals due to internal policy issues, or to inconsistent input substitutability, magnified by
different severity of cases treated12. In contrast with the preceding authors, Afonso and
Fernandes (2008) are able to spit staff into three labor categories, but maintain high degree
aggregation and, above all, true price indetermination. Pharmaceuticals prices faced are also
12 The ratio Nurses/Physicians is 1.5 for central hospitals as opposed to 2.7 for the remaining. Moreover, it is
11
hard to determine. “Once the candidate for a factor price proxy is constructed, its behaviour
should mimic the sort of behaviour which one expected from the true price variable”, Preyra
(1998). Input prices are omitted because, like Grannemann et al. (1986) and Preyra (1998), we
think that the advantages of additional flexibility in this score do not outweigh scale economies
measurement problems associated with poor quality of the input prices data.
3.2.2 Functional form: ad1hoc part
Given that most hospital services might be provided by other types of health care units, the
economic definition of a hospital is not as trivial as it seems. By default, a hospital should be
defined by its most distinguishing feature – the provision of inpatient acute care services. Even if
the health care units analyzed satisfy this minimum requirement, huge technological
heterogeneity may be present. Sample homogeneity becomes a particularly relevant issue when
imposing a common theoretic cost function to hospitals with wide ranging technologies. The
sensitivity to outliers may be huge, and the regression residuals are large. Thus, an additional
requirement that hospitals provide a minimum set of general services should be made. In order to
maintain the general care condition, in line with the literature (e.g. Preyra and Pink, 2006;
Menezes et al., 2006), specialty hospitals such as maternities, addiction and rehabilitation
centers, ophthalmologic and oncology institutes, were dropped from the original sample of public
hospitals. In addition, none of the sample hospitals could provide no ambulatory surgeries, no
chronic/long term treatment sessions and no emergency episodes, at the same time.
Nonetheless, the Portuguese hospital network is small (around 100 hospitals), and only 70% of
it is public (Barros, 2009), which prevents the law of large numbers to be entirely exploited. The
use of all existing general care hospitals and of panel data attenuates the problem, but large
heterogeneity affecting coefficients’ explanatory power will persist. The sources of heterogeneity
that are expected to remain include the average complexity/severity of patients, the quality of
12
services, the management type (SPA/EPE) and the building discontinuity. This justifies the
inclusion of an additional ad hoc part in the functional form, but data availability constraints
should be explored beforehand.
3.2.3 Model inputs
3.2.3.1 Sample
Five categories of variables should be distinguished at this stage: financial, or costs;
technology, or inputs; production, or outputs; controls; and dummies. Financial data (including
each hospital’s inpatients case mix index) were directly provided by ACSS13. Production and
technology variables were taken from the annual reports published by DGS14. The number of in
hospital deaths, an input for quality indicators, was obtained directly from DGS. Dummy variables
information was collected from several sources (e.g. hospital reports, hospital websites). The
outcome was, therefore, a tailor made database.
The sample is a cross section of 74 general acute care public hospitals, followed during four
years. The lower limit is 2003, because the EPE transformation involved transition of accounting
standards for 31 hospitals (28 in 2003 sample, 38.4%), which put important reservations on the
reliability of financial data for 2002. The upper limit is 2006, since consolidated financial data
beyond that was still unavailable at data collection time. The sample was enlarged from 73 to 74
hospitals in 2004 with the opening of a new hospital15. Five mergers occurred within the period of
analysis16, reducing the sample to 67 hospital reports in 200517. All hospitals remained
13 $ 2+ ' (ACSS), the Ministry of Health´s department responsible to
intermediate public hospitals’ funding, as well as to gather and publish most financial data. The entity responsible for hospitals’ funding in $2 and . hospital center (- ) did not respond to data requests timely.
143 2+ ' (2003 2006). DGS is the general health directorate from the Ministry of Health.
15 The new $ 4 hospital substitutes hospital (Santiago do Cacém), excluded from 2003
sample for being near closure.
16 0 ) 5 and 0 ) # amalgamated three hospitals each, and
0 ) , 0 ) 6 $ 4 , and 0 )
13
operational after merging but, since the resulting entities share a common administration board,
with an integrated and refreshed view for the resources, merged hospitals are empirically treated
as different from their original units. Consequently, the final result is an unbalanced panel of 280
observations. The balanced version comprises 240 observations (60 hospitals).
3.2.3.2 Variables: structural part
Total operating costs is described as the sum of all accounts in Portuguese cost statements (61
to 69), excluding amortizations and the noisiest accounts, i.e., financial and extraordinary costs
and losses. On the one hand, Vitaliano (1987) points out that the “estimation of a total rather than
an average cost function is preferred in econometric grounds because the latter introduces the
size or output variable on both sides of the equation. This may cause bias in parameter estimates
of as much as 10% and of unknown direction.” On the other hand, Breyer (1987) reminds that
when total costs are chosen, multi co linearity is expected to be present. However, ever since
interactions in the functional form were introduced, it was predictable that multi co linearity in
regression coefficients would be something to deal with.
Hospitals are multi product firms, meaning that several outputs should be recognized in their
cost functions. Following the same logic of Preyra and Pink (2006), three types of outputs are
considered: inpatient days (INP), emergencies and outpatient visits (EMO) and ambulatory
surgeries (AMB)18. INP includes all existing types of inpatient days, multiplied by the hospital’s
inpatients case mix index (CMI)19. Intuitively, what each hospital produces are treatment days
with a certain complexity/severity, and the CMI should be able to control for this fact – more
17 And 66 in 2006, given that $ ) 7 + hospital ( . ) has been closed for renewals.
18 As in Harfouche (2008), the number of day hospital sessions (CHR) is disregarded. It is a new practice, still absent
in many hospitals, which aggregates treatments as heterogeneous as chemotherapy and psychotherapy. Non significance of the coefficients of this variable was expected, since it is noisy and recorded in a deficient way. In fact, correlation of CHR with operating costs is only 0.58, compared with 0.69 for AMB, 0.95 for EMO and 0.96 for INP.
19 CMI is calculated by ACSS for funding purposes and, by definition, averages 1 for all country´s public hospitals.
14
complex cases are typically more resource consuming. Higher average complexity/severity is
equivalent to higher output for a certain number of inpatient days. In order to expurgate outputs
from individual hospital policies concerning average lengths of stay (ALS) some authors prefer to
use the number of inpatient discharges. Carreira (1999) notes that inpatient days increase either
if the ALS increases or the number of discharges expands20. Average daily expenses for the
same treatment tend to decay as ALS increases. Thus, caution should be put in coefficient
interpretation as marginal costs of inpatient days. ALS may be independent from hospital policies
(e.g. due to different patients’ average age) and INP will explain better hospital operating costs in
face of the large variability of ALS (mean=7.61, S.D.=3.13). However, it is important to be aware
of the trade off explanatory power versus theoretical appeal. The main reason for the EMO
aggregation is empirical, but is also related with low bed intensity requirements. AMB is costly
and is becoming more important as medicine evolves and bed usage shrinks21. Regarding
information limitations, what we call outputs are simply intermediate inputs of the ultimate output,
which is better health status, or death delay. The effects of hospital intervention are usually hard
to disentangle from other factors that improve health (e.g. behavior changes due to fear to be ill
again). Thus, it was convenient to consider that “the output is that for which the firm receives
revenue, inputs are factors used to provide these outputs”, Preyra (1998).
In line with the literature, the number of operating beds is the fixed factor22. The number of beds
is representative of the capital stock and firm size. Since it may be unrealistic to assume that the
hospital technology is independent from its size, interactions between the outputs and the beds
indicator are allowed. Moreover, Vitaliano (1987) emphasizes the problem of vacant beds
counting for final costs when available just for precautionary reasons. In order to solve this
problem, we transformed the beds variable: BEDOR=(operating beds)*(occupancy rates). Since
20#$% #&'()*+,-.(/ 01233333 &4()*+,-.(333333333333333/#012 #&'()*+,-.(/ #012
21
Some hospitals are even creating separate facilities for this practice (e.g. $ hospital).
22 Operating beds is statistically defined as the number of beds counted in a health care unit, available and prepared
15
vacant beds may not affect total operating costs much, potentially, the resulting variable has
better explanatory power. However, the gain of explanatory power is traded off against the loss of
information about the short run costs and opportunity costs of unused beds (e.g. cleaning; rooms
they occupy). If the loss of information is negligible (low amounts, quick adjustment), the
estimated optimum sizes are measured in (permanently) fully occupied beds.
3.2.3.3 Variables: ad1hoc part
Recalling the above mentioned persistent sample heterogeneity, an ad hoc part is attached to
the structural part of the functional form. One of the main difficulties of researchers in this field is
to correctly capture the impact of quality standards on costs. “Outcome” quality indicators are
more appealing than “process” indicators since they convey additional information related to the
rationale for the existence of hospitals, i.e., improve health status. Menezes et al. (2006) prove
that accredited hospitals have, on average, higher variable costs. Naturally, accreditation involves
costly efforts which explain cost divergence. However, the ultimate objective of hospitals is to
delay death, and Boto et al. (2008) found no relationship of accreditation (and benchmarking) with
mortality rates. Our search and trial of outcome quality indicators selected the following:
56 &.+7*(68 '9:+7'.97(6/ ;$ &.+7*(68$% 6 ' < = >? +9& 7 < = @
Where . is the number of in hospital deaths in a year. The CMI is relevant to control for the
fact that hospitals treating more severe cases are expected, ) , to have higher
mortality rates. Q is interpreted as the lethality rate per adjusted inpatient day and there is no
) expectation for the sign of its coefficient. More diligence in avoiding death involves typically
more resource consumption (e.g. test machines use), but high quality hospitals also attract more
patients. Nevertheless, none of the outcome indicators tested is bias free. Readmissions rates
suffer from the difficulty in tracking consecutive episodes, mortality related indicators are affected
16
not the effective quality of outcomes. Our quality measure is easy to obtain and considers the
most relevant aspects of an outcome quality indicator.
Three out of four year dummy variables, when put together with a constant, should be able to
capture time effects (Preyra, 1998). However, without interaction with the production variables,
the individual impacts are only mean approached. It has become widespread to use total costs at
constant prices23. However, this would make the time binary and other variables not statistically
significant since cost variability attributable to time, other than general inflation, would be omitted
or redistributed among other variables – affecting estimators’ efficiency. This would be a result of
the inexistence of a suitable deflator for health specific production costs.
Central hospitals, located in the main urban areas, are larger than district hospitals on average
and serve broader influence areas. These were designed to provide a wider range of specialized
services, and benefit from scale and experience in most demanding and rare pathologies24 – the
CMI is generally higher than 1 (average of 1.34). These specificities justify ) a central
hospital dummy variable, which may also capture those case mix effects unaccounted for by the
CMI (e.g. more complex emergencies treated in central hospitals).
Among central hospitals, some provide teaching services, recognized by the literature as major
costs drivers. Teaching hospitals produce additional output (e.g. student days) and have specific
facilities and human resources for education purposes – direct costs. Some resources are
diverted for educational purposes, namely, physician time and extra treatment sophistication –
indirect costs. After an extensive discussion of the impacts of teaching, Preyra (1998) decides not
to describe it on the cost function. As Aletras (1999), we account for this cost driver in the
23 Using the Consumer Price Index (CPI), the Health CPI, or the GDP Deflator (e.g. respectively, Menezes et al.,
2006, Barros and Sena, 1998, Carreira, 1999).
24 For example, and - hospitals are known to gather competences to execute complex
17
simplest manner, i.e., with a teaching hospital dummy variable25. This approach is unable to
differentiate indirect from direct costs. However, further data and research would be needed to
figure out the extent of the indirect costs and how incremental costs compare with savings from
substitution of physician and nurse time by cheap resident and intern work.
Hospital centers result from mergers of separate hospitals, and typically continue to operate in
non contiguous buildings. Service redistribution and specialization is expected to take place, but
Menezes et al. (2006) proved that this facility duplication causes higher variable costs,
) . We also test this effect including a binary variable for multiple buildings hospital centers.
The effectiveness of the EPE transformation in delivering efficiency to public hospitals is object
of considerable attention in political and academic grounds (e.g. Gouveia et al., 2006; Menezes et
al., 2006; Harfouche, 2008; Moreira, 2008). There is still mixed evidence that this institutional
arrangement improved cost efficiency. Since we are just interested in purifying the other variables
from this effect, a dummy variable is again the approach used. The classification as EPE follows
financial statements publishing criteria, not necessarily matching legal transformation dates.
As the result of the parsimony concerned ad hoc adaptation of the structural model presented
above, the final functional form to be estimated is the following:
5 A !A! " A B5 CDED
F
D
Where Y is the vector of the m>1 outputs considered, B is the fixed factor represented by the
BEDOR variable, Q is the quality indicator proposed, and D is the vector of n empirically
meaningful dummy variables. The descriptive statistics are as follows:
25 Administratively, only - , / 7 + and , hospitals were conceived as teaching
18 Table 1 Descriptive statistics (280 observations – full sample)
Variable Description Mean S.D. Min. Max.
C Sum of accounting costs (in million €) (66 amortizations) 58,3 63,1 1,70 311 (68 financial costs and losses) (69 extraordinary costs and losses)
INP Number of inpatient days x inpatients case mix index 95.653 108.962 1.230 599.516
EMO Number of emergency episodes + number of outpatient visits 194.792 149.008 4.294 756.928
AMB Number of programmed ambulatory surgeries 1.210 1.803 0 13.794
BEDS Number of operating beds 310 278 8 1.548
BEDOR Number of operating beds x beds occupancy rate 239 223 4 1.214
CMI Inpatients case mix index 1,02 0,29 0,58 2,72
OR Beds occupancy rate 0,74 0,11 0,20 0,98
ALS Inpatients average length of stay (in days) 7,61 3,13 2,70 47,90
3.3 The optimum
3.3.1 Estimation techniques
The panel data model adopted was estimated by maximum likelihood (ML), assuming random
effects. Panel data treatment allowed the enlargement of a small cross section of hospitals into a
280 observations sample – more efficient parameter estimators. However, the most attractive
feature of panel data estimation is that it solves the omitted variables problem. Each hospital may
be assumed to have unobserved effects impacting its costs differently from any other hospital
(e.g. / hospital is installed in a convent). This idiosyncratic effect explains some of
hospital’s cost variability, but since is unobserved it is non sense to estimate its partial effects on
total costs. Being reasonable to assume that this effect is time invariant and its impact on each
hospital’s costs is a constant, panel data analysis exempts its estimation, avoiding coefficient bias
simultaneously. The fundamental choice is whether the unobserved heterogeneity is a random
effect (a random variable picked from a normal distribution), or a fixed effect (an estimated
parameter). The random effects model was chosen under the assumption that the correlation
between the observed explanatory variables and the unobserved effect is zero26. When the
assumptions of the random effects model are satisfied, the estimator is consistent and more
26 The general unobserved effects model may be described as:G
19
efficient than fixed effects. The Hausman test did not reject the null hypothesis of equality of the
random and fixed effects estimators at 5%. However, the estimation of the fixed effects model is
also recommended, at least for robustness testing purposes. The Breusch Pagan Lagrange
Multiplier test for random effects accepted the random effects hypothesis27. The maximum
likelihood estimator is justified on the basis of the non linearities of the functional specification
and to prevent heteroskedasticity problems.
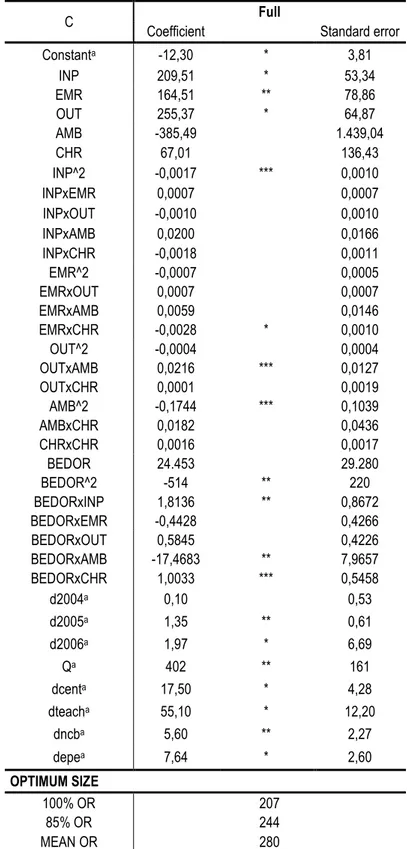
3.3.2 Estimation results28
The examination of covariance matrices and the estimation of the function with several
combinations of variables confirmed the model detailed above, as estimated below (Table 2). The
coefficients are difficult to interpret directly, which does not affect the function behavior. Except for
the constant, the coefficients of the short run function have the expected signs and reasonable
magnitudes. Ideally, the constant might be interpreted as the fixed costs of a non central, non
teaching, single building, non EPE hospital. However, the main strengths of these functions are
on describing the behavior around the sample means, not on the performance at points distant
from these means29. The model’s overall statistic significance is not rejected30. An alternative
model specification, with disaggregated EMO and CHR included, is included in Appendix 2.
Conceptually, the long run (LR) cost function is derived by plugging the optimum levels of the
fixed factor in the short run (SR) estimated technology – SR and LR coincide at the optimum. The
SRC function is computed at the mean fixed factor (BEDOR=239), for comparative purposes. The
intercept used for the LR and SRC cost functions is the latest available (2006).
27 Under the null there are no hospital specific effects. The asymptotic Chi square distribution with one degree of
freedom results in a test statistic of 214.34.
28 All the estimation results and hypothesis testing were obtained using the software package $ $ 89/9.
29 The negative sign would not prevent misinterpretation given that part of hospital financing is independent from its
production and size. Hypothetically, at zero output and bed usage, the Ministry would still transfer 10 million €, i.e., 17% of the mean operating costs.
20 Table 2 Short run and Long run cost functions
C Short1run (SR) SRC Long1run (LR)
Coefficient Standard error Coefficient Coefficient
Constanta 10,00 * 3,23 44,65 5,94
INP 211,38 * 48,33 1.003,98 313,83 EMO 95,71 * 29,41 196,66 108,76 AMB 1.505,82 1.340,18 6.065,60 527,15 INP^2 0,0031 * 0,0008 0,0031 0,0000 INPxEMO 0,0010 * 0,0003 0,0010 0,0002 INPxAMB 0,0524 * 0,0119 0,0524 0,0064 EMO^2 0,0001 0,0001 0,0001 0,0001 EMOxAMB 0,0138 ** 0,0064 0,0138 0,0063 AMB^2 0,2063 ** 0,0964 0,2063 0,0743 BEDOR 55.236 ** 27.125
BEDOR^2 894 * 174 BEDORxINP 3,3163 * 0,6822 BEDORxEMO 0,4224 * 0,1439 BEDORxAMB 31,6796 * 6,1897 d2004a 1,06 ** 0,54
d2005a 2,43 * 0,60
d2006a 3,21 * 0,66
Qa 414 * 161 414 414
dcenta 21,40 * 3,66 21,40 21,40
dteacha 45,00 * 11,10 45,00 45,00
dncba 7,55 * 2,36 7,55 7,55
depea 8,82 * 2,46 8,82 8,82
OPTIMUM SIZE
100% OR 233
239 Beds*
85% OR 274
MEAN OR 315
a in million €; * significant at 1%; **significant at 5%; ***significant at 10%
3.3.3 Estimated optimum
The optimum number of beds is obtained by equating to zero the FOC of the SR function with
respect to BEDOR. Since an average 100% bed occupancy rate (OR) is undeniably unrealistic,
the optimum found should be expanded by the inverse of the desired bed occupancy rate (OR*):
A.&(O <8P O Q " $% "
!R;P "S0;A 8 TL ! U
For illustrative purposes, the optimum for the sample mean OR is shown along with the
unrestricted 100% OR31. In the long run, hospitals adjust the OR so that average costs are
31 Since the distribution of OR is skewed, the median of 0.76 might have been chosen. The simple mean OR of 0.74
21
minimized, but the risk of seasonal or random bed shortages should also be prevented. Bagust et
al. (1999) conclude that risks of bed shortages are discernible when acute care hospitals have
average OR above 85%. Thus, the LR function is computed for OR*=1, but might alternatively be
evaluated at the benchmark OR*=0.85. To sum up, the derived optimum size for the entire
sample of public hospitals is 233 beds. This reference value is real world adjusted if divided by
the prevailing, benchmark, or desired OR. The desired OR can be determined by researchers,
but it is something that hospital managers should be able to fine tune in accordance with of
objective internal policies, or external recommendations. If expanded by the mean OR, the
optimum BEDOR results in a 315 beds optimum, which is very close to the mean number of beds
in the sample (310). This would be a direct sign of scale efficiency of public hospitals if, as Graph
1 shows, the dispersion around the mean was not so high.
3.3.4 Robustness Analysis
This subsection tests the robustness of the results above by changing three sensitive
foundations of the short run cost function: the inclusion of bed outliers32; the estimation method;
some adaptations made relative to Preyra and Pink (2006) – quality indicator and dummy
variables. In order to dissipate eventual doubts, three additional cost functions were estimated:
32
The gap between the smallest and the largest hospital is of 1500 beds.
0,0% 1,0% 2,0% 3,0% 4,0% 5,0% 6,0% 7,0% 8,0%
0 250 500 750 1.000 1.250 1.500 1.750
22 Table 3 Robustness Analysis
C No bed1outliers Fixed1effects PP2006
Coefficient Standard error Coefficient Standard error Coefficient Standard error
Constanta 8,06 *** 4,38 14,2 *** 8,09 3,41 3,01
INP 179,65 *** 103 109,95 *** 56,54 220,23 * 52,33 EMO 128,35 ** 56,13 46,27 47,98 91,41 * 32,41 AMB 1.983,27 2.392,86 1.593,50 1.477,37 3.755,26 ** 1.472,43 INP^2 0,0031 ** 0,0012 0,0018 *** 0,0011 0,0034 * 0,0008 INPxEMO 0,0007 0,0006 0,0011 * 0,0003 0,0008 ** 0,0003 INPxAMB 0,0771 * 0,0279 0,0346 ** 0,017 0,5642 * 0,0133 EMO^2 4.93e 06 0,0003 0,0003 * 0,0001 0,0002 * 0,0001 EMOxAMB 0,0226 0,0178 0,0079 0,0069 0,0042 0,0068 AMB^2 0,4234 ** 0,2144 0,1266 0,1052 0,0711 0,103 BEDOR 55.578 49.838 68.855 *** 35.569 69.359 ** 29.041
BEDOR^2 807 ** 359 681 * 230 896 * 194
BEDORxINP 3,3813 * 1,1614 2,3504 ** 0,945 3,6114 * 0,7583 BEDORxEMO 0,1954 0,517 0,345 ** 0,1529 0,2205 0,1526 BEDORxAMB 33,692 20,622 21,2898 * 8,1859 33,5906 * 6,8602
d2004a 0,5 0,84 1,12 *** 0,6 0,55 0,61
d2005a 1,48 0,93 3,38 * 0,69 2,11 * 0,67
d2006a 3,07 * 1,01 4,03 * 0,78 2,57 * 0,74
Qa 348 270 226 199
dcenta 13,9 * 3,18
dteacha
dncba 5,15 ** 2,49
depea 4,69 *** 2,66
OPTIMUM SIZE
100% OR 178 246 233
85% OR 209 289 274
MEAN OR 243 333 314
a in million €; *significant at 1%; **significant at 5%; ***significant at 10%
In spite of the interactions of the size variable, it is still naïve to presume that the largest
hospitals share the same technology with the smallest. Excluding bed outliers, i.e., keeping the
observations within the range of a two sided standard deviation from the mean number of beds
(32<beds<588), the optimum decreases considerably. Since only 2 out of 30 hospitals excluded
are below 32 beds, the largest hospitals have a considerable impact on the optimum initially
derived. This is unsurprising since the largest hospitals, typically central hospitals, allow the CMI
to approach the country average of 1. Besides the higher than average complexity, central
23
of the functioning of the system as a whole. The model is not completely robust to bed outliers, in
the sense that the significance of some coefficients is destroyed. However, the exclusion of large
hospitals from the sample would result in a bad description of the general hospital technology.
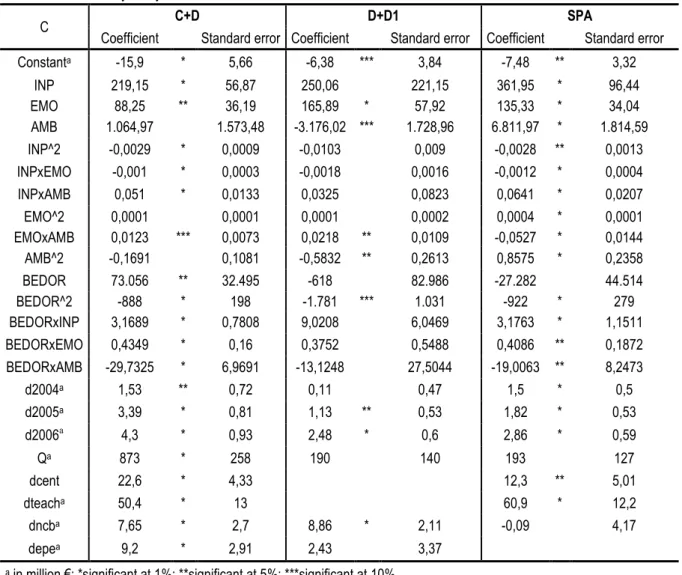
3.3.5 Sensitivity Analysis
Overall, the cost function was proved robust to changes of its most sensitive features. As a
consequence, the estimated SR cost function can be applied to subsamples of interest with some
degree of confidence. The subsamples proposed are: the most general hospitals (excluding D1
hospitals, C+D), district hospitals (excluding central hospitals, D+D1), and publicly managed
hospitals (excluding EPE transformed hospitals, SPA)33. The function “No bed outliers” is
recovered from the last subsection. The new optimums are references for eventual partial
requalification of the hospital network. The relevant data and estimation results for the
subsamples proposed are in Appendix 3. Along with the optimums for the re sampled estimates,
the optimums for the SR function evaluated at the means of the subsamples were calculated:
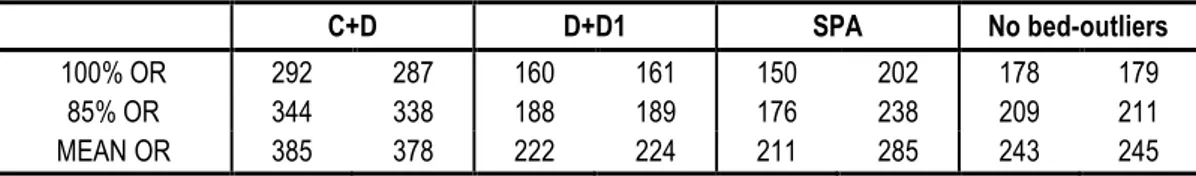
Table 4 Optimum new function, new sample / Optimum SR function, new sample
C+D D+D1 SPA No bed1outliers
100% OR 292 287 160 161 150 202 178 179 85% OR 344 338 188 189 176 238 209 211 MEAN OR 385 378 222 224 211 285 243 245
Three remarks should be made. First, the re estimation of the cost functions for the subsamples
does not challenge the optimums resulting from the evaluation of the SR function at the means of
the subsamples. Except for the SPA function, the largest optimum BEDOR divergence is of only
1.7% (for the C+D function). Drastic sample changes did not make the SR function obsolete, in
the sense that optimums have shown persistence. Even the optimum of “No bed outliers”, that
raised some doubts in the last subsection, is kept constant. Thus, when samples are large and
33 Since the analysis of Central, D, or D1 separately would suffer from small sample bias, we preferred to consider
24
representative enough, the SR cost function is a loyal technological description of administrative
and bed subcategories of public hospitals, at least for optimum calculation purposes.
Second, the results suggest that SPA hospitals (60% of the sample) and EPE hospitals have
different production frontiers. While the functional form adjusted satisfactorily to the SPA
subsample, only 7 out of 21 coefficients were significant at the 10% level for the EPE subsample.
Moreover, the optimum for the SPA function departs 26% from the optimum for SR function
evaluated at the SPA subsample. The subsamples are small and it is beyond the scope of this
study to analyze frontier divergences. The important aspect to retain is that the SR function may
not be an appropriate technological description of management type subsamples.
Last but not the least, picking the first remark attesting suitableness of the evaluation of the SR
function at subsample means, and giving room to some loss of precision, the optimum size of 224
beds for district hospitals compares with the optimum of 241 found by Lima (2003). This may be
reflecting the declining trend in bed usage in production of hospital care.
3.4 Economies1of1scale
Scale economies are said to exist in a firm whenever an increase in output results in a less than
proportional increase in total costs, i.e., mathematically, the average cost function is negatively
sloped. Despite independent from the increase in output being due to a merger, or a pure
expansion, the existence of scale economies is typically dependent on the level of output, i.e.,
mathematically, the cost function is non monotonic in its domain. Intuitively, if the average cost
function were monotonically decreasing at all levels of output, the scale efficient long run decision
would be to concentrate the whole hospital network in a single mega hospital (transportation and
time costs disregarded). Still, it is realistic to presume that, up to some scale, fixed costs are
diluted among patients in a faster pace than organizational ineffectiveness costs rise. Moreover,
cost complementarities may push costs down further. On this basis, the hospital cost function is
25
R2 V % < T]WX YWX YZ Y[ Y\^ _Y`_Y_a
, scale economies if ES>0 (scale diseconomies if ES<0)
Where Y is the vector describing the prevailing output mix, ρ is a percentage (of the reference
output, fixed factor and quality), and N is the number of identical hospitals that jointly produce the
combined output. The long run version of this measure just assumes that X is the LR function
and, consequently, B is dropped. The following table presents the ES achieved when X is the SR
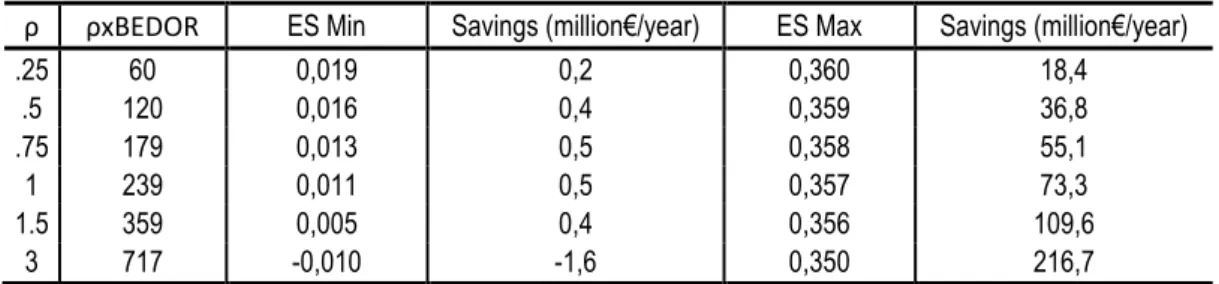
function, Y is the mean output vector, B is the mean BEDOR, Q is at the mean (7.45 deaths per
1000 INP) and N=2. It is assumed that the service mix is held constant:
Table 5 – Short run economies of scale (N=2)
ρ ρxBEDOR ES Min Savings (million€/year) ES Max Savings (million€/year)
.25 60 0,019 0,2 0,360 18,4
.5 120 0,016 0,4 0,359 36,8
.75 179 0,013 0,5 0,358 55,1
1 239 0,011 0,5 0,357 73,3
1.5 359 0,005 0,4 0,356 109,6
3 717 0,010 1,6 0,350 216,7
Since the SR function allows different intercepts, which influence the scale economies achieved
and the pace at which they decay, the ES measure was bounded. ES Min is the lower bound and
assumes that the intercept is equal to a proportion ρ for the merged hospitals and ρ/N for each of
the N separate units. Scale economies for N=2 decay from small to large sizes and vanish as the
output and BEDOR reach twice the means. ES Max is the upper bound, for which N central,
teaching, EPE, multiple building hospitals become a single unit. This is a very unlikely output
expansion since it assumes that all fixed costs are cut N 1 times34. However, it illustrates how
high ES could grow using the estimated functions. Given that BEDOR disregards costs of
excessive capital, which may be substantial, and amortizations are fixed costs excluded from C,
ES Min (and even ES Max) may be underestimating the true scale economies. Nevertheless, it
34 For instance, a merger of N=2 teaching hospitals is unlikely to cut costs in half, for the same number of students.
should be remembered that it
fixed costs. The results should
Concentration processes are
at which hospitals are comprom
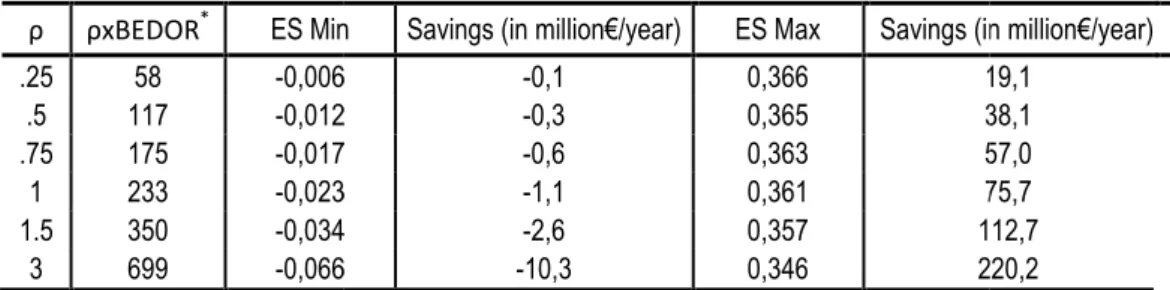
the long run ES, i.e. apply the s
Table 6 Long run economies
ρ ρxBEDOR* ES Min
.25 58 0,006 .5 117 0,012 .75 175 0,017 1 233 0,023 1.5 350 0,034 3 699 0,066
The LR function finds scale d
but not even the very small ho
This may be a consequence of
means and Vitaliano (1987) su
scale too often. In extremis, a
half and scale economies bec
the non contiguous building du
this inefficient pattern. The follo
-0,15 0,00 0,15 0,30 0,45 0,25
t it is incorrect to interpret the intercept as a reliable
uld be used with caution, especially ES Max.
are truly attractive only when the gains spread well
romised with capital input rigidities. Thus, it is worth
e same method to the LR function:
of scale (N=2)
in Savings (in million€/year) ES Max Savings (in
06 0,1 0,366 1
12 0,3 0,365 3
17 0,6 0,363 5
23 1,1 0,361 7
34 2,6 0,357 11
66 10,3 0,346 22
diseconomies for all levels of output. These aggra
hospitals could gain from scale expansions, which is
of the bad performance of the cost function at point
) suggests that the quadratic cost function displays
, all “fixed costs”, approached by the dummy coeffi
ecome expressive, but, again, it is implausible. The
dummy in the LR function is due to policy indetermin
ollowing graph depicts both long run and short run E
LR Min SR Min
ES Max
0,50 0,75 1,00 1,50 2,00 3,00
ρ
Graph 2 Economies of scale
26
ble estimator of the
ell beyond the times
rthwhile to compute
(in million€/year) 19,1 38,1 57,0 75,7 112,7 220,2
gravate as ρ grows,
h is counterintuitive.
ints distant from the
ys diseconomies of
efficients, are cut in
The permanence of
mination concerning
27
Despite reservations, ES Min mimics the theoretical behavior of costs through the specifications
chosen. ES Min reflects the gains which are due to the shape of the cost function rather than to
intercept shifts. These results are a warning for those attracted by the exploitation of short run
scale economies. If a scale expansion is undergone and nothing besides that changes, the long
run losses may end up outweighing the short run gains and the aimed cost efficiency is
undermined. However, each expansion/contraction should be fit to real production data and facts,
and analyzed ) . The next section is devoted to exemplify how.
3.5 Simulations
The current hospital network reconfiguration is an onerous and long lasting process that is
involving many capital stock and organizational adjustments. This section illustrates how the
method employed can be used to simulate real output expansions and contractions. It is tempting
to choose for output expansions the mergers of 3 independent hospitals which resulted in
0 ) # (CHNE) and 0 ) 5 (CHLO)35, for two reasons:
result in hospitals close to the turning point of the short run ES; the hospitals merged are not of
dissimilar sizes and output levels (N=3 is a reasonable assumption). CHNE is almost 1.5 times
the mean BEDOR, while CHLO is about the triple of that in 200336.
As example of an output contraction, the likely negative impact on demand for
-hospital (HSM) caused by the creation of a general acute care 400 500 beds -hospital in
town has been chosen. This town is currently within HSM´s influence area, but since HSM is a
large central and teaching hospital, demand is not likely to decrease proportionately to new bed
capacity. Not disregarding other creations and replacements around HSM´s influence area37, a
1/3 demand decrease relative to 2006 seems a reasonable crude prediction. As before, ES Min
35 CHNE is composed by - , 2 and - hospitals and CHLO amalgamated the
central hospitals of , ( - and / .
36 Data for 2003 is used because CHLO was created in 2004. Both hospital centers were legally EPE transformed in
late December 2005 (3 : ;<<!;99=).
28
and the corresponding savings for the SR and LR cost functions are evaluated at the sample
means (Table 1). ES Min for CHNE and CHLO are evaluated at the 2003 average output,
BEDOR and quality of the hospitals that would later merge. The simulations for ρ=3.75 (HSM
related) compare 2006 data to two hypothetical hospitals: one with ρ*2/3; the other with ρ*1/3.
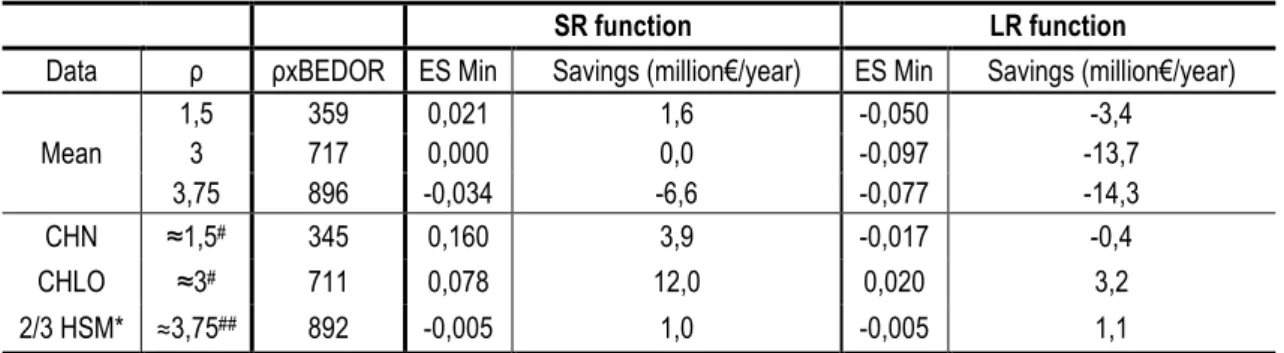
Table 7 Economies of scale in mergers (N=3)
SR function LR function
Data ρ ρxBEDOR ES Min Savings (million€/year) ES Min Savings (million€/year)
Mean
1,5 359 0,021 1,6 0,050 3,4
3 717 0,000 0,0 0,097 13,7
3,75 896 0,034 6,6 0,077 14,3
CHN ≈1,5# 345 0,160 3,9 0,017 0,4
CHLO ≈3# 711 0,078 12,0 0,020 3,2
2/3 HSM* ≈3,75## 892 0,005 1,0 0,005 1,1
# 2003 data and intercept; ## 2006 data and intercept
It is conservative to assume ES Min, i.e., fixed costs as a proportion of the hospital size. Real
gains may be higher in practice. Nonetheless, fixed costs dilution is probably unimportant since
the mergers were mainly of legal, management and organizational aspects all hospital facilities
were maintained operational. In line with the predictions of the SR function at the sample means,
the SR at the average of the merging hospitals found mild support for CHNE. In contrast with
predictions, CHLO is also viable. Based solely on scale considerations38, the long run ES Min
measure shows consistent diseconomies of scale, which would have clearly rejected the potential
sustainability of these mergers. However, this proves true only for CHNE. CHLO is sustainable, at
least marginally (operates jointly with 98% of the costs of operating separately; savings of 3.2
million€/year). CHLO is composed of hospitals close to the optimum size (237 mean BEDOR).
Differently from what Gonçalves (2008) suggested, CHLO had unambiguous potential scale
economies. Considering that gains are small, departure from this conclusion, i.e., cost
inefficiency, may easily be attributed to organizational ineffectiveness and adjustment costs. As a
38 It is worth to remember that the rationale for mergers include non economic objectives (integration of health care
29
matter of fact, operating costs of CHLO at constant 2003 prices (GDP deflator=1.02364) were
lower in 2004 than in 2003, the opposite being true for CHNE.
In what concerns the HSM case, the SR and LR cost functions predict substantial scale
diseconomies for ρ=3.75, which mean potential savings from a scale contraction of 1/3. Using
real 2006 data these gains are smoother for both SR and LR functions, but still positive. Despite
adjustment costs, it is predictable that the new hospital will create scale efficiency in
provision of hospital care in HSM through downsizing inducement. However, the estimated (lower
bound) savings of 1.1 million €/year represent only 0.4% of HSM’s 2006 operating costs.
4. CONCLUSIONS
As medicine evolves and hospital treatments become less invasive, the relationship between
intensity of use of beds and the size/production of a hospital is deteriorating. Meanwhile, and to
be consistent with the literature, the beds variable seemed to be the best proxy available for the
size of hospitals. The aim to estimate optimum bed sizes for the Portuguese public hospitals was
fulfilled through a production theoretic quadratic cost function, never applied to Portuguese data
before. The functional form was inspired in Preyra and Pink (2006), but suffered significant
transformations to improve its economic and econometric properties. The main transformations
were conducted to conveniently account for the heterogeneity of the sample with respect to: bed
occupancy rates, average complexity/severity of patients, quality of service, teaching hospital
condition, amplitude of the portfolio of services, management type and building discontinuity.
Under the extreme assumption of 100% average bed occupancy rates, it is estimated that the
optimum size of the Portuguese public hospital is around 233 beds. The optimum should be
expanded by the desired, prevailing, or benchmark occupancy rates (e.g. the mean 74% implies
an optimum around 315 beds). Once proved robust to its most doubtful foundations (e.g. the
estimation method), the cost function is re estimated for some subsamples of interest. The
30
general short run cost function is an appropriate technological description of the subsamples of
administrative categories, of hospitals around the mean, but not of management types (SPA
versus EPE) – the EPE transformation likely caused technological disruption in public hospitals.
The short run cost function predicts some room for scale economies exploitation in hospitals up
to twice the mean hospital, while the long run cost function shows increasing scale
diseconomies, even for the smallest hospitals. Policy makers should take evidence of short run
gains from scale expansions with caution. As capital stocks are adjusted towards long run
optimum levels, scale economies may vanish or even become negative. However, due to the
potential for fixed costs savings and to heterogeneous levels of efficiency of the hospitals
merged, each output expansion/contraction through merger should be analyzed in isolation. The
0 ) 5 (CHLO) and the 0 ) # (CHNE) had
short run potential savings from merging before being created. However, and despite its large
combined size, only CHLO would have indicated sustainable gains over the long run. Finally, it is
estimated that - hospital (HSM) has small but positive gains from 1/3 scale reduction,
both in the short and in the long run. This reduction may easily be induced by demand diversion
to the forthcoming public hospitals within and around its influence area.
Future research should unveil which services should be put together in hospitals of the scale
efficient size we estimated, i.e., focus on scope economies. This study estimates the efficient size
of hospitals, but does not indicate where they should be located in territory. Considering
demographic density data and average travel costs, future research could address the issue
trying to find the optimal distance between hospitals. The “peak load problem” stressed by Lynk
(1995) should be addressed, particularly for those hospitals located in areas where the uncertain
31 Acknowledgements
I am grateful to Professor Pedro Pita Barros for his dedication and irreprehensible supervision,
and for having employed his outstanding scientific and human qualities throughout this project. I
am thankful to Professor Colin Preyra for prompt clarification of methodological doubts, and to
Professor Pedro Portugal and Professor Paulo Rodrigues for useful comments on earlier versions
of the model. My best wishes for all those that contributed somehow to make this paper possible.
I dedicate all the effort to my parents, for unrestricted motivation and support to my search for
knowledge in the last 23 years.
References
Afonso, A., and Fernandes, S., 2008. “Assessing hospital efficiency: non parametric evidence for Portugal”, WP
07/2008/DE/UECE, ISEG, Technical University of Lisbon.
Aletras, V., 1999. “A comparison of hospital scale effects in short run and long run cost functions”, 0 . (
8(6): 521 530.
Bagust, A., Place, M., and Posnett, J., 1999. “Dynamics of bed use in accommodating emergency admissions:
stochastic simulation model”, . - 7 319: 155 158.
Barros, P. P., 2009. ( ' > ) , Coimbra: Edições Almedina, SA.
Barros, P. P., and Sena, C., 1998. “Quanto maior melhor? Redimensionamento e economias de escala em três
hospitais portugueses”, Faculdade de Economia, Universidade Nova de Lisboa, (unpublished).
Barros, P. P., and Simões, J., 2007. “Health system review”, 0 . ? 9(5): 1 140.
Barros, C., Menezes, A., Peypoch, N., Solonandrasana, B., and Vieira, J., 2008. “An analysis of hospital efficiency
and productivity growth using the Luenberger indicator”, 0 . - 11: 373 381.
Boto, P., Costa, C., and Lopes, S., 2008. “Acreditação, benchmarking e mortalidade”, @ '
' , Volume temático 7: 103 129.
Breyer, F., 1987. “The specification of a hospital cost function: a comment on the recent literature”, 7 A 0 .
( 6: 147 157.
Carreira, C., 1999. “Economias de escala e de gama nos hospitais públicos portugueses: uma aplicação da função
de custo variável Translog”, Estudos do GEMF, Vol. 1, Faculdade de Economia da Universidade de Coimbra.
Cowing, T., and Holtmann, A., 1983. “Multi product short run hospital cost functions: empirical evidence and policy