A Work Project, presented as part of the requirements for the Award of a Master Degree in
Economics from the NOVA – School of Business and Economics.
Inequalities in the Access to Healthcare:
Migration in Europe
Diogo Sousa dos Santos Serra 3127
A Project carried out on the Master in Economics Program, under the supervision of:
Professor Pedro Pita Barros
Inequalities in the Access to Healthcare: Migration in Europe
Abstract
This Work Project analyzes the unequal access to healthcare in Europe between 2004 and 2012, considering the migrant population in particular. Using the European Union Statistics on Income and Living Conditions (EU-SILC), the migrant status is determined primarily by the country of birth and secondarily established by citizenship, and the access to healthcare is measured by the unmet need for medical treatment. The empirical methodology follows an econometric approach. We start to observe that the difference between migrants and natives in the access to healthcare disadvantages the formers, although not substantial. On the other hand, it is found that the differences between age groups, for the total sample, turn out to affect relatively more the unmet needs than the migration issue. Considering the particular context of the European Union, if the migrant is not an EU citizen, the inequality in the access to healthcare is relatively more marked. This latter inequality is amplified when the reason that leads to unmet need results from financial constraints.
Keywords: access to healthcare; migrant; inequality; unmet need;
Acknowledgments
1
–
Introduction
According to the United Nations Educational, Scientific and Cultural Organization
(UNESCO),1 “the term migrant can be understood as ‘any person who lives temporarily or permanently in a country where he or she was not born.” Furthermore, this definition is clarified
by the United Nations, since, “according to some states’ policies, a person can be considered as
a migrant even when s/he is born in the country.” This clarification, which emphasizes the
relevance of each country’s national policy, demonstrates that the definition of migrant is not
consensual. Rechel et al. (2011) make that heterogeneity explicit, based on examples collected
through health surveys of some European countries, from which we can highlight Italy, the
Netherlands, Sweden and the United Kingdom. In Italy, the migrant status is determined by
citizenship, while in the Netherlands the indicator is the country of birth of individuals and their
parents, which allows for the distinction between first-generation and second-generation
migrants (Mladovsky 2009)2. On the other hand, the United Kingdom uses, in addition to the
country of origin, an indicator of ethnic status to classify migrants, whereas in Sweden it is
prohibited to collect data on ethnicity. Thus, this diversity and the absence of a universally
accepted criterion to define migrant is a barrier to a comparison of migrant health across
countries (Rechel et al., 2011; Hannigan et al., 2016).
All the European Union Member States ratified the International Conevant on Economic, Social
and Cultural Rights (ICESCR), whose Article 17 states“the right of everyone to the enjoyment
of the highest attainable standard of physical and mental health”. This latter right requires,
amongst others, the accessibility to healthcare services. In this sense, the Member States must
1UNESCO Glossary:
http://www.unesco.org/new/en/social-and-human-sciences/themes/international-migration/glossary/migrant/ (accessed in December 3 2017).
2 The Dutch health surveys distinguish persons who were born outside the Netherlands (first-generation migrants)
ensure a non-discriminatory, physical, economic and information accessibility of health
facilities, goods, and services. (Pace and Shapiro, 2009).
However, despite these recommendations of the European Union’s guiding documents, there is
substantial evidence across countries of inequalities between migrants and natives in both the
state of health and the access to healthcare, regardless of the definition of migrant used. The
verification of these discrepancies between countries is supported by the indicators set by the
Migrant Integration Policy Index (MIPEX). The MIPEX classifies countries, from 0 to 100,
according to the government's policies that promote the integration of migrants in different
institutional domains, which includes healthcare.3
Taking into account these indicators, which reflect intra-country and inter-country disparities,
and based on the European context of Healthcare and Migration, this study addresses the
following questions: First, is there any evidence of an inequality between migrants and natives
either in the state of health or in the access to healthcare?4 Secondly, what are the reasons that
explain these potential disparities? Third, do government's policies, which promote the
integration of migrants, have an impact on the satisfaction of healthcare needs among migrants?
And, lastly, what is the role of the healthcare systems’ characteristics in this same issue?
This research project is structured into six sections. Section 2 explores the literature used as
support. The dataset and the procedure to generate the variables, supported by some descriptive
statistics, are detailed in Section 3. Section 4 explains the empirical methodology and the
econometric approach, whereas Section 5 presents some of its most relevant results. The last
section is reserved for some conclusion and reflections.
3 Regarding this latter issue, the criteria used in the classification of the countries are based on four dimensions:
entitlements, access policies, responsive services and mechanism for changes. The description of these dimensions can be found in Appendix, Table A.1.
4 Henceforward, as much of the literature suggests, the inequality in the access to healthcare between migrants and
2 - Literature Review
Migrants tend to experience more health problems than local populations and this gap in the
health status can be partly explained by the adaptation to a new cultural, social and legal
environment that migrants have to do. According to Bhugra and Becker (2005), the complex
migration process and the lack of social support negatively influence the mental health of
migrants in the United Kingdom. In addition to mental health, Mladovsky (2009) stated other
risk factors that according to the literature tend to affect relatively more the migrant population5.
Those factors include habits like alcohol, smoking, and illegal drugs, STD’s like HIV, and poor
nutrition, while regarding chronic diseases, migrants are in a relatively more favorable position.
Following the evidence of this latter particular case, it is important to highlight that, on the other
hand, much has been written about the opposite perspective of the health status gap between
migrants and natives, which is theoretically and partly explained by the healthy migrant effect.
Based on empirical observations in some developed host countries, namely the United States
and Canada, the healthy migrant effect is a mortality advantage of first-generation migrants,
contrasting to comparable natives, at the moment they arrive in the receiving country. Some
researchers try to give some plausible explanations for the evidence of this effect. Constant
(2017) defends that “immigrants are not a random sample of their home country”, and this
statement is addressed by Domnich et al. (2012) through the “health selection hypothesis”.
According to the latter, immigrants and their compatriots, who do not migrate, tend to exhibit
some differences, such as that immigrants may be more educated or be better prepared to face
risky circumstances.
5
Moreover, the issue of migrants’ selection can also be analyzed from other two perspectives.
First, despite some countries screen migrants to obtain information and, then, to forward them
to the healthcare system, this method can also be used by some governments to block entry,
which means that only the healthiest migrants stay in the host country. Secondly, the “salmon
bias” hypothesis also contributes to the low degree of randomness in the migrants’ sample,
since it suggests that many less healthy elderly Hispanics return from the United States of
America to their place of origin (Abraído-Lanza et al., 2009).6
Furthermore, these hypotheses, which partly result in an artificially low mortality rate among
migrants, also try to explain the paradox inherent to the healthy migrant effect, since migrants
exhibit simultaneously better health and a lower socioeconomic situation. However, the lower
socioeconomic status and a combination of lifestyle and environmental changes lead to the deterioration of migrants’ health, which consequently converges to the health status of natives.
(Fennelly, 2007) (Domnich et al., 2012) (Constant, 2017)
Regarding the access to healthcare, the conclusions given by the literature concerning the
direction of the inequality between migrants and natives do not diverge in the same way as
those drawn from the comparative health status analysis, previously presented.
According to the Expert Panel on Effective Ways of Investing in Health (EXPH) in 2017, “a useful starting point” to deal with the complexity associated with the healthcare topic “is to
define the need to healthcare”, which lacks a universal definition (Folland et al., 2007). Acheson
(1978) presents, amongst others, the Matthew (1971)’s approach, which proposes that need
only exists when it can be met with “some medical intervention that has positive utility and that
actually alters the prognosis of the disease in some favorable way at reasonable cost.” This
6 According to Abraído-Lanza et al. (2009), salmon bias hypothesis, which reflects “the desire to die in one's
definition leads to a central assertion: an individual must exhibit a not-good state of health that
is possible to match to some medical treatment, which should alleviate, at least, their condition.
However, sometimes the need for healthcare exists but it is not met with medical treatment, and
this mismatch can be originated by either supply or demand factors (Jacobs et al., 2012).7
Although the literature provides an extensive contribution to measuring access to healthcare,
this research project emphasizes on unmet needs for healthcare to evaluate its accessibility. As
Guidi et al. (2016) point out, it allows us to take advantage from the availability of this indicator
in the cross-sectional survey EU-SILC.8 Our concern is with the unmet needs of the migrant
population.
3 - Data and descriptive statistics
The core database used is the European Union Statistics on Income and Living Conditions
(EU-SILC), whose observations are for the annual period between 2004 and 2012 and 31 European
countries (the 27 EU Member-States,9 Croatia, Iceland, Norway and Switzerland).10 Not all
countries have available data for the time range of 2004-2012.11 The variables that will be used
in the empirical analysis were obtained directly and indirectly through the questionnaires
collected at a household level (H) and personal level (P), which were respectively answered by
the head of the household and by all current household members aged 16 and over. Furthermore,
there were collected and obtained macroeconomic variables, whose sources will be mentioned.
7Based on (Ensor and Cooper 2004) and (Peters et al. 2008), Jacob et al. (2011) exhibit some barriers to accessing
healthcare services, specifying if they are influenced by supply or demand factors. Supply-side determinants include, amongst others, costs and prices of services, and waiting lists, while demand-side factors involve indirect costs to the household (e.g., transport cost) and lack of information on healthcare services.
8 European Statistics on Income and Living Conditions
9 In the years of 2004-2012, Croatia (HR) was not an EU Member-State. 10 Countries outside the EU belong to the Schengen Area.
11 The 31 countries are not all available for the period 2004-2012. Croatia (HR) is only available from 2011. Data
We shall, now, proceed to the description of the (i) migrant status variable, (ii) health status and
healthcare access variables, (iii) socio-demographic factors and (iv) macroeconomic variables.
(i) Migrant Status
In this study, the concept of the migrant is formulated based on to the relationship between the
country of residenceand the country of birth. 1213 The EU-SILC’s variable PB210–Country of
birth can assume three broad string values: LOC if the country of birth and the country of
residence are the same; EU if the country of birth is another European Union country; OTH for
the remaining cases. Thus, according to the EU-SILC, a respondent is considered as a migrant
if s/he answered EU or OTH.
Furthermore, migrants can be particularly sub-classified according to two categories. Regarding
the generation level category, individuals can be first-generation or second-generation
migrants. On the other hand, if we take into account the place of origin category, there can be
considered migrants from a European Union country and migrants from a third country to the
European Union.
Within the generation level category, individuals, who were born in a country other than where
they reside, are considered first-generation migrants. Furthermore, individuals that were born
in the country of residence could be either natives or second-generation migrants, since in this
latter case only the parents of the respondent were born in another country. In order to define a
second-generation migrant, it would be necessary to have access to the country of birth of the
respondent’s father and that of the respondent’s mother. Regarding the EU-SILC variables
PT060 –Country of birth of the father and PT090 –Country of birth of the mother, there are
12 The country of residence is here understood as the country where the survey was conducted. The code for this
EU-SILC variable is PB020.
13This general concept of migrant was not formulated according to citizenship. Thus, this concept includes
only observations for part of the year of 2011. Given this data restriction, the generation level
category will not be considered in the present research project.
The access to healthcare issue is especially addressed in the European context, since citizens of
the European Union have the right to healthcare transnationally, within the EU. On the other
hand, whoever is not an EU citizen, as his/her access to this care is conditioned on the legal
situation of each country, which might include the granting of permanent or long-term residence
status (Mladovsky, 2009). Consequently, it may also then be interesting to sub-classify migrants
according to their place of origin. Thus, migrants are sub-classified within the category place
of origin as EU Migrant, if born in a European Union country, and as Non-EU Migrant, if born
outside of the European Union. Although the generation level is not taken into account, note
that the category place of origin only contains first-generation migrants.
However, in addition to Mladovsky (2009), Waidmann (2003) also acknowledges the relevance
of citizenship, stating that Latinos in the United States of America, who are not citizens, are
less likely to use healthcare services. Thus, according to the distribution of migrants per
citizenship in the EU-SILC database (Table 1) and since the latter has a potential impact in the
access to healthcare, the country of birth is not a sufficient condition to classify migrants.
Table 1 – Distribution of migrants per citizenship status (%)
Citizenship
LOC EU OTH
EU Migrant 37.7 61.8 0.5
Non-EU Migrant 51.3 2.68 46
LOC: Citizen of the country of residence; EU: Citizen of an EU country; OTH: Citizen of a non-EU country.
Approximately half of the migrants (51,3%) who were born outside the European Union have
the citizenship of the country of residence, while that percentage for migrants from a European
Union country is 37,7%. Because of this high presence of individuals who are citizens of a
country other than the country in which they born, the migrant status must be specified, taking
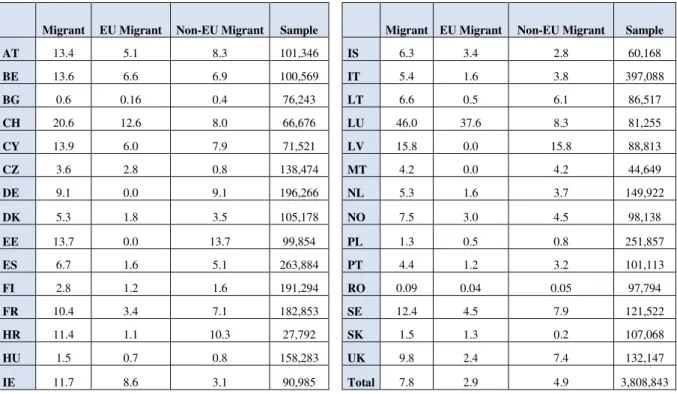
Table 2 – Distribution of migrants per country,14 EU-SILC 2004-2012 (%)
Migrant EU Migrant Non-EU Migrant Sample Migrant EU Migrant Non-EU Migrant Sample
AT 13.4 5.1 8.3 101,346 IS 6.3 3.4 2.8 60,168
BE 13.6 6.6 6.9 100,569 IT 5.4 1.6 3.8 397,088
BG 0.6 0.16 0.4 76,243 LT 6.6 0.5 6.1 86,517
CH 20.6 12.6 8.0 66,676 LU 46.0 37.6 8.3 81,255
CY 13.9 6.0 7.9 71,521 LV 15.8 0.0 15.8 88,813
CZ 3.6 2.8 0.8 138,474 MT 4.2 0.0 4.2 44,649
DE 9.1 0.0 9.1 196,266 NL 5.3 1.6 3.7 149,922
DK 5.3 1.8 3.5 105,178 NO 7.5 3.0 4.5 98,138
EE 13.7 0.0 13.7 99,854 PL 1.3 0.5 0.8 251,857
ES 6.7 1.6 5.1 263,884 PT 4.4 1.2 3.2 101,113
FI 2.8 1.2 1.6 191,294 RO 0.09 0.04 0.05 97,794
FR 10.4 3.4 7.1 182,853 SE 12.4 4.5 7.9 121,522
HR 11.4 1.1 10.3 27,792 SK 1.5 1.3 0.2 107,068
HU 1.5 0.7 0.8 158,283 UK 9.8 2.4 7.4 132,147
IE 11.7 8.6 3.1 90,985 Total 7.8 2.9 4.9 3,808,843
The percentage of migrants in the total observations is 7.8%, with 4.9% coming from outside
the European Union. Regarding the distribution of migrants per country, Luxembourg (LU)
population has the highest proportion of migrants (45.97%), whereas Bulgaria (BG) and
Romania (RO) exhibit the lowest percentages, both of which less than 1%. If we only
considered migrants from a third country to the European Union, the highest percentages belong
to Latvia (LV) and Estonia (EE) (15.8% and 13.7% respectively). In addition to these two latter
countries, Germany (DE) and Malta (MT) have only migrants from outside the EU. The
distribution of migrants is not available for Slovenia (SI) since there is no data of the variable
PB220A – Citizenship for this country.15 Thus, from now on, only the remaining 30 countries
will be considered in this study.
14 The list with the iso alpha 2 country codes can be checked in the Appendix, Table A.2.
15After specifying the categorization of migrants according to the citizenship status, we will only consider
Regardless the criterion used, it is not possible to go further in categorizing migrant individuals
due to some limitations inherent to the methodology followed by the EU-SILC surveys.16
(ii) Health Status and Healthcare Access
In order to analyze the inequalities between migrants and natives in the state of health, the
EU-SILC contemplates three variables,17 at personal level, to assess the health status of each
respondent: Self-perceived health, which is based on the individual self-assessment of health,
ordered from 1 (Very Good) to 5 (Very Bad); Chronic Disease, i.e., if the individual suffers
from a chronic illness or condition; and, lastly, Limitation in Activities because of health
problems.18
As already previously stated, the access to healthcare is measured through the unmet needs for
healthcare, which is experienced when “there was at least one occasion (in the previous 12
months) when the person reallyneeded examination or treatment but did not receive it” (EU -SILC Description of target variables – 2012 Operation).19 However, unlike some of the
following EU-SILC surveys (e.g. 2016 survey), the unmet need’s question in 2012 does not
allow us to identify the need to healthcare among the individuals who did not declare an unmet
need,20 i.e., it is possible that some respondents did not experience access barriers because they
had no need.21 Nevertheless, this limitation will be taking into account in the empirical
16In addition to the obstacle already presented, i.e., there is no information about the specific country of birth of
the migrant,Lelkes and Zolyomi (2010) identify, amongst others, some limitations: - “there is no information on ethnic status of respondents”;
- it is not possible to measure how long migrants have been in the country and thus, there is “no proxy for the extent of assimilation or integration”;
- “illegal or temporary migrants, in particular, are likely to be underrepresented compared to their actual share within the population”.
17 The original three EU-SILC variables are coded as PH010, PH020 and PH030.
18 The descriptive statistics of the health status factors among migrants are available in Appendix, table A.3. 19 Regarding this particular question, there is no difference between questionnaires in the period 2004-2012. 20 “Was there any time during the past 12 months when you really needed to consult a specialist but did not?” 21In fact, some respondents that evaluate their own health status as Very Good or Good, and so do not really need
methodology to assess the inequalities between migrants and natives in the healthcare
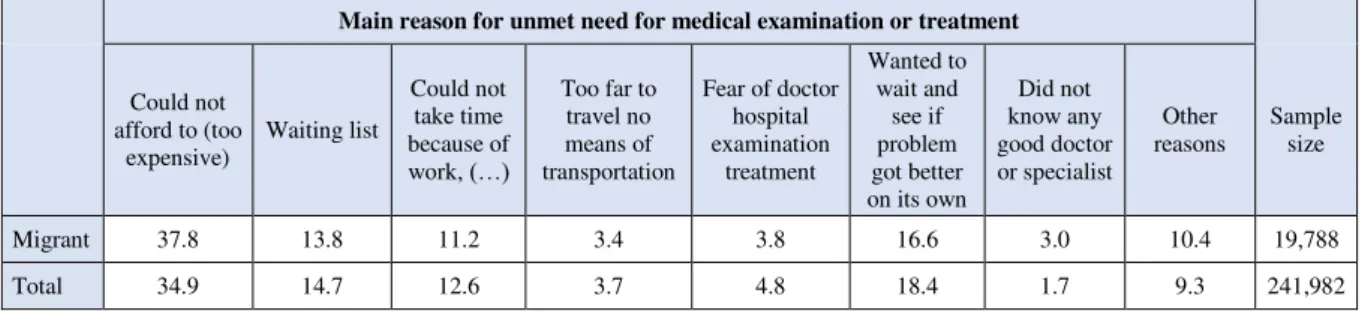
accessibility. Moreover, the EU-SILC survey also asks for the main reason that led to the experience of the unmet need for healthcare.22 In this closed question, the European
questionnaire proposes seven specific reasons and an undefined option.23 Therefore, the
differences between natives and migrants in each specific barrier to healthcare access will also
be evaluated. The distribution of the main reasons for unmet need among the total sample, and
specifically among migrants, is represented in Appendix, table A.5.
(iii) Socio-demographic factors
The main socio-demographic factors considered are age, represented by five age bands {16-29,
30-44, 45-59, 60-74, 75+}, gender and marital status.24 Plus, the individual education is
reported according to the International Standard Classification for Education (ISCED),25 which is
ordered from 1 (pre-primary education) to 6 (1st & 2nd stage of tertiary education). For the
household income level, it was considered the equivalised household income, which is divided
into quintiles, defined for each country and year.26 Lastly, poverty risk is also contemplated.27
An individual is at risk of poverty if the equivalised household income is below the poverty
threshold. The poverty threshold is, according to the EU-SILC, 60% of the median of the
equivalised disposable income.
22 The EU-SILC question is coded as PH060.
23 The EU-SILC’sseven specific reasons are: “Could not afford to (too expensive)”; “Waiting List”; “Could not
take time because of work, care for children or for others”; “Too far to travel/no means of transportation”; “Fear of doctor/hospitals/examination/ treatment”; “Wanted to wait and see if problem got better on its own”; “Didn’t know any good doctor or specialist”. The undefined reason is displayed as “Other Reasons”.
24 The age of each respondent was obtained through the difference between the year when the survey was
conducted (PB010) and the year of birth (PB140). Gender and Marital Status are respectively represented by the EU-SILC variables PB150 and PB190.
25 The education level is based on the highest International Standard Classification for Education level attained
(EU-SILC variable PE040).
26The equivalised household income (EU-SILC variable HX090), takes into account the total disposable income
(HY020), the within household non-response inflation factor (HY025) and the equivalised household size (HX050).
It was applied a purchasing power parity conversion rate, specific for each country and year, on the equivalised household income variable. The conversion rates were obtained in the OECD database.
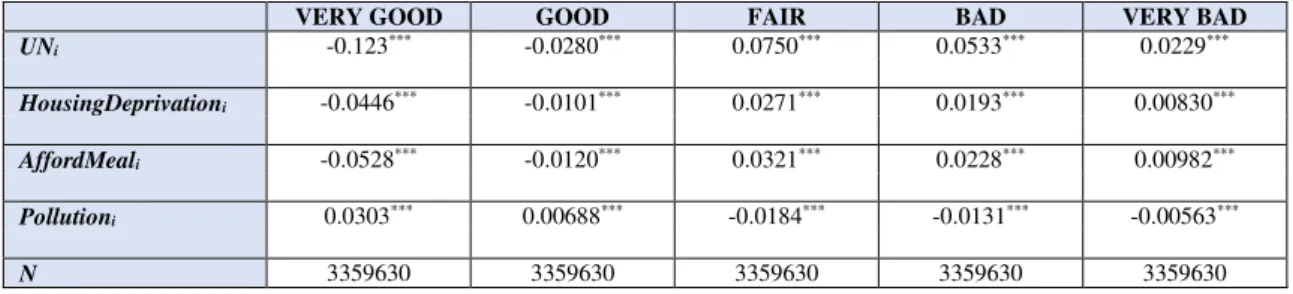
Besides the main socio-demographic factors,28 three specific characteristics that influence the
state of health of the individuals are also considered: poor housing conditions, non-rich diet and
susceptibility to environmental problems.29
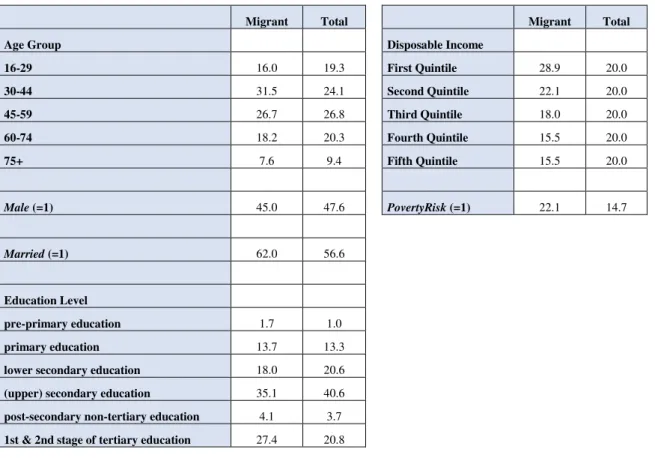
Table 5- Descriptive statistics of the main socio-demographic factors, EU-SILC 2004-2012 (%)
Migrant Total Migrant Total
Age Group Disposable Income
16-29 16.0 19.3 First Quintile 28.9 20.0
30-44 31.5 24.1 Second Quintile 22.1 20.0
45-59 26.7 26.8 Third Quintile 18.0 20.0
60-74 18.2 20.3 Fourth Quintile 15.5 20.0
75+ 7.6 9.4 Fifth Quintile 15.5 20.0
Male (=1) 45.0 47.6 PovertyRisk (=1) 22.1 14.7
Married (=1) 62.0 56.6
Education Level
pre-primary education 1.7 1.0
primary education 13.7 13.3
lower secondary education 18.0 20.6
(upper) secondary education 35.1 40.6
post-secondary non-tertiary education 4.1 3.7
1st & 2nd stage of tertiary education 27.4 20.8
Regarding the age distribution (Table 5), the total sample is concentrated almost equally in the
30-44 and 45-60 age groups (24.1% and 26.8% respectively), while migrants are slightly more
concentrated in the former than in the latter age group (31.5% and 26.7% respectively). The
extreme age group 75+ is the least represented, considering either the total observations or only
migrants (9.4% and 7.6% respectively). The gender distribution among migrants is nearly
28
Although the relevance of labor information on the current activity status and on the current job, which EU-SILC provides through variable PL030, it is not included in the main socio-demographic factors because it is only available for the period 2004-2010.
29
Poor housing conditions is represented by the EU-SILC variable HH040 “Leaking roof, damp walls/floors/foundation, or rot in window frames or floor”; Non-rich diet is related to the “capacity to afford a meal with meat, chicken, fish (or vegetarian equivalent) every second day” (HS050); Susceptibility to environmental problems is assessed if the place where the household lives is affected by “Pollution, grime or other environmental problems” (HS180)
balanced, with the percentage of men being 45%. In respect of the marital status, the proportion
of married individuals in the migrant sample is 62%, which, unlike gender, is slightly different
from the percentage for the total sample (56.6%).
Table 5 also shows that, considering the total sample, the percentage of the individuals with a
tertiary education is 20% approximately, which is lower than that among migrants – 27.4%.
Regarding disposable income, the share of migrants tends to decline as we move from the
lowest (28.9%) to the highest quintile (15.5%). The risk of poverty is higher among migrants
(22.1%) when compared to the total observations of the sample (14.7%).
(iv) Macroeconomic variables
In order to analyze the impact of government's policies that promote the integration of migrants,
a variable that reflects the Migrant Integration Policy Index (MIPEX) score for Health, which
is ranged from 0 to 100, is required. The original MIPEX score was normalized to a 0-10
range.30 Table A.6., in Appendix, presents the normalized MIPEX scores of each country.
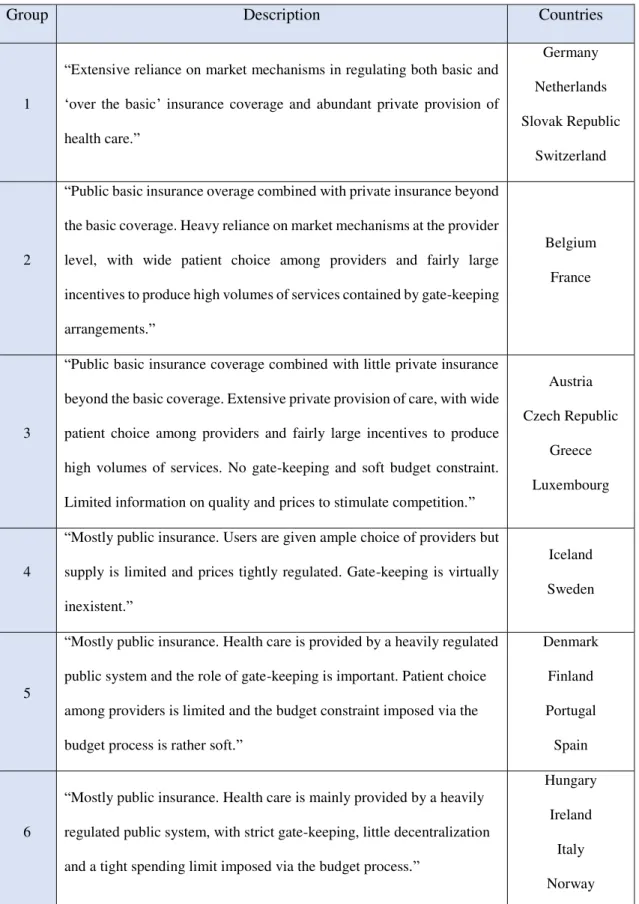
Regarding the role of the healthcare systems’ characteristics in policy decision-making, it was
considered Joumard et al. (2010), which identified six groups of countries, within the OECD,
that share similar healthcare systems.31 According to the descriptions of the different groups of
countries, there is an evidence of a gradual increase of the role of the public sector in health
care systems, from Group 1 to Group 6.
Lastly, there were also considered the macroeconomic levels of education and income.32
30 The normalization process implies the reduction of the score’s range to 10, i.e., if the original country’s
MIPEX score is equal to 64, 65 or 70, it starts to assume the values 6, 7 or 7 respectively.
31 In the Appendix, table A.7 describes these six different groups and the constituent countries of each group.
OECD countries that do not belong to the sample of this study are not considered.
32 The information about the macroeconomic education and income levels was obtained in the Human
4 - Empirical strategy and the Econometric methodology
Although the data is available for different years and different countries, it is not possible to
classify the data as panel data since it is not necessarily the same individuals or households that
respond to the EU-SILC surveys across the years. Thus, as Cameron and Triverdi (2005)
suggest, data with this characteristics must be classified as a repeated cross-section.
The analysis of the inequalities between migrants and natives in the state of health would be
based on the following three variables provided by the EU-SILC surveys:33 self-perceived
health, report of a chronic disease and limitation in activities because of health problems.
However, in order to carry out a more complete and thorough analysis, and to respond to the
issues that have been identified by the literature, it would be necessary to have more information
about the migrant population, namely the specific country of birth, the ethnic status and how
long migrants have been in the host country. Given this data restriction and in the impossibility
to draw the desired evidence, an econometric analysis was not performed on this issue.
On the other hand, this information restriction is not significant enough to prevent an analysis
of the access to healthcare. The econometric approach is based on non-linear models since the
dependent variables are discrete and binary.34 Giving preference to the assumption that the error
terms, apart from being independent, are normally distributed, the chosen non-linear model to
perform the empirical analysis is the probit model, given by:
𝑝(𝑦𝑖 = 1|𝑥𝑖) = 𝐹(𝑥𝑖′𝛽) = Φ(𝑥𝑖′𝛽),
where Φ(. ) is the standard normal cumulative distribution function.
33Henceforward, natives represent the individuals that were born in the country of residency.
34 Despite the existence of the possibility of performing a linear probability model, the technical reasons pointed
The empirical strategy to analyze the inequalities between migrants and natives in the access to
healthcare starts with a generic regression:
𝑝(𝑈𝑁𝑖 = 1|𝑥𝑖) = Φ(𝛽1𝑀𝑖𝑔𝑟𝑎𝑛𝑡𝑖+ 𝛽2𝑆𝑒𝑙𝑓𝑃𝑒𝑟𝑐𝑒𝑖𝑣𝑒𝑑𝐻𝑒𝑎𝑙𝑡ℎ𝑖+ β3𝑋𝑖)
The dependent dummy variable 𝑈𝑁𝑖 represents the unmet needs of individual i and evaluates,
in this study, the healthcare accessibility. This model regresses 𝑈𝑁𝑖 on the migrant status
dummy variable (𝑀𝑖𝑔𝑟𝑎𝑛𝑡𝑖), 𝑆𝑒𝑙𝑓𝑃𝑒𝑟𝑐𝑒𝑖𝑣𝑒𝑑𝐻𝑒𝑎𝑙𝑡ℎ𝑖 and on other control variables (𝑋𝑖),
which includes the binary variables for the main socio-demographic factors and the
macroeconomic levels of education and income, and dummies for years and countries. The
rationale for including the variable 𝑆𝑒𝑙𝑓𝑃𝑒𝑟𝑐𝑒𝑖𝑣𝑒𝑑𝐻𝑒𝑎𝑙𝑡ℎ𝑖, in order to control for the
individual health status, is related to the issue that was addressed in the previous section, i.e.,
the EU-SILC surveys for the period 2004-2012 do not allow us to identify the need for
healthcare among the respondents that did not experience access barriers. However, this
variable in this model is potentially endogenous, whose source is simultaneity.35 The proposed
solution to this problem follows the conditional mixed-process (CMP) framework implemented
by Roodman (2011), which proposes a joint estimation of two equations “with linkages among
their error processes”. Thus, the generic regression must then be represented by:36
{ 𝑝(𝑆𝑒𝑙𝑓𝑃𝑒𝑟𝑐𝑒𝑖𝑣𝑒𝑑𝐻𝑒𝑎𝑙𝑡ℎ𝑝(𝑈𝑁𝑖= 1|𝑥𝑖) = Φ(𝛽1𝑀𝑖𝑔𝑟𝑎𝑛𝑡𝑖+ 𝛽2𝑆𝑒𝑙𝑓𝑃𝑒𝑟𝑐𝑒𝑖𝑣𝑒𝑑𝐻𝑒𝑎𝑙𝑡ℎ𝑖+ β3𝑋𝑖)
𝑖= 𝑗 − 1) = Φ(𝛼𝑗− 𝛿1𝑈𝑁𝑖− 𝛿2𝐻𝑖− 𝛿3𝑍𝑖) − Φ(𝛼𝑗−1− 𝛿1𝑈𝑁𝑖− 𝛿2𝐻𝑖− 𝛿2𝑍𝑖)
Regarding the second equation, 𝑈𝑁𝑖 is the dummy variable for Unmet needs, 𝐻𝑖 represents the
three specific socio-demographic characteristics that theoretically influence the state of health
and not the unmet needs. 𝑍𝑖includes the main socio-demographic factors, and dummies for
years and countries.
35 Simultaneity occurs when an independent variable x explains and is explained by a dependent variable y
simultaneously. If this problem is not taken into account, the model’s estimates are biased.
36 Since SelfPerceivedHealth is a multinomial variable, ordered from 1 (very good) to 5 (very bad), the appropriate
model is the ordered probit. 𝛼 represents the threshold parameters.
After analyzing the unmet needs in general, it is important to focus on each specific reason that
led to the unmet needs.37 The responses are mutually exclusive, i.e., only one reason can be
chosen per respondent. Thus, an unordered multinomial logit model is appropriate, which is
given by:
𝑝(𝑈𝑁𝑅𝑒𝑎𝑠𝑜𝑛𝑖= 𝑗) = exp(𝛽1𝑗𝑀𝑖𝑔𝑟𝑎𝑛𝑡𝑖+ β2𝑗𝑋𝑖)
∑𝐽𝑗=1exp(𝛽1𝑗𝑀𝑖𝑔𝑟𝑎𝑛𝑡𝑖+ β2𝑗𝑋𝑖)
, 𝑗 = 1, … , 738 (𝟏. 𝟏)
Model (1.1) does not require a CMP framework since it is not necessary to include
𝑆𝑒𝑙𝑓𝑃𝑒𝑟𝑐𝑒𝑖𝑣𝑒𝑑𝐻𝑒𝑎𝑙𝑡ℎ𝑖 as a control variable: only the individuals who have experienced an
unmet need can identify the main reason that led to this experience.
Considering the specific European Union's context regarding access to healthcare, the
inequalities between migrants and natives will be analyzed only for the EU countries, in order
to investigate what happens when the degree of migration increases.38 The econometric
methodologies implemented in (1) and (1.1) are and respectively replicated for the variable 𝑈𝑁𝑖
[(2.1); (2.2); (2.3)],39 as well as for 𝑈𝑁𝑅𝑒𝑎𝑠𝑜𝑛𝑖 [(2.1.1); (2.2.1); (2.3.1)].40
The empirical strategy ends with the analysis of the impact of government's policies, which aim
the integration of migrants, and the role of the healthcare systems’ characteristics on the
healthcare access among migrants, regardless of the reason. Two separate regressions will have
to be performed since each one of them implies specific data constraints. The impact of these
specific national state policies will be evaluated through the MIPEX. However, the MIPEX
score for Health, in particular, is only available for 2014, and the defined time range of the
EU-SILC database is 2004-2012. Because of this no time coincidence, the impact of the MIPEX
37 The seven reasons are specified in footnote 23.
38 In the specific European Union context, it is considered, in this study, that the degree of migration increases
when we restrict the migrant group as follows: (Migrant – Migrant from outside the EU - Migrant from outside the EU and without EU citizenship). For instance, in France, a Brazilian-born citizen is considered more migrant than a Brazilian-born German citizen, and the latter is more migrant than a German-born citizen.
39 The migrant status explanatory variable in the regressions (2.1), (2.2) and (2.3) are respectively Migrant, Migrant
from (born) outside the EU and Migrant from (born) outside the EU and without EU citizenship.
score for Health on the access to healthcare will be assessed only for the year of 2012.41 On the
other hand, the analysis of the role of the healthcare systems’ characteristics is restricted
spatially, i.e., it is only available for the OECD member countries. Thus, these two models,
which use the same control variables as (1), are defined as follows:
{ 𝑝(𝑈𝑁_2012_𝑀𝑖𝑔𝑟𝑎𝑛𝑡𝑝(𝑆𝑒𝑙𝑓𝑃𝑒𝑟𝑐𝑒𝑖𝑣𝑒𝑑𝐻𝑒𝑎𝑙𝑡ℎ𝑖42= 1|𝑥𝑖) = Φ(𝛽1𝑀𝐼𝑃𝐸𝑋𝑖+ 𝛽2𝑆𝑒𝑙𝑓𝑃𝑒𝑟𝑐𝑒𝑖𝑣𝑒𝑑𝐻𝑒𝑎𝑙𝑡ℎ𝑖+ β3𝑋𝑖) 𝑖= 𝑗 − 1) = Φ(𝛼𝑗−𝛿1𝑈𝑁𝑖− 𝛿2𝐻𝑖− 𝛿3𝑍𝑖) − Φ(𝛼𝑗−1−𝛿1𝑈𝑁𝑖−𝛿2𝐻𝑖− 𝛿3𝑍𝑖)
{ 𝑝(𝑈𝑁_𝑂𝐸𝐶𝐷_𝑀𝑖𝑔𝑟𝑎𝑛𝑡𝑖43= 1|𝑥𝑖) = Φ(𝛽1𝑂𝐸𝐶𝐷𝑔𝑟𝑜𝑢𝑝𝑖+ 𝛽2𝑆𝑒𝑙𝑓𝑃𝑒𝑟𝑐𝑒𝑖𝑣𝑒𝑑𝐻𝑒𝑎𝑙𝑡ℎ𝑖+ β3𝑋𝑖) 𝑝(𝑆𝑒𝑙𝑓𝑃𝑒𝑟𝑐𝑒𝑖𝑣𝑒𝑑𝐻𝑒𝑎𝑙𝑡ℎ𝑖= 𝑗 − 1) = Φ(𝛼𝑗−𝛿1𝑈𝑁𝑖− 𝛿2𝐻𝑖− 𝛿3𝑍𝑖) − Φ(𝛼𝑗−1−𝛿1𝑈𝑁𝑖− 𝛿2𝐻𝑖− 𝛿3𝑍𝑖)
𝑀𝐼𝑃𝐸𝑋𝑖 and 𝑂𝐸𝐶𝐷𝑔𝑟𝑜𝑢𝑝𝑖 include k-1 dummies for each MIPEX score and for each OECD group
identified by Joumard (2011), respectively.
The results in the following section were obtained through the software Stata. In models
(1)-(4), the effect of the explanatory variables is measured by marginal effects,44 since we are
dealing with nonlinear models. The marginal effects presented in the next section are Average
Marginal Effects (AME).
Results
Regarding the main reasons for unmet need for medical care, the interpretation of the results,
which are exhibited in tables 7 and 8.1-8.3, is only focused on the reasons that were significantly
more experienced by migrants (Appendix, table A.5).45 Multinomial models (1.1, 2.1.1, 2.2.1,
2.3.1) do not violate the IIA46 assumption (Appendix, tables A.10).
In models (1) and (1.1), the AME’s for the explanatory variable of interest, Migrant, are always
41This two years gap is negligible since the MIPEX overall score, which is available since 2007, did not change
significantly between 2012 and 2014 - the country’s average growth rate of MIPEX overall score between 2012 and 2014 was about 0,7%.
42The dependentvariable in model (3)represents the unmet needs among migrants for the year of 2012. 43The dependentvariable in model (4)represents the unmet needs among migrants for the OECD countries.
44 The theoretical method for obtaining marginal effects can be found in Cameron and Triverdi (2005).
45 The main reasons that were significantly experienced by, at least, 10% of the migrants are identified in bold in
Tables 7 and 8.1-8.3.
46 Independence of Irrelevant Alternatives
(3)
statistically significant at a 5% level, except for the reason related to time constraints. Migrants
are 0.977 percentage points (p.p.) more likely than natives to experience an unmet need, ceteris
paribus.47 Despite the very low significance of this AME in economic terms, its sign indicates
that the inequality between migrants and natives is unfavorable to the former. Table 7 also
shows that migrants are 4.87 p.p. more likely to face an unmet need because they could not
afford the healthcare service. Regarding the other reasons, which are not as experienced by
migrants as the latter, only "Wanted to wait and see if problem got better” has a slightly similar
magnitude, but with opposite sign.48
The positive sign of the marginal effect for the variable SelfPerceivedHealth indicates that
individuals who self-evaluate themselves as unhealthy are on average more likely to experience
an unmet need than their counterparts. This sign, which is expected, may be explained by the
fact that the unmet needs are more likely to be experienced by those who need healthcare most.
It will also be interesting to look at the inverse causality, i.e., the fact of having a low health
status results from experiencing unmet needs.49
Regarding the main socio-demographic factors, the magnitude of the AME’s is relatively more
significant than that for Migrant. Individuals aged 30-44 (AgeGroup2) are 5.28 p.p. more likely
to report an unmet need than individuals aged 75 or more (AgeGroup5). Concerning the reasons
that lead to unmet need, the most relevant role of age is in the reason related to time constraints,
which is expected since the majority of the individuals within the labor force or with children
to take care of are in the lowest age groups. Individuals with the lowest education level,
pre-primary (EducLv1), are only 0.651 p.p. more likely to experience an unmet need than
individuals with the highest education level (EducLv6). However, if we focus on the reason that
47Henceforward, every interpretation of the AME’s follows the ceteris paribus assumption.
48 Since each respondent can choose only one reason for the unmet needs (mutually exclusive responses), it is expected that the AME’s compensate for each other.
49 The results of conditional mixed process for the second equation of the system of equations (1) described in
deals with financial constraints, the magnitude of the difference between the lowest and the
highest level of education increases substantially: an individual with the lowest education level
is 10.789 p.p. more likely to have an unmet need due to financial reasons than those with the
highest level.
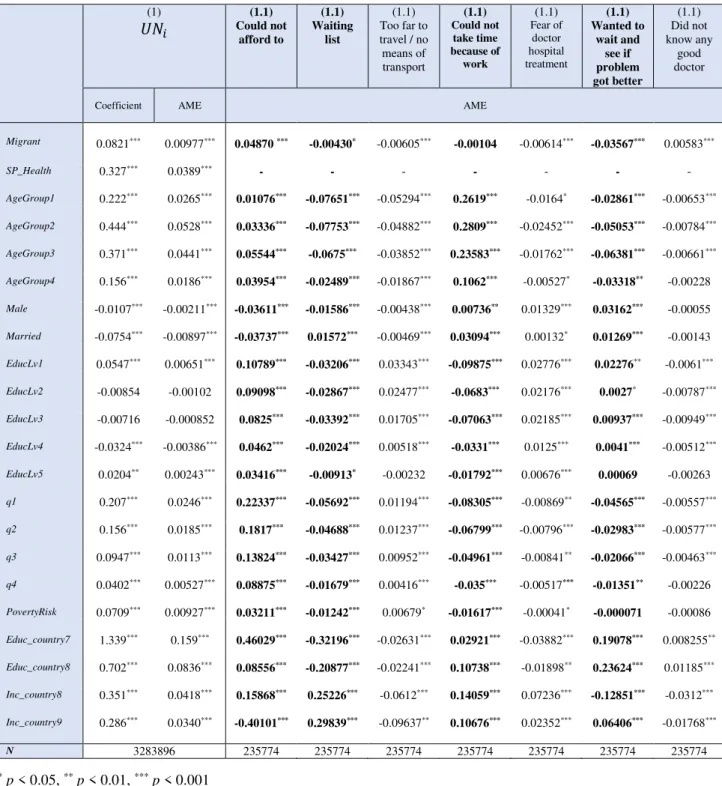
Table 7 - Results for Models (1)and (1.1)50 (1) 𝑈𝑁𝑖 (1.1) Could not afford to (1.1) Waiting list (1.1) Too far to travel / no means of transport (1.1) Could not take time because of work (1.1) Fear of doctor hospital treatment (1.1) Wanted to wait and see if problem got better (1.1) Did not know any good doctor
Coefficient AME AME
Migrant 0.0821*** 0.00977*** 0.04870 *** -0.00430* -0.00605*** -0.00104 -0.00614*** -0.03567*** 0.00583***
SP_Health 0.327*** 0.0389*** - - - - - - -
AgeGroup1 0.222*** 0.0265*** 0.01076*** -0.07651*** -0.05294*** 0.2619*** -0.0164* -0.02861*** -0.00653***
AgeGroup2 0.444*** 0.0528*** 0.03336*** -0.07753*** -0.04882*** 0.2809*** -0.02452*** -0.05053*** -0.00784***
AgeGroup3 0.371*** 0.0441*** 0.05544*** -0.0675*** -0.03852*** 0.23583*** -0.01762*** -0.06381*** -0.00661***
AgeGroup4 0.156*** 0.0186*** 0.03954*** -0.02489*** -0.01867*** 0.1062*** -0.00527* -0.03318** -0.00228
Male -0.0107*** -0.00211*** -0.03611*** -0.01586*** -0.00438*** 0.00736** 0.01329*** 0.03162*** -0.00055
Married -0.0754*** -0.00897*** -0.03737*** 0.01572*** -0.00469*** 0.03094*** 0.00132* 0.01269*** -0.00143
EducLv1 0.0547*** 0.00651*** 0.10789*** -0.03206*** 0.03343*** -0.09875*** 0.02776*** 0.02276** -0.0061***
EducLv2 -0.00854 -0.00102 0.09098*** -0.02867*** 0.02477*** -0.0683*** 0.02176*** 0.0027* -0.00787***
EducLv3 -0.00716 -0.000852 0.0825*** -0.03392*** 0.01705*** -0.07063*** 0.02185*** 0.00937*** -0.00949***
EducLv4 -0.0324*** -0.00386*** 0.0462*** -0.02024*** 0.00518*** -0.0331*** 0.0125*** 0.0041*** -0.00512***
EducLv5 0.0204** 0.00243*** 0.03416*** -0.00913* -0.00232 -0.01792*** 0.00676*** 0.00069 -0.00263
q1 0.207*** 0.0246*** 0.22337*** -0.05692*** 0.01194*** -0.08305*** -0.00869** -0.04565*** -0.00557***
q2 0.156*** 0.0185*** 0.1817*** -0.04688*** 0.01237*** -0.06799*** -0.00796*** -0.02983*** -0.00577***
q3 0.0947*** 0.0113*** 0.13824*** -0.03427*** 0.00952*** -0.04961*** -0.00841** -0.02066*** -0.00463***
q4 0.0402*** 0.00527*** 0.08875*** -0.01679*** 0.00416*** -0.035*** -0.00517*** -0.01351** -0.00226
PovertyRisk 0.0709*** 0.00927*** 0.03211*** -0.01242*** 0.00679* -0.01617*** -0.00041* -0.000071 -0.00086
Educ_country7 1.339*** 0.159*** 0.46029*** -0.32196*** -0.02631*** 0.02921*** -0.03882*** 0.19078*** 0.008255**
Educ_country8 0.702*** 0.0836*** 0.08556*** -0.20877*** -0.02241*** 0.10738*** -0.01898** 0.23624*** 0.01185***
Inc_country8 0.351*** 0.0418*** 0.15868*** 0.25226*** -0.0612*** 0.14059*** 0.07236*** -0.12851*** -0.0312***
Inc_country9 0.286*** 0.0340*** -0.40101*** 0.29839*** -0.09637** 0.10676*** 0.02352*** 0.06406*** -0.01768***
N 3283896 235774 235774 235774 235774 235774 235774 235774
*p < 0.05, **p < 0.01, ***p < 0.001
The differences between the lowest and the highest quintile (q5), regarding the probability of
reporting an unmet need, are relatively more significant in economic terms than those between
migrants and natives: individuals in the lowest quintile are on average 2.46 p.p. more likely to
experience an unmet need than those in the highest quintile. Moreover, when considering the
reason that is most influenced by income, the magnitude is considerable higher: individuals
within the lowest quintile are 22.3 p.p. more likely to declare an unmet need due to financial
reasons than those within the highest. Still regarding this latter reason, the dummy variable that
indicates poverty risk does not exhibit a comparable magnitude, when contrasting to the AME’s
for the lowest quintile. This difference of magnitudes may be due to the definition of poverty
threshold used by the EU-SILC.51 Gender and marital status differences do not have a
substantial impact on unmet needs. On the other hand, the probability of reporting an unmet
need is, on average, higher in countries with lower scores for Education and Income than those
with higher scores.
Tables 8.1-8.352 exhibit the results for the models that consider only the European Union
member-states, in order to assess the degree of migration in this specific context. The AME’s
for the migrant status variables are presented in these three tables. The degree of migration does
not have a determinant role in the probability of reporting an unmet need in absolute terms,
which is not the case in relative terms: while migrants are 0.749 p.p. more likely to experience
an unmet need than natives, migrants born outside the EU and without EU citizenship are 1.456
p.p. more likely to report the same problem than natives, migrants born in the EU, and migrants
born outside the EU with EU citizenship. Among the reasons for unmet needs, the AME’s for
the financial reason, which exhibit the highest magnitudes, vary more significantly in absolute
terms than those for the remaining reasons, when the degree of migration changes from
51 See end of page 12.
52 The results for the remaining variables, except the dummies for years and countries, can be found in Appendix.
𝒙𝟏to 𝒙𝟑. It is also important to highlight that citizenship contributes undoubtedly more for that
significant variation than the country of birth, since the AME for financial reasons decreases
from (2.1.1) to (2.2.1) and increases from (2.2.1) to (2.3.1). The latter indicates that migrants
born outside the EU and without EU citizenship are around 8 p.p. more likely to report an unmet
need due to financial reasons than their counterparts.
Tables 8.1-8.3 - Average Marginal Effects for Models (2) (only European Union countries)
𝑈𝑁𝑖 Could not afford to Waiting list
Too far to travel / no means of transport Could not take time because of work, care for children of for others
Fear of doctor hospital examination treatment Wanted to wait and see if problem got better Did not know any good doctor
(2.1) (2.1.1) (2.1.1) (2.1.1) (2.1.1) (2.1.1) (2.1.1) (2.1.1)
𝒙𝟏 0.00749*** 0.05259*** -0.00392* -0.00466*** 0.000265 -0.00691*** -0.03612*** 0.0058***
N 3131964 229545 229545 229545 229545 229545 229545 229545
(2.2) (2.2.1) (2.2.1) (2.2.1) (2.2.1) (2.2.1) (2.2.1) (2.2.1)
𝒙𝟐 0.00914*** 0.04512*** -0.00219 -0.00554*** 0.00006 -0.00787*** -0.03898*** 0.00615***
N 3131964 229545 229545 229545 229545 229545 229545 229545
(2.3) (2.3.1) (2.3.1) (2.3.1) (2.3.1) (2.3.1) (2.3.1) (2.3.1)
𝒙𝟑 0.01456*** 0.07938*** -0.0091*** -0.00679*** -0.00678*** -0.01247*** -0.04191*** 0.00652***
N 3131964 229545 229545 229545 229545 229545 229545 229545
* p < 0.05, ** p < 0.01, *** p < 0.001
Explanatory variables - 𝑥1: Migrant; 𝑥2: Migrant born outside the European Union; 𝑥3: Migrant born outside the European Union and without EU citizenship.The counterparts of the dummy variables 𝒙𝟏, 𝒙𝟐and𝒙𝟑 are respectively: natives; natives and migrants born in the EU; natives,
migrants born in the EU and migrants born outside the EU with EU citizenship
Graph 1 illustrates the AME’s for the dummy variables for the MIPEX scores for health. Higher
scores of MIPEX indicate that countries, through national policies, integrate migrants better.
The positive linear trend, followed by the AME’s, demonstrates the opposite, since the
probability of a migrant experiencing an unmet need is approximately 15 p.p. lower in a country scored ‘3’ than in a country scored ‘7’.53The AME’s for the dummy variables for each group
of countries that share similar healthcare system’s characteristics are represented in Graph 2.
The probability of a migrant reporting an unmet need, for any of the five groups, is higher than
that for group1, which has the least state intervention in the health sector.53 Furthermore, it is
possible to identify four clusters of AME’s among the six groups, being the middle clusters
close to each other: group1; group2 and group5; group3 and group6; and group4.
53
Graph 1 - Model (3) Graph 2 - Model (4)
Graph 1 - Impact of MIPEX scores on unmet needs among migrants, in 2012.
Graph 2 - Impact of OECD groups, which share similar healthcare systems characteristics, on unmet needs among migrants.
6
–
Discussion and Conclusion
This research analyzes the inequalities in the healthcare accessibility for the group of migrants,
considering thirty European countries and the period of 2004-2012.
The EU-SILC is a reference source that collects a large amount of data, which covers several
subject areas, such as health and healthcare. The significant advantage of this database is the
possibility to perform an analysis on a great scale. However, while presenting this advantage of
concentrating data from different countries, it also exhibits some limitations, which were crucial
in the course of this study. Moreover, it becomes evident in the beginning, since, in the absence
of a universal definition, this study obliges to the formulation of the concept of the migrant. In
this present research, the migrant is defined according to the country of birth, and given the
specific characteristics of the individuals in this sample, it is complemented according to the
citizenship. However, there is no access to relevant and specific information about the migrant,
which consequently resulted in the non-performance of the analysis of the state of health of the
migrants, contrasting with that of the natives. EU-SILC provides information on unmet needs.
Given the availability of unmet needs in this database, associated with the contributions of part
of the literature, this indicator was chosen as a proxy to measure access to healthcare.
Regarding the most important results in this subject area, we initially observe that there are no
substantial differences between migrants and natives in access to healthcare. On the other hand,
-.
2
-.
1
0
MIPEX2 MIPEX3 MIPEX4 MIPEX5 MIPEX6 Effects with Respect to
Average Marginal Effects with 95% CIs
0
.1
group2 group3 group4 group5 group6 Effects with Respect to
Average Marginal Effects with 95% CIs
the transition from one age group to another affect relatively more unmet needs than the fact of
being migrant. Thus, the motives to these differences between age groups, which disadvantage
younger individuals, deserve a careful attention from the healthcare systems.
Then, we look at the specific context of the European Union, where EU citizens have the right
to healthcare transnationally. When the degree of migration increases, i.e., when we gradually
restrict the migrant sample to the individuals born outside the EU and without EU citizenship,
the inequality, in reporting an unmet need, increases expressively in relative terms. If we look
at the more experienced main reason for unmet need by migrants, the financial reason, those
same differences in the access to healthcare are amplified. Although we are not dealing with a
pronounced inequality in absolute terms, we can extrapolate the marked impact of the degree
of migration: if particular categories of migrants, which may be underrepresented or not
represented at all, were considered and explicitly identified in the EU-SILC database (e.g.,
illegal and temporary migrants, or refugees), the inequality might be more evident as these
categories are expected to be more financially disadvantaged.
The apparent paradox inherent in the results of the model using MIPEX data may be related to
a possible mismatch of interpretation of access to healthcare between MIPEX and EU-SILC.
Another reason may be associated with the data restriction faced in this research, thus
suggesting that further investigations should be conducted to study the relationship between
MIPEX scores for health and unmet needs, for a longer period. Lastly, it is also possible that
the countries in each MIPEX score group exhibit other macroeconomic similarities, which
might influence the obtained results. This latter reason is also valid for the results of the model
that is based on groups that share similar healthcare system’s characteristics. Yet, the
differences between healthcare systems appear to do not have an impact on unmet needs among
migrants, since distant groups, regarding public intervention in the health sector, exhibit similar
In an increasingly globalized world, where health is a clear determining factor in the life of
human beings, the inequalities in the access to healthcare services certainly need to be the
concern of future investigations. This particular subject must be analyzed for the period 2016
onwards, where the EU-SILC question on unmet needs explicitly distinguishes individuals that
need healthcare from those that do not.
References
Abraído-Lanza, Ana, Dohrenwend, Bruce, Ng-Mak, Daisy and Jana Turner.1999. “The Latino mortality paradox: a test of the “salmon bias” and healthy migrant hypotheses.”American Journal of Public Health, 89(10):1543-1548
Acheson, Roym.1978. “The definition and identification of need for health care”. J Epidemiol Community Health, 32(1):10-5. Barros, Pedro. 2016. Economia da Saúde – Conceitos e comportamentos. Coimbra, Portugal: Livraria Almedina
Bart, Jacobs, Ir, Por, Bigdeli, Maryam, Annear, Peter, Wim Van Damme. 2012. “Addressing access barriers to health services: an analytical framework for selecting appropriate interventions in low-income Asian countries”. Health Policy Plan, 27(4):288-300
Bhugra, Dinesh, and Matthew A. Becker.(2005) “Migration, Cultural Bereavement and Cultural Identity.”World
Psychiatry 4(1):18-24
Cameron, Adrian and Pravin Trivedi. 2005. Microeconometrics: Methods and applications. New York, United States of America: Cambridge University Press
Connolly, Sheelah and Maev-Ann Wren. 2017. “Unmet healthcare needs in Ireland: Analysis using the EU-SILC survey”.
Health Policy, 121(4):434-441
Constant, Amelie. 2017. “The Healthy Immigrant Paradox and Health Convergence”.ifo DICE Report,15(3):20-25 Domnich, Alexander, Panatto, Donatella, Gasparini, Roberto and Daniela Amicizia.2012. “The “healthy immigrant” effect: does it exist in Europe today?”. Italian Journal of Public Health, 9(3):1-7
Folland, Sherman, Goodman, Allen, Stano, Miron. 2007. The Economics of Health and Health Care. New Jersey, United States of America: Pearson
Guidi, Caterina, Palència, Laia, Ferrini, Silvia and Davide Malmusi. 2016. “Inequalities by Immigrant Status in Unmet
Needs for Healthcare in Europe: The Role of Origin, Nationality and Economic Resources”. SSRN Electronic Journal
Hannigan, Ailish, O'Donnell, Patrick, O'Keeffe, Mary, and Anne MacFarlane. 2016. How do variations in definitions of
"migrant" and their application influence the access of migrants to health care services? Copenhagen, Denmark: World Health
Organization, Regional Office for Europe.
Huddleston, Thomas, Bilgili, Özge, Joki, Anne-Linde and Zvezda Vankova. 2015. Migrant Integration Policy Index. Barcelona Center for International Affairs (CIDOB)
Joumard, Isabelle, Andre, Christophe and Chantal Nicq.2010. “Health Care Systems: Efficiency and Institutions”. OECD Economics Department Working Paper No. 769.
Lebihan, Laetitia, Takongmo, Charles and Fanny McKellips.2017. “Health Inequalities for Immigrants in Canada: Quebec Versus the Rest of Canada”. Available at SSRN.
Lelkes, Orsolya and Eszter Zolyomi.2010. “Detailed analysis of the relative position of migrants”.Social Situation
Observatory, Research Note 1/2010
Mladovsky, Philipa. 2009. “A framework for analysing migrant health policies in Europe”. Health Policy, 93(1):55-63 Rechel, Bernd, Mladovsky, Philipa and Walter Devillé. 2011. “Monitoring the health of migrants” In Migration and health
in the European Union, 81-98. Maidenhead, Berkshire, England: Open University Press.
Roodman, David.2011. “Fitting fully observed recursive mixed-process models with cmp”. Stata Journal, 11(2):159–206 Shai, Donna and Ira Rosenwaike.1987. “Mortality among Hispanics in metropolitan Chicago: An examination based on vital statistics data.” Journal of Chronic Diseases,40(5):445-51
Turra, Cassio and Irma Elo. 2008. “The Impact of Salmon Bias on the Hispanic Mortality Advantage: New Evidence from Social Security Data”.Population research and policy review, 27(5):515-530.
Waidmann, Timothy. 2003. How race/ethnicity, immigration status and language affect health insurance coverage, access
Appendix
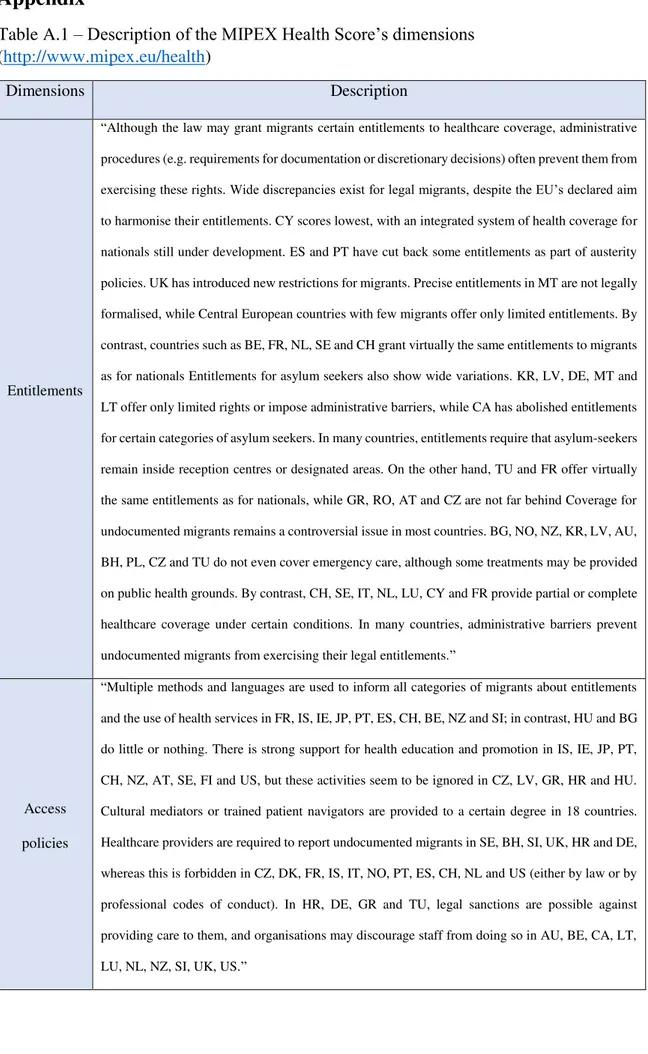
Table A.1 –Description of the MIPEX Health Score’s dimensions
(http://www.mipex.eu/health)
Dimensions Description
Entitlements
“Although the law may grant migrants certain entitlements to healthcare coverage, administrative
procedures (e.g. requirements for documentation or discretionary decisions) often prevent them from
exercising these rights. Wide discrepancies exist for legal migrants, despite the EU’s declared aim
to harmonise their entitlements. CY scores lowest, with an integrated system of health coverage for
nationals still under development. ES and PT have cut back some entitlements as part of austerity
policies. UK has introduced new restrictions for migrants. Precise entitlements in MT are not legally
formalised, while Central European countries with few migrants offer only limited entitlements. By
contrast, countries such as BE, FR, NL, SE and CH grant virtually the same entitlements to migrants
as for nationals Entitlements for asylum seekers also show wide variations. KR, LV, DE, MT and
LT offer only limited rights or impose administrative barriers, while CA has abolished entitlements
for certain categories of asylum seekers. In many countries, entitlements require that asylum-seekers
remain inside reception centres or designated areas. On the other hand, TU and FR offer virtually
the same entitlements as for nationals, while GR, RO, AT and CZ are not far behind Coverage for
undocumented migrants remains a controversial issue in most countries. BG, NO, NZ, KR, LV, AU,
BH, PL, CZ and TU do not even cover emergency care, although some treatments may be provided
on public health grounds. By contrast, CH, SE, IT, NL, LU, CY and FR provide partial or complete
healthcare coverage under certain conditions. In many countries, administrative barriers prevent
undocumented migrants from exercising their legal entitlements.”
Access
policies
“Multiple methods and languages are used to inform all categories of migrants about entitlements
and the use of health services in FR, IS, IE, JP, PT, ES, CH, BE, NZ and SI; in contrast, HU and BG
do little or nothing. There is strong support for health education and promotion in IS, IE, JP, PT,
CH, NZ, AT, SE, FI and US, but these activities seem to be ignored in CZ, LV, GR, HR and HU.
Cultural mediators or trained patient navigators are provided to a certain degree in 18 countries.
Healthcare providers are required to report undocumented migrants in SE, BH, SI, UK, HR and DE,
whereas this is forbidden in CZ, DK, FR, IS, IT, NO, PT, ES, CH, NL and US (either by law or by
professional codes of conduct). In HR, DE, GR and TU, legal sanctions are possible against
providing care to them, and organisations may discourage staff from doing so in AU, BE, CA, LT,
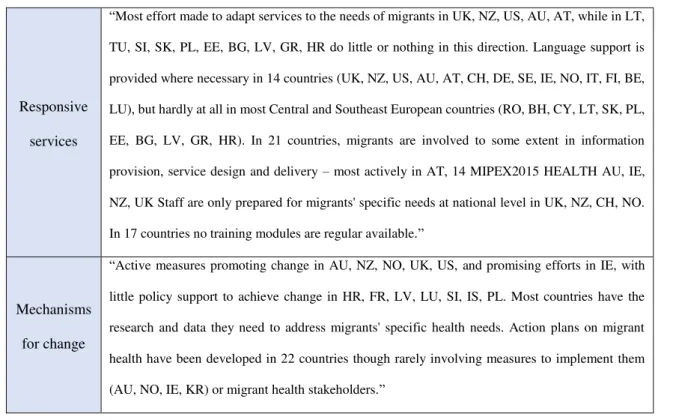
Responsive
services
“Most effort made to adapt services to the needs of migrants in UK, NZ, US, AU, AT, while in LT,
TU, SI, SK, PL, EE, BG, LV, GR, HR do little or nothing in this direction. Language support is
provided where necessary in 14 countries (UK, NZ, US, AU, AT, CH, DE, SE, IE, NO, IT, FI, BE,
LU), but hardly at all in most Central and Southeast European countries (RO, BH, CY, LT, SK, PL,
EE, BG, LV, GR, HR). In 21 countries, migrants are involved to some extent in information
provision, service design and delivery – most actively in AT, 14 MIPEX2015 HEALTH AU, IE,
NZ, UK Staff are only prepared for migrants' specific needs at national level in UK, NZ, CH, NO.
In 17 countries no training modules are regular available.”
Mechanisms
for change
“Active measures promoting change in AU, NZ, NO, UK, US, and promising efforts in IE, with
little policy support to achieve change in HR, FR, LV, LU, SI, IS, PL. Most countries have the
research and data they need to address migrants' specific health needs. Action plans on migrant
health have been developed in 22 countries though rarely involving measures to implement them
(AU, NO, IE, KR) or migrant health stakeholders.”
Table A.2. –iso alpha 2 country codes, organized alphabetically and by EU membership, 2012
Code Country Code Country
AT Austria LT Lithuania
BE Belgium LV Latvia
BG Bulgaria MT Malta
CY Cyprus NL The
Netherlands
CZ Czech
Republic PL Poland
DE Germany PT Portugal
DK Denmark RO Romania
EE Estonia SE Sweden
ES Spain SI Slovenia
FI Finland SK Slovakia
FR France UK The United
Kingdom
GR Greece CH Switzerland
HU Hungary HR Croatia
IE Ireland IS Iceland
IT Italy NO Norway