Article
Printed in Brazil - ©2015 Sociedade Brasileira de Química0103 - 5053 $6.00+0.00A
*e-mail: [email protected]; [email protected]
Discrimination of
Annona muricata
and
Rollinia mucosa
Extracts by Using
Multivariate Curve Resolution and Partial Least-Squares Regression of Liquid
Chromatography-Diode Array Data
Sabrina Afonso,a Pablo L. Pisano,b Fabiano B. Silva,a Ieda S. Scaminio*,a and
Alejandro C. Olivieri*,b
aLaboratório de Quimiometria em Ciências Naturais, Departamento de Química,
Universidade Estadual de Londrina, CP 6001, 86051-990 Londrina-PR, Brazil
bDepartamento de Química Analítica, Facultad de Ciencias Bioquímicas y
Farmacéuticas,Universidad Nacional de Rosario, S2002LRK Rosario, Argentina
Species of the Annonaceae family are used in traditional medicine, and several antitumor acetogenins have been isolated from the leaves of Annona muricata and Rollinia mucosa.
Leaves samples (self-shaded and sun-exposed) of these species were collected during winter and summer seasons. Extraction media were prepared from mixtures of five solvents according to a simplex centroid design. Plant extracts were analysed by injection into a high-performance liquid chromatography with diode array detection (HPLC-DAD) and evaluated after applying by multivariate curve resolution-alternating least-squares (MCR-ALS) and discriminant-unfolded partial least-squares (D-UPLS). The objective was to check whether the chemometric resolution of chromatographic profiles could help in the discrimination of samples according to taxonomic classification, sun exposition and/or harvest season. The results indicate that extraction media containing ethanol as main solvent achieved discrimination of self-shaded versus sun-exposed plants
and harvest season of Annona muricata. Also, D-UPLS analysis allowed taxonomic discrimination
between Annona muricata and Rollinia mucosa extract samples.
Keywords: Annona muricata, Rollinia mucosa, high-performance liquid
chromatography-diode array detection, multivariate curve resolution-alternating least-squares, discriminant-unfolded partial least-squares
Introduction
Herbal medicines have been used as medicines for hundreds of years all over the world. However, traditional medicine has not been officially recognized, mainly due to a lack of proper a research methodology for evaluating the plants and their preparations.1 Plants have received
special attention in the area of pharmacology due to the pharmacological properties of their active metabolites. Nonetheless, there are still numerous plant species that have not been identified and their medicinal properties remain unknown.2 The Annonaceae is a family of tropical and
subtropical trees comprising more than 2000 species. Many species in this family are used in traditional medicine,3
due to the presence of annonaceous acetogenins, a group of long-chain fatty acid derivatives presenting antitumor
properties, which are found exclusively in the plant family Annonaceae.4,5
Annona muricata and Rollinia mucosa are important
species belonging to genera of the Annonaceae family. These two plants are widely distributed in various regions of Brazil. Annona muricata is a small tree cultivated throughout
the tropical countries and is popularly known as “graviola”.2
Their leaves, roots, fruit and seeds have been used in natural medicine6 due to their antioxidant effect and for
the treatment of diabetes7 and cancer.8 Cyclohexapeptides,
acetogenins and annonaceous acetogenins were the major phytochemical compounds previously described in the literature for this medicinal plant.9 Rollinia mucosa is a
tropical tree indigenous to the West Indies and Central America. Leaves, stems and roots of these species, or closely related ones, have been used for the popular treatment of tumours in the West Indies and Indonesia.10 As in the case
from the leaves of Rollinia mucosa.11 Furthermore, in some
literature studies, aporphine alkaloids were described as isolated from this plant.12 The structural diversity of the
acetogenins and the selectivity of their biological activity against cancer cells have stimulated the search for new compounds of this class of bioactive substances.13 Its basic
structure has typically a tetrahydrofuran (THF) ring and a
γ-lactone terminal.14
As there is no standard method to differentiate plant extracts, it is necessary to develop fingerprinting methods either for taxonomic discrimination, authentication or classification of the different herbal medicines. The most widely used technique for this purpose is high-performance liquid chromatography (HPLC) coupled to different detection systems such as diode array (HPLC-DAD) or mass spectrometry (LC-MS).1,15
However, the complexity of analytical results obtained in HPLC studies of herbal medicines has been an obstacle.16
Therefore, combination of this instrumental technique with chemometric multivariate analysis can help in solving this problem, by revealing latent patterns in the data, which may enable sample discrimination.17-21 In
many of these latter works, the analysed sample dataset consisted in a vector of the relevant information (i.e., first-order data) that was arranged into a single data matrix to be processed with chemometrics tools.
Spectroscopic techniques such as nuclear magnetic resonance (NMR) and Fourier-transform infrared (FTIR) spectroscopies combined with multivariate analysis has been successfully used to solve problems such as plant species and cultivar discrimination, metabolite profiling and quality control of food or herbal medicines.22 In our
working group, we previously performed a FTIR analysis of plant extracts of Annona muricata and Rollinia mucosa
leaves (unpublished results). In the latter study, first-order FTIR data coupled to chemometric methods proved to be an appropriate technique to differentiate the extracts of
Annona muricata and Rollinia mucosa leaves. Principal
component analysis (PCA) of FTIR spectra discriminated samples of both species in different sunlight conditions (self-shaded and sun-exposed leaves), and also separated samples of Annona muricata and Rollinia mucosa
collected during winter and summer. The spectral regions responsible for the separation of these samples comprised were characteristic bands of acetogenins, confirming the importance of these substances in classifying samples of
Annona muricata and Rollinia mucosa.
In this work, we performed a study of plant extracts of Annona muricata and Rollinia mucosa from leaves
(self-shaded and sun-exposed) collected during winter and summer times. The extracts were injected into
an HPLC-DAD system, and the obtained dataset (second-order data, i.e., a matrix of elution times
versus UV-Vis spectral profiles for each sample) were
processed by two different chemometric algorithms: multivariate curve resolution with alternating least-squares (MCR-ALS)23 and unfolded partial least-squares (UPLS)24
employed in its discriminant mode D-UPLS.25 The
objectives were the chemometric resolution of acetogenins profiles in the modes represented by elution times and spectra profiles, and the use of the latter information in the discrimination of samples according to taxonomic classification, sun exposition or harvest time.
Experimental
Chemicals
HPLC grade acetonitrile and methanol were purchased from LiChrosolv (Merck). Mobile phase mixture preparations were made using water prepared with the Millipore Milli-Q purification system (Merck). Ethanol, ethyl acetate, dichloromethane, acetone and chloroform were purchased from F. Maia and were of analytical grade.
Plant materials
Leaves were collected during winter (July 2011) and summer (January 2012) in accordance with sunlight conditions (self-shaded and sun-exposed leaves) at an experimental garden of the State University of Londrina, in Londrina, PR, Brazil. Voucher specimens of Annona muricata self-shaded leaves (49.284), Annona muricata sun-exposed leaves (49.285), Rollinia mucosa sun-exposed leaves (49.286) and Rollinia mucosa
self-shaded leaves (49.287) have been stored in the herbarium of the Universidade Estadual de Londrina. Drying was carried out at about 25 ºC for nine days. Samples were then enclosed in brown paper bags within a humidity-controlled room to protect them from light, humidity, and insect and fungus attack.
Extract preparation
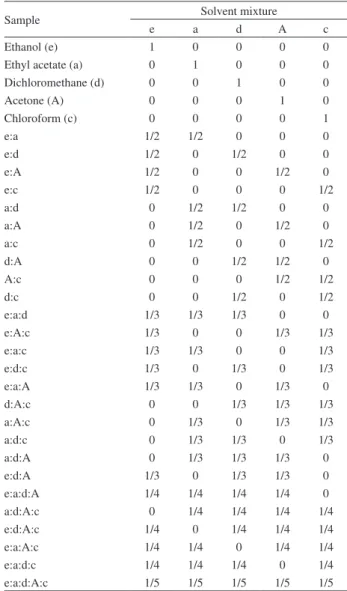
Extraction media were prepared using mixtures of five solvents: (e) ethanol, (a) ethyl acetate, (d) dichloromethane, (A) acetone, and (c) chloroform, whose proportions were varied according to a simplex centroid design.26 The
prepared by weighing 2 g of dried and crushed leaves, adding 15 mL of the solvent mixtures. These mixtures were placed in an ultrasonic bath (Unique, model Ultracleaner 1400) for 60 min with the bath water being changed every 30 min to avoid heating. The extracts were filtered through filter paper to separate the solution from small pieces of leaves, and the solution was placed in an identified and weighed flask. This procedure was repeated fourteen more times, so the total volume of solvent mixture added to the leaves was 225 mL. The remainder was evaporated in a rotary evaporator, removing all the solvents still present in the sample, until attaining constant weight.6
Sample preparation
Each sample was prepared by weighing 3.0 mg of the crude extract which were dissolved in 1.00 mL of methanol. Twenty microliters of each extract was added to 10.0 mL of the mobile phase (35% methanol, 35% acetonitrile, 30% water). Then, the samples were filtered through a 0.20 µm CHROMAFIL® XTRA PTFE-20/25 membrane filter and
analysed immediately.
HPLC-DAD analysis
Separation was performed on a reversed-phase column Kinetex C18 2.6 µm 100 Å column (Phenomenex) (100 mm × 4.6 mm). The elution time was 15 min, the flow rate 1.00 mL min–1 and the injection volume 20.0 µL.
HPLC analysis was conducted on a SPD-M10AV Finnigan Surveyour 61607 liquid chromatograph equipped with a Finnigan Surveyour PDA Plus diode array detector and four Thermo-Electron Corporation pumps (Thermo Fisher Scientific). Elution was isocratic and monitored between 190 and 800 nm. The data were processed using ChromQuest 4.2 software.
Chemometric models and software
MCR-ALS (multivariate curve resolution-alternating least-squares) and D-UPLS (discriminant-unfolded partial least-squares) were applied using the toolbox MVC2 (multivariate calibration 2) written for MATLAB (version 7.0, The Mathworks Inc.).27 Principal component analysis
was also applied using MATLAB built-in routines. To carry out the study in acceptable computational times, it was necessary to reduce the data obtained in the HPLC-DAD runs: each sample subjected to analysis generated an array of 200 × 106 data points (elution times from 0 to 5 min measured in steps of 6 s, and UV-Vis spectra from 190 to 400 nm taken in steps of 2 nm, respectively).
Results and Discussion
Multivariate curve resolution-alternating least-squares
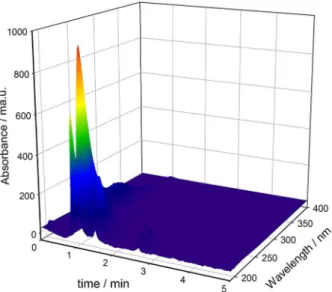
The raw analytical data obtained by HPLC-DAD measurements of the plant extracts are shown in Figure 1 in the form of a three-dimensional surface for ethanol extract of A. muricata collected in winter with self-shaded
sun condition. As can be seen, identification of a particular compound (e.g., acetogenin compounds) by visual inspection of this type of datasets would be time demanding and inefficient. Therefore, the selection of suitable data processing algorithms may allow the extraction of patterns for resolving component profiles in terms of their chromatograms and UV-Vis spectra. The latter information is known to help in identifying acetogenins, which have absorption spectral bands in the range 200-230 nm.3
Table 1. Proportions of solvent and their mixtures used in the extraction of according with simplex centroid design
Sample Solvent mixture
e a d A c
Ethanol (e) 1 0 0 0 0
Ethyl acetate (a) 0 1 0 0 0
Dichloromethane (d) 0 0 1 0 0
Acetone (A) 0 0 0 1 0
Chloroform (c) 0 0 0 0 1
e:a 1/2 1/2 0 0 0
e:d 1/2 0 1/2 0 0
e:A 1/2 0 0 1/2 0
e:c 1/2 0 0 0 1/2
a:d 0 1/2 1/2 0 0
a:A 0 1/2 0 1/2 0
a:c 0 1/2 0 0 1/2
d:A 0 0 1/2 1/2 0
A:c 0 0 0 1/2 1/2
d:c 0 0 1/2 0 1/2
e:a:d 1/3 1/3 1/3 0 0
e:A:c 1/3 0 0 1/3 1/3
e:a:c 1/3 1/3 0 0 1/3
e:d:c 1/3 0 1/3 0 1/3
e:a:A 1/3 1/3 0 1/3 0
d:A:c 0 0 1/3 1/3 1/3
a:A:c 0 1/3 0 1/3 1/3
a:d:c 0 1/3 1/3 0 1/3
a:d:A 0 1/3 1/3 1/3 0
e:d:A 1/3 0 1/3 1/3 0
e:a:d:A 1/4 1/4 1/4 1/4 0
a:d:A:c 0 1/4 1/4 1/4 1/4
e:d:A:c 1/4 0 1/4 1/4 1/4
e:a:A:c 1/4 1/4 0 1/4 1/4
e:a:d:c 1/4 1/4 1/4 0 1/4
Multivariate curve resolution refers to a group of methods which intend the recovery of pure response profiles (UV-Vis spectral profiles, elution profiles, etc.) of the chemical constituents of an unresolved mixture. To process second-order HPLC-DAD data for a group of several samples, extended MCR-ALS can be applied, which builds an augmented data matrix by placing all individual sample matrix adjacent to each other in either column-wise or row-column-wise augmentation modes. This allows one to model, via suitable constraints that give physical meaning to the obtained solutions; the varying profiles of each the components in the various samples. For a description of the model and further details, see Supplementary Information.
Several approaches were tried to process data obtained by the different extracting media designed by the simplex centroid design. We first studied the whole dataset, generated for each plant extract, applying MCR-ALS with the intention of simultaneously discriminating the extracted samples according to taxonomic classification (Annona muricata (A) or Rollinia mucosa (R)), harvest
time (winter (W) or summer (S)), and also sun condition (self-shaded (ss) or sun-exposed (se)). Therefore, eight classes were considered: 1 (AWss), 2 (ASss), 3 (AWse), 4 (ASse), 5 (RWss), 6 (RSss), 7 (RWse), and 8 (RSse). Unfortunately, PCA processing of the retrieves MCR-ALS scores of Rollinia mucosa extracts did not allow for a
suitable classification. It was then decided to divide the different extract in a media designed by the simplex centroid design into five categories, according to the presence of each solvent in each extract, namely, all extract samples having ethanol belonged to the same group and so on. This subset data categorization was chosen in order to
maintain the variability achieved with the mixture design, and also to exploit the metabolite extraction capability of each particular solvent which is always present in every extract. Subsequently, MCR-ALS was applied to the HPLC-DAD data measured for three different plant extracts of Annona muricata collected in summer time of
self-shaded leaves (ASss), Annona muricata collected in winter
time of sun-exposed leaves (AWse) and Annona muricata
collected in summer time of sun-exposed leaves (ASse). To organize the data matrices, each plant extract (ASss, AWse or ASse) was divided according to the solvent as described above, in such a way that 16 experimentally designed mixtures contained the same solvent. The data were then arranged by column-wise augmentation, i.e., data matrices were placed on top of each other sharing the spectral subspace for creating the so-called augmented data matrix to be submitted to MCR-ALS decomposition. Hence, each plant extract consisted of a matrix of 16 mixtures of solvents, and the augmented data matrix of 48 sample matrices (3 plant extracts × 16 mixtures of solvents) combining the matrices of three plant extracts. Subsequently, MCR-ALS analysis was applied to the augmented matrix (an array of 200 × 5088 data points, corresponding to 48 samples each with 106 data points each), as explained in section Chemometric models and software. The number of components was estimated by PCA of the augmented matrix, inspecting the plot of singular values as a function of increasing number of trial components.28 In this way, 10 components were
selected, which explained between 99.1% and 99.4% of the data variance according to the five solvent categories. In addition to the finally selected 10 components, we also applied MCR-ALS with other alternatives involving fewer components (e.g., 8 and 9). However, due to the fact that they led to unsatisfactory results regarding the main objective of classifying the plant extract samples, these results are not described. In order to achieve successful resolution, the following constraints were applied during the least-squares fit: non-negativity in both spectra and chromatograms, and unimodality (i.e., a single maximum) only to chromatograms, until successive changes in residual fit were smaller than 0.1%. In addition to the resolved spectral and chromatograms profiles, MCR-ALS resolution of the HPLC-DAD data renders the area under the resolved chromatographic profile for each component in a particular sample, i.e., the so-called MCR-ALS scores. This resolution was obtained with good quality parameters, namely, fitting error of 0.8% and 6.9% (with respect to PCA and experimental data, respectively) and 99.5% of explained variance.
Figure 2 shows the chromatograms of the 10 components resolved by MCR-ALS analysis of the experimental design of mixtures containing (a) ethanol, (c) acetone, and Figure 1. Three-dimensional surface for HPLC-DAD data (0-5 min and
190-400 nm) for ethanol extract of A. muricata collected in winter with
(d) chloroform as the major solvent. As can be seen, similar components were resolved when ethanol and acetone were present in the mixtures in largest proportion, whereas two different components (at 1.9 and 3.1 min, respectively) were resolved in the samples containing chloroform as the main extraction solvent. Although concentration profiles recovered by MCR-ALS resolution were quite similar (Figures 2a, 2c, and 2d) the recovered spectra from these compounds present subtle differences. Moreover, Figure 2b shows the resolved spectral profile for a particular sample (representative of the remaining ones). From Figure 2b, we can conclude that the 10 resolved chromatograms have absorption bands in the range 200-230 nm, characteristic of acetogenins, confirming that the components resolved by MCR-ALS belong to this family of compounds.
The fingerprint information obtained by the MCR-ALS resolution was arranged into a matrix of size 48 × 10 (48 samples and 10 constituent scores). This latter matrix was submitted to PCA for discrimination purposes, and in order to study the relationship among the MCR-ALS acetogenins fingerprint information with the different sunlight conditions and seasons of the Annona muricata samples.
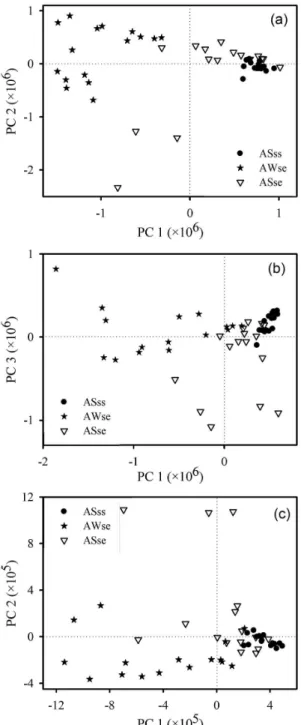
Figure 3a shows the score plot of first versus second
principal component (57.58% and 24.46% of variance retained by PC1 and PC2, respectively) of the samples
containing ethanol in the mixture extraction solvent. In this Figure, discrimination is observed between the
Annona muricata samples in self-shaded (ASss) and
sun-exposed (ASse) conditions collected during summer time. In addition, both classes were discriminated from the samples collected in winter (AWse). On the other hand, Figure 3b shows a plot of PC1 (44.66%) versus
PC3 (13.84%) of the samples containing acetone in the mixture extraction solvent, in which partial discrimination is detected between the summer samples ASss and ASse from the winter samples AWse. Finally, Figure 3c shows the score plot of PC1 (49.76%) versus PC2 (24.78%)
of the samples containing chloroform in the mixture extraction solvent; discrimination between ASss, ASse and AWse samples is less noticeable in this case. It should be emphasized that Annona muricata samples in self-shaded
conditions collected during summer (ASss) appear much more condensed (i.e., have relatively more similar PC scores) for ethanol (Figure 3a), acetone (Figure 3b) and chloroform (Figure 3c) than ASse and AWse samples.
The fingerprint information obtained by the MCR-ALS resolution (matrix of 48 samples × 10 constituent scores) was submitted to PCA for discrimination purposes. Contribution, i.e., loading composition, of each principal component from the ten constituents resolved by MCR-ALS reveals which
Figure 2. Elution time profiles for the ten constituents resolved by MCR-ALS for: (a) solvent mixtures containing ethanol; (c) solvent mixtures containing acetone; and (d) solvent mixtures containing chloroform. In (b), augmented spectral profiles (5 samples from the recovered spectral dimension of
compounds were decisive for extract discrimination by sunlight conditions and harvest time. Figure 4 shows the loadings composition in the principal components that were used for discrimination (PC1 and PC2 for ethanol extract and their mixtures, PC1 and PC3 for acetone extract and their mixtures, and PC1 and PC2 for chloroform extract and their mixtures). As can be observed, regardless of the sign (i.e., in absolute value), constituents No. 4 and 1 displayed the largest contributions to PC1 and PC2, respectively, for ethanol
extract and their mixtures; constituents No. 4 and 7 displayed the largest contributions to PC1 and PC3, respectively, for acetone extract and their mixtures; and constituents No. 9 and 1 displayed the largest contributions to PC1 and PC2, respectively, for chloroform extract and their mixtures.
Figure 5 shows the resolved spectra of these relevant constituents, where all constituents are seen to have spectra with absorption bands in the range 200-230 nm (ascribed to acetogenins). This means that different acetogenin compounds were responsible for extract discrimination by sunlight conditions and harvest time. In summary, MCR-ALS resolution of the HPLC-DAD data and subsequent processing with PCA allows discrimination of Annona muricata samples with the different sunlight
conditions and seasons, separated by solvents. Ethanol extracts and their mixtures (Figure 3a) showed the best separation for the Annona muricata samples. This latter
result should undoubtedly be tied to the better extractions yields obtained using ethanol mixtures (see above).
Unfortunately, as mentioned earlier, PCA processing of the MCR-ALS scores obtained for Rollinia mucosa
samples was not satisfactory, and no discrimination could be achieved in terms of sun exposition or harvest time conditions. This indicates that both species of the same family of plant, even when they are known to contain similar active substances, yield subtly different compounds upon solvent extraction, and this difference did not help to achieve plant extract classification. Therefore, for the sake of brevity, the specific results of MCR-ALS resolution of data for Rollinia mucosa samples are not shown.
Discriminant unfolded partial least-squares
Partial least-squares is a regression method that has proven to be a very versatile method for multivariate data analysis.29 Discriminant partial least-squares (D-PLS) is a
variant of PLS in which the predicted variables (contained in the so-called Y-block) are categorical values or codes,
allowing to separate samples in different classes (see Supplementary Information for more details). In the case of second-order data such as the presently studied HPLC-DAD data, PLS can be applied after unfolding the matrices, concatenating all elution time profiles into a single column vector. This gives rise to the UPLS model (unfolded PLS).
The classification model were designed with the intention of discriminating extract samples according to taxonomic classification (Annona muricata (A) or Rollinia mucosa (R)), harvest time (winter (W) or summer (S)),
and also sun condition (self-shaded (ss) or sun-exposed (se)). Therefore, eight classes were considered: 1 (AWss), 2 (ASss), 3 (AWse), 4 (ASse), 5 (RWss), 6 (RSss), Figure 3. Discrimination of Annona muricata (A) samples collected
7 (RWse), and 8 (RSse). Figure 6 shows, in the form of a box-and-whisker plot for each class, the results of D-UPLS analysis for the classes previously described. As can be seen, although good discrimination is not achieved neither in harvest time or sun condition variables, a perfect classification between Annona muricata and Rolliniamucosa extract plants (taxonomic classification)
was achieved with the application of this model.
Conclusions
In summary, the results indicate that extraction media containing ethanol, acetone or chloroform as main mixture extraction solvent, achieved discrimination of self-shaded versus sun exposed plants and harvest time
(ASss, ASse and AWse) of Annona muricata, and that the
extraction media containing ethanol are the best sample discriminators. Interestingly, higher plant extract yields of
Annona muricata leaves were obtained when employing
ethanol as solvent. This strongly suggests that the higher Figure 4. Loadings composition of the principal components, in terms of the ten MCR-ALS resolved components. Ethanol extract and their mixtures in (a); acetone extract and their mixtures in (b) and chloroform extract and their mixtures in (c).
Figure 5. UV-Vis spectra of the two relevant components resolved by MCR-ALS for each mixture extraction solvent. Ethanol extract and their mixtures (components No. 1 and 4) in (a); acetone extract and their mixtures (components No. 4 and 7) in (b) and chloroform extract and their mixtures (components No. 1 and 9) in (c).
Figure 6. Discrimination between Annona muricata (A) and Rollinia mucosa (R) samples collected during winter (W) and summer (S) in
yields of ethanol extracts are associated to the obtainment of more metabolites from the plant. They may be responsible for the classification success achieved when HPLC-DAD data of plant extracts containing ethanol as solvent were used for MCR-ALS analysis. Examination of the contribution of the constituents resolved by MCR-ALS in each principal component indicates that different acetogenin compounds were the responsible for extract discrimination by sunlight conditions and harvest time. Finally, D-UPLS analysis allows taxonomic discrimination between Annona muricata and Rollinia mucosa extract samples.
Supplementary Information
Supplementary Information containing the multivariate curve resolution-alternating least-squares (MCR-ALS) theory and discriminant unfolded partial least-squares (D-UPLS) theory is available free of charge at http://jbcs.sbq.org.br
Acknowledgments
This work was supported by the National Council for Scientific and Technological Development (CNPq) and Fundação Araucária, Brazilian granting agencies, Universidad Nacional de Rosario and Consejo Nacional de Investigaciones Científicas y Técnicas (CONICET). CNPq is acknowledged for providing a research fellowship to Prof Ieda S. Scaminio, a doctoral fellowship to Sabrina Afonso and a scientific initiation scholarship to Fabiano B. Silva. CONICET is acknowledged for a postdoctoral fellowship to Pablo L. Pisano.
References
1. Gad, H. A.; El-Ahmady, S. H.; Abou-Shoer, M. I.; Al-Azizi, M. M.; Phytochem. Anal. 2013, 24, 1.
2. Moghadamtousi, S. Z.; Karimian, H.; Rouhollahi, E.; Paydar, M.; Fadaeinasab, M.; Kadir, H. A.; J. Ethnopharmacol.
2014, 156, 277.
3. Rupprecht, J. K.; Hui, Y. H.; McLaughlin, J. L.; J. Nat. Prod.
1990, 53, 237.
4. Alali, F. Q.; Liu, X. X.; McLaughlin, J. L.; J. Nat. Prod. 1999,
62, 504.
5. Gu, Z. M.; Zhou, D.; Lewis, N. J.; Wu, J.; Johnson, H. A.; McLaughlin, J. L.; Gordon, J.; Phytochem. Anal. 1999, 10, 32.
6. Souza, E. B. R.; Silva, R. R.; Afonso, S.; Scarminio, I. S.; J. Sep. Sci. 2009, 32, 4176.
7. Florence, N. T.; Benoit, M. Z.; Jonas, K.; Alexandra, T.; Désiré, D. P.; Pierre, K.; Théophile, D.; J. Ethnopharmacol. 2014, 151,
784.
8. Astirin, O. P.; Artanti, A. N.; Fitria, M. S.; Perwitasari, E. A.; Prayitno, A.; J. Cancer Ther. 2013, 4, 1244.
9. Gajalakshmi, S.; Vijayalakshmi, S.; Rajeswari, V. D.; Int. J. Pharm. Pharm Sci. 2012, 4, 3.
10. Shi, G.; McDougal, J. M.; McLaughlin, J. L.; Phytochemistry
1997, 45, 719.
11. Chen, Y. Y.; Chang, F. R.; Yen, H. F.; Wu, Y. C.; Phytochemistry
1996, 42, 1081.
12. Kuo, R. Y.; Chang, F. R.; Chen, C. Y.; Teng, C. M.; Yen, H. F.; Wu, Y. C.; Phytochemistry 2001, 57, 421.
13. Gu, Z. M.; Zhou, D.; Lewis, N. J.; Wu, J.; Shi, G.; McLaughlin, J. L.; Bioorg. Med. Chem. 1997, 5, 1911.
14. Shi, G.; Kozlowski, J. F.; Schwedler, J. T.; Wood, K. V.; McDougal, J. M.; McLaughlin, J. L.; J. Org. Chem. 1996, 61,
7988.
15. Qin, X. M.; Dai, Y. T.; Zhang, L. Z.; Guo, X. Q.; Shao, H. X.;
Phytochem. Anal. 2009, 20, 307.
16. Garza-Juárez, A.; Salazar-Cavazos, M.; Salazar-Aranda, R.; Pérez-Meseguer, J.; Torres, N. W.; Planta Med. 2011, 77, 958. 17. Soares, P. K.; Scarminio, I. S.; Phytochem. Anal. 2008, 19, 78.
18. Cheng, X. M.; Zhao, T.; Yang, T.; Wang, C. H.; Annie-Bligh, S. W.; Wang, Z. T.; Phytochem. Anal. 2010, 21, 279.
19. Sun, S.; Chen, J.; Zhou, Q.; Lu, G.; Chan, K.; Planta Med.
2010, 76, 1987.
20. Wang, L.; Wang, X.; Kong, L.; Biochem. Syst. Ecol. 2012, 40, 138.
21. Seifi, H.; Masoum, S.; Seifi, S.; Ebrahimabadi, E. H.;
Phytochem. Anal. 2014, 25, 273.
22. Zhao, J.; Avula, B.; Joshi, V. C.; Techen, N.; Wang, Y. H.; Smillie, T. J.; Ikhlas, A.; Khan, I. A.; Planta Med. 2011, 77,
851.
23. Tauler, R.; Chemom. Intell. Lab. Syst. 1995, 30, 133.
24. Wold, S.; Geladi, P.; Esbensen, K.; Öhman, J.; J. Chemom.
1987, 1, 41.
25. Arancibia, J. A.; Boschetti, C. E.; Olivieri, A. C.; Escandar, G. M.; Anal. Chem. 2008, 80, 2789.
26. Barros Neto, B.; Scarminio, I. S.; Bruns, R. E.; Como Fazer Experimentos: Pesquisa e Desenvolvimento na Ciência e na
Indústria, 3a ed.; Editora da Unicamp: Campinas, 2007. 27. Olivieri, A. C.; Escandar, G. M.; Practical Three-Way
Calibration, 1st ed.; Elsevier: Amsterdam, 2014.
28. Jolliffe, I. T.; Principal Component Analysis, 2nd ed.; Springer: New York, 2002.
29. Escandar, G. M.; Faber, N. K. M.; Goicoechea, H. C.; Muñoz de la Peña, A.; Olivieri, A. C.; Poppi, R. J.; Trend. Anal. Chem.
2007, 26, 752.
Submitted: May 4, 2015