A
r
ti
c
le
0103 - 5053 $6.00+0.00
*e-mail: [email protected]
Influence of the B-band O-antigen Chain in the Structure and Electrostatics of the
Lipopolysaccharide Membrane of
Pseudomonas aeruginosa
Thereza A. Soares, T. P. Straatsma and Roberto D. Lins*
Computational Biology and Bioinformatics, Pacific Northwest National Laboratory, P.O. Box 999, MSIN K7-90, Richland, WA 99352, USA
Lipopolissacarídeos são os principais constituintes da membrana externa de bactérias Gram-negativas. Esta classe de compostos desempenha um papel fundamental em processos químicos mediados por estas bactérias como o reconhecimento e ligação de metais, adesão a superfícies e reações de óxido-redução. Lipopolissacarídeos são também os mais comuns agentes causadores de doenças nosocomiais que levam a infecções crônicas e agudas em pacientes de queimaduras, defi-ciência imunológica e fibrose cística. Variação fenotípica na expressão de bandas A e B em membranas lipopolissacarídicas de P. aeruginosa resultam em mudanças de propriedades químicas da superfície bacteriana que afetam a adesão bacteriana a superfícies celulares e favorecem a sobrevivência do organismo. Simulações de dinâmica molecular clássica em solvente explícito foram realizadas para a membrana lipopolissacarídica lisa (A-B+ LPS) de Pseudomonas aeruginosa por um período de 12 ns. A banda B exibe uma grande flexibilidade e permanece solvatada durante o período de simulação. Interações de longo alcance entre a banda B e as moléculas de carboidratos na superfície da membrana não foram observadas corroborando resultados postulados anteriormente através de experimentos de microscopia de forca atômica. Comparações com simulações da membrana lipopolissacarídica rugosa (A-B- LPS) de P. aeruginosa indicam que a presença da banda B induz uma expansão da membrana e modifica drasticamente tanto o potencial eletrostático através da membrana como a distribuição de cargas na superfície da mesma. Estes resultados oferecem uma explicação para o fato de que apenas as cepas de P. aeruginosa que contem a banda B são capazes de se aderirem a superfícies celulares, e para a necessidade de perda da banda B para que então estes organismos possam iniciar uma infecção aguda em adição à infecção crônica do paciente.
Lipopolysaccharides (LPSs) form the major constituent of the outer membrane of Gram-negative bacteria, and are believed to play a key role in processes that govern microbial metal binding, surface adhesion, and microbe-mediated oxidation/reduction reactions. It is also a major causative agent of nosocomial illness, eliciting both chronic and acute infections in burn, immunocompromised, and cystic fibrosis. Phenotypic variation in the relative expression of A- and B-band in the LPS of
Pseudomonas aeruginosa seems to alter its overall surface characteristics influencing adhesion and favoring survival. Classical molecular dynamics simulations of A-B+ LPS membrane model of
P. aeruginosa were carried out in explicit solvent for 12+ ns. The B-band presents a remarkable flexibility remaining fully solvated and does not interact with the sugar units from the LPS core surface residues, in agreement with atomic force microscopy experiments. Comparison with previous simulations of the rough LPS membrane suggests that the presence of the B-band promotes membrane expansion. In addition, this O-antigen chain dramatically alters the electrostatic potential and surface charge of the LPS membrane. This is illustrated by the resulting electrostatic surface potential. These results are compared to previous simulations of the rough LPS and a model hypothesis is proposed to explain the increased ability of B-band expressing microorganisms to adhere to cell surfaces and the necessity of these organisms to loose the O side chain for the development of acute infections.
Keywords: lipopolysaccharide membrane, B-band, molecular dynamics, electrostatic surface potential
Introduction
Prof. Ricardo Ferreira realized very early the importance of applying theoretical principles of physical-chemistry to
approach problems in biology.1 In this contribution honoring
P. aeruginosa is a ubiquitous environmental Gram-negative bacterium with high physiological versatility and an exceptional ability to adapt to a wide range of ecological environments, including soil, marches, coastal habitats, plant and animal.2 It is also a major causative
agent of nosocomial illness, eliciting both chronic and acute infections in burn, immunocompromised, and cystic fibrosis.2,3 Multiple organ failure caused by Gram-negative
bacterial sepsis syndrome is the main reason for the high morbidity and mortality from P. aeruginosa infections. As for other Gram-negative bacteria, the principal surface-associated virulence factor of P. aeruginosa is a class of molecules known as lipopolysaccharide (LPS).
LPS is the major component of the outer membrane of Gram-negative bacteria. It protects the bacterial pathogens from host defenses and mediates the entry of the bacteria into eukaryotic cells (for a review see4-6). In
addition, the outer membrane of Gram-negative bacteria acts as a barrier to the diffusion of many antibiotics which are effective against other forms of bacteria.5 Each LPS
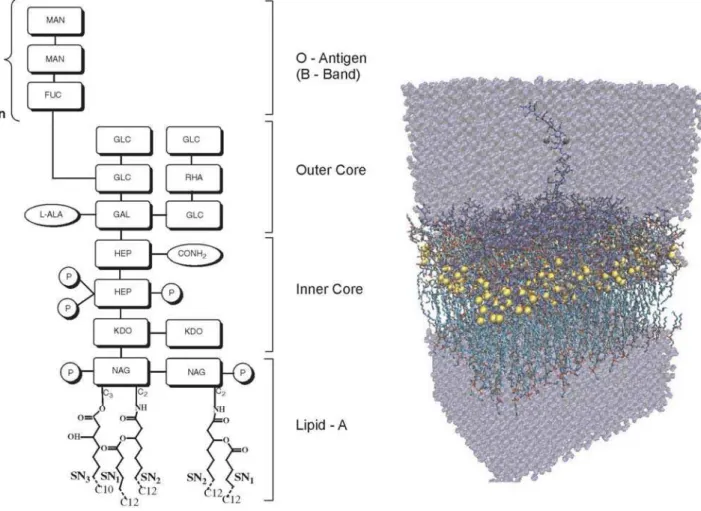
molecule is composed of a lipid moiety termed Lipid-A, which anchors the molecule to the outer leaflet of the outer membrane, and a covalently linked hydrophilic polysaccharide part (Figure 1).7,8 The polysaccharide part
consists of a core oligosaccharide of different lengths and a polysaccharide chain formed of repeating tetrasaccharide units named O-antigen. The oligosaccharide core provides a hydrophilic barrier to antibiotics while the Lipid-A form a hydrophobic barrier. Two types of O-antigen chains have been identified in wild-type stains of P. aeruginosa, namely A-band and B-band.9 Yet, over 80% of the LPS produced
byP. aeruginosa lack the covalently attached O-antigen chain. This chemotype is termed rough LPS whereas the chemotype associated to the presence of the O-antigen is called smooth LPS accordingly to the morphology of the respective bacterial colonies.
The interconversion between the smooth and rough LPS chemotypes occurs in response to changes in the mode of life of P. aeruginosa.2 The LPS O-antigen composition
rapidly changes when strains initially grown as biofilms
are transferred into conditions that promote planktonic or free-swimming culture.10 In acute infections P. aeruginosa
usually adopts a planktonic mode of life11,12 whereas in
chronic infections, colonies form biofilms.13 Although the
virulence of Gram-negative bacteria is associated to the smooth LPS chemotype, the strains of P. aeruginosa that cause chronic lung infections in cystic fibrosis patients exhibit the rough LPS chemotype.2 The loss of O-antigens,
key targets for the action of host antibody and complement, may allow these bacteria to evade the host defenses. Furthermore, strains of P. aeruginosa lacking the B-band have demonstrated much greater cytotoxicity in both acute and chronic infections14 as well as greater ability to
adhere to polystyrene surfaces, an important attribute for biofilm formation.10 On the other hand, cellswith the lowest
surface hydrophobicity and lowest surface charge, i.e. the smooth chemotype, adhere to glass the most efficiently, implying a role for electrostatic interaction. The B-band O-specific chains of smooth strains are expressed in only 6% to 8% of the LPS units. This chain is exposed to the environment and can vary extensively in length, from 4- to 60-mer.15,16 It has been postulated that phenotypic variation
in the relative expression of A- and B-band in LPS may be a mechanism by which P. aeruginosacan alter its overall surface characteristics to influence adhesion and favor survival.17
Modifications of the polysaccharide portion of the LPS have profound effect on the physicochemical properties of the outer membrane and thus on microbial physiology and susceptibility to diverse antibiotics. A complete understanding of the mechanisms by which the outer membrane shields Gram-negative bacteria from the host immune defenses and from antibiotics will require the characterization of the structure, aggregation and interactive properties of the LPS. The purpose of this study is to evaluate the influence of the B-band in the structural and electrostatic properties of the lipopolysaccharide membrane of P. aeruginosa. Towards this end, classical molecular dynamics simulations of the A-B+ LPS form were carried out and the results compared with previous simulations of the rough LPS membranes.18
Computational Methods
Molecular dynamics simulations
Starting from an equilibrated model of the rough LPS membrane of P. aeruginosa containing 16 LPS and 40 phosphatidylethanolamine (PE) units as a template, a smooth A-B+ membrane of 64 LPS and 160 PE units was assembled. The structural and electrostatic properties of
16-unit model have been extensively described and validated against experimental data.19,20 The B-band chain consisted
of a tretramer of [l4)-B-D-Manp2NAc3AmA-(1l
4)-B-D-Manp2NAc3AmA-(1l3)-A-D-FucpNAc-(1l]n as repeating unit (i.e., with n= 4) (Figure 1a). The O-specific chain was linked to one of the rough LPS unit in the center of the smooth LPS membrane. The system consisted of the LPS membrane, 420 Ca2+ ions and 20,674 SPC/E21 water
molecules with a total of 104,313 atoms (Figure 1b). The membrane size was chosen so that the extended B-band could lay flat down over half of the membrane surface without crossing the periodic box. The entire system was energy minimized using 500 steps of the steepest descent algorithm, followed by progressive heating with temperature increments of 50 K at every 20 ps interval up to 300 K. Data production was carried out during 12 ns of simulation at 300 K and 1.025 x 10⁵ Pa. The leapfrog
algorithm22 was used with a 2-fs time step interval. The
temperature was maintained constant by weak coupling to independent heat baths23 for solute and solvent with a
0.1 ps relaxation time. The pressure was kept via anisotropic coordinate scaling every 0.4 ps. A dual-range cutoff of 1.0 and 1.8 nm was used for electrostatic and van der Walls contributions. SHAKE24 constraints with a tolerance of
10-4 nm were applied to all atoms involving a hydrogen
atom. All simulations were performed using the NWChem program25 in conjunction with Amber96 force field and our
extensions19 of the Glycam93 force field.26
Analyses
The area per lipid or LPS headgroup is calculated simply by dividing the area defined by the x-y plane divided by the number of molecular units, i.e., ALPS= lx ly/NLPS, where l
x and ly are the lengths of the x- and y-axes. This quantity can be associated with a given physical state (gel, fluid) of the lipid system. The deuterium order parameter for the acyl chains is also used to characterize lipid membranes. It can be evaluated in a molecular dynamics trajectory from the long time average of the second order Legendre polynomial that expresses the reorientation correlation function of the C-D vector. Hence, the order parameter tensor may be defined asSij=1/2 <cos Qi cosQj1>, where Qi is the angle between theith molecular axis and the membrane normal over all the corresponding acyl chains in the system.27-29
The mean square displacement (MSD) for the B-band unit was calculated in order to gain insight into the relative diffusion coefficient of the O-antigen chain as a function of the distance of the membrane surface. Essential dynamics analysis30 was applied to the entire trajectory in order to
the timescale of the present simulation. This technique can be used to filter out local vibrational motions across the trajectory from the correlated ones. From the 12 ns trajectory, a covariance matrix was built for the B-band backbone atoms and diagonalized to identify the five most significant motions of the O-antigen along their eigenvectors. Results are presented for the two eigenvectors corresponding to the two eigenvalues of largest amplitude, which represented over 75% of the total motion of the O side chain.
The electrostatic potential varies throughout space, and so it can be visualized in the same way as the electron density. The mapping of the electrostatic potential onto (or near) the molecular surface has been widely used in biomolecular simulations since it is particularly useful in the understanding of molecular interactions.31-34 Formally,
the electrostatic potential has contributions from the n nuclei and the electrons represented by the electron density
R. It can be written as:
, where
and
The electrostatic potential at a point r in space, F(r), is defined as the work to bring a unit positive charge from infinity to this point. The electrostatic interaction energy
between a point charge q at point r located and the molecule is equal to qI(r). Here, the electrostatic potential across the LPS membrane was calculated from the partial atomic charges used in the simulations. Edge-related artifacts were avoided by using periodic boundary conditions along the x and y axes only. The grid was extended up to 1.0 nm beyond the solute atoms in the transmembrane axis (z-axis) and the water molecules removed for the electrostatic potential calculations. Ten grid points per nm and a 2.0 nm cutoff were used for the periodic space.
Results and Discussion
Structural dynamics
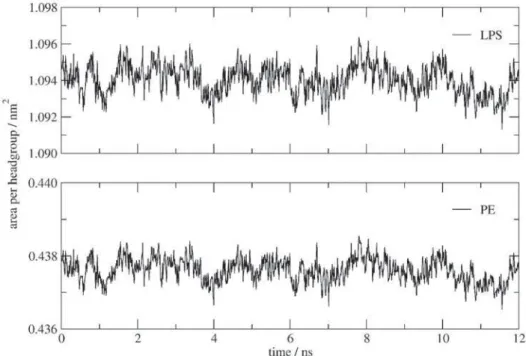
The average area per molecule was calculated from the cross-section of the simulation boxes divided by the 64 LPS or 160 lipid molecules and are presented as function of the time and for a temperature of 300 K (Figure 2). Throughout the simulation, the average areas per PE and LPS molecules were well maintained around values of 0.438 nm2 and 1.095 nm2, respectively. Experimental
values for dilauroylphosphatidyl-ethanolamine (DLPE) at 293.15 K and at 308.15 K are 0.41 nm2 and 0.51 nm2,35
respectively, whereas for dipalmitoylphospho-ethanolamine (DPPE) at 342.15 K, it is 0.55 nm2.36-38 For a penta-acyl
LPS molecule, the experimental area per LPS molecule is 1.08 nm2 at 293.15K (gel-crystalline phase) and 1.30 nm2
at 273.15 K (liquid-crystalline phase).39 Thus, within the
nanosecond timescale, the model is able to reproduce the lateral area of the LPS membrane observed experimentally under corresponding temperature conditions. Comparisons between MD simulations of the smooth LPS membrane and rough LPS membrane18,19 of P. aeruginosa show a
consistent increase of the area. The insertion of one B-band onto a rough LPS membrane led to an increase of 4% to 10% of the area per molecule of the smooth LPS membrane, with the difference variation depending on the long-range electrostatic treatment used in the rough LPS membrane simulations. The lower-boundary difference value is observed when Ewald summation methods were used to treat long-range electrostatic interactions in a rough LPS membrane of identical dimension to the present smooth LPS membrane simulation. Indeed, Ewald summation methods have been shown to produce a larger area per headgroup when compared to spherical cutoff methods.20
The upper-boundary difference value is observed when the present simulation is compared to a smaller rough LPS membrane simulation (containing 16 LPS), but otherwise with identical electrostatic treatment and simulation conditions. While these simulations have either a different long-range electrostatic treatment or membrane dimensions, such comparisons are useful to identify common trends and divergences in the structural dynamics of the two systems. These results suggest that the presence of the B-band chain induces a lateral expansion of the LPS membrane. This is not unexpected since the O-antigen chain is attached to a glucose residue spatially located within the outer core, instead of at its surface (Figure 1a).
LPS, like their phospholipidic counter-part, display polymorphism by forming diverse supramolecular aggregates that undergo thermal phase transitions.8
Conformation-dependent transition from an ordered, gel-like phase (all-trans packing of the acyl chains in Lipid-A) to a more fluid, disordered, liquid-crystalline phase (gauche conformers present) occurs at temperatures above 323.15 K.39 The enthalpy, temperature range and
its mid-point for the transition depend on several factors, including structural features of the LPS such as chemotype.8
The temperature for gel to liquid-crystalline transition is the highest for free lipid-A, lowest for deep rough mutants, and rise with increasing completion of the core oligosaccharide.8,40 The MD simulations of the smooth
and rough LPS membrane exhibit areas per LPS molecule characteristic of a gel-crystalline phase as expected under the temperature conditions simulated, i.e. 300K.
Carbon-deuterium order parameters S
CD were calculated for the three different acyl chains of the pentaacyl LPS, namely SN1, SN2 and SN3. Chains SN1 and SN2 are linked to the carbon C2 of the two NAcGlc units and each acyl
chain has 12 carbon atoms. Chain SN3 is linked to the C3 carbon of one NAcGlc unit and its acyl chain has 10 carbon atoms (Figure 1). Order parameters provide quantitative information about the degree of order along the lipid chain; high values (SCD > 0.5) correspond to acyl chains perfectly ordered in the membrane, whereas low values (SCD < 0.5) typically result from the averaging of many different conformations of the acyl chain under isotropic tumbling conditions. The average order parameters do not differ significantly among the distinct acyl chains of the smooth LPS membrane, with average values of 0.29, 0.26 and 0.25 for SN1, SN2 and SN3 chains, respectively. Conversely, these order parameters were lower than their equivalent in the rough LPS simulation (with average values of SN1: 0.34, SN2: 0.32 and SN3: 0.34) indicating that the B-band leads to an increase of fluidity of the smooth LPS membrane. This finding is consistent with the increase of the area per molecule, indicating a looser packing of LPS molecules in the smooth LPS membrane with respect to the rough LPS one.
Order parameters have been estimated for LPS and phospholipid membranes of the enterobacteria Salmonella minnesota and Escherichia coli by means of FTIR-spectroscopy. However, comparisons between these estimates and those obtained from deuterium (2H)
NMR spectroscopy for phospholipids membrane exhibit large discrepancies. For instance, the former technique yields a value of SCD = 0.70 ± 0.5 for LPS membranes and SCD = 0.80 ± 0.5 for phospholipids bilayers40 whereas
the latter yields values of SCD = 0.23 for phospholipids bilayers.38 Therefore, caution should be exercised when
validating theoretical results against the experimental data available for LPS membranes. We will not attempt to compare the order parameters from the simulation data with the different experimental measurements due to the above-mentioned limitation and the absence of data for the species P. aeruginosa. However, the predicted trends for lateral area and order parameters of the A-B- and A-B+ forms of the LPS of P. aeruginosa are expected to hold as valid.
Regarding the conformation of the serotype, freeze-substitution techniques have shown that the O-chains of B-band LPS can extend up to 40 nm from the outer membrane.41 It implies that these filaments do not interact
directly with the surface-exposed sugar units of the outer core. In addition, the freeze-substitution images suggest that the O-side chains are frequently extended in their conformation.41 On the other hand, atomic force
microscopy (AFM) experiments have been unable to verify this observation.42 Based on mesoscopic modeling, it has
for AFM detection. In the present study, these issues have been investigated by essential dynamics techniques (ED) and estimates of the relative mean square displacement (MSD) of the B-band with respect to the LPS membrane. While the total simulation time presented is rather short for a complete assessment of the full mobility of the B-band, the decomposition of persistent motions by the means of ED analysis indicates a preferential orientation for its motion (Figure 3). The largest amplitude motion modes of the B-band are described by the first two eigenvectors and represent over 75% of the total persistent motions of the B-band subset of atoms in 12 ns of simulation. Their corresponding motion modes are represented by vectorial arrows on the initial configuration of the O-antigen filament (Figure 3). These results show that the overall motion can be better described as a rotation. The B-band filament does not adopt any conformation where it would be in direct interaction with the membrane surface. The third largest displacement describes also a motion perpendicular to the normal axis, (i.e., along the x-y plane); however, the data is not shown for conciseness since it represents only ca. 12% of the total contribution for the B-band motion. The MD trajectory renders the O-antigen in an extended conformation and fully solvated throughout the simulation. Only a minor bend of the chain is detected though,
longer O-antigen chain lengths (n > 4) and/or timescale simulations may be required before this motion mode can be invalidated. This is because principal component analysis often require much longer simulations to attain convergence.44 For instance, this type of analysis performed
over a 100 ns trajectory of a protein immersed into a lipid bilayer has shown to be insufficient to properly characterize the protein’s sampling convergence.44 On the other hand,
it is worth noting that the dynamics of a protein immersed into a lipid membrane would be several times slower than the solvent-exposed B-band.
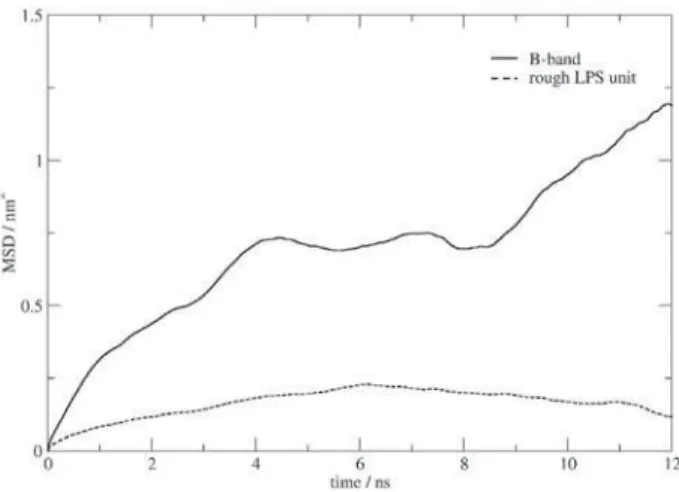
Calculations of the lateral mean square displacement along the membrane plane reveal values for the O-antigen filament that are up to one order of magnitude larger than those for single LPS units of the membrane for a 12 ns period (Figure 4). Given the increased flexibility of the fully solvated filament in contrast with the LPS units, this difference is likely to be even larger if the displacement of the O chain along the normal would also have been taken into account for the calculation of the MSD values. The diffusion coefficient of a discrete particle can be easily estimated from the mean square displacement, which is directly proportional to 2NDt (where N is the number of dimensions D the diffusion coefficient and t time). An estimate of D for the curves presented in Figure 4 leads to values of ca. 5x10⁻⁹ cm2s-1 and 2x10⁻⁷ cm2s-1 for the rough
LPS unit and the B-band chain, respectively. Despite of the absence of data on the lateral diffusion of LPSs, the obtained value compare extremely well with experimental lateral diffusion coefficients of cell receptors for Gram-negative LPS, which are in the order of 10-9 cm2s-1 whether free or
complexed with the rough LPS from Salmonella minesota Re595.45,46 The faster lateral diffusion for the B-band chain
by two orders of magnitude corroborates the hypothesis of a
Figure 3. Vectorial representation of the two largest displacement motions of the B-band from the essential dynamics analysis. Green arrows represent the motion of largest amplitude corresponding to ca. 50% of the total motion, while the orange arrow represents the component corresponding to ca. 25% of the total motion of the O side chain. The LPS membrane is represented by its molecular surface (gray: carbon; red: oxygen, blue: nitrogen; Ca2+ ions and hydrogen atoms are omitted
for clarity). A schematic semi-circular arrow around the B-band depicts the resulting motion of the O antigen.
considerably faster motion of the B-band chains compared to rough LPS units constituting the membrane.
Electrostatic properties
The presence of a particular O-side chain on the surface of P. aeruginosa is known to affect the overall charge and physicochemical properties of the bacterial cell. The bacterial LPS confers to these organisms the ability to bind/adsorb to different abiotic media (e.g., mineral surfaces, glass, polysterene). These interactions are ruled in most part by the electrostatic characteristics exhibited by chemical groups on the surface of the LPS membranes. Until very recently, this observation had been confined to studies involving abiotic media. Augustin and collaborators14 have proposed that the switch from
chronic (biofilm) to acute (planktonic form) infectivity in P. aeruginosa would involve phenotypic remodeling of the LPS O antigen, specifically the loss of the B-band.14 It
is known that strains possessing only A-band LPS present the highest surface hydrophobicity, while the presence of the B-band resulted in a more hydrophilic surface.17 In
addition, rough LPS cells have the most electronegative surface.17 Our previous simulation studies of the rough LPS
shows a negative surface charge on the outside and predicts transmembrane potentials of the order of 106 mV.19
Although transmembrane potential differences are very dependent on the long-range electrostatic treatment used,17
this value compares well with studies of LPS membranes of Paracoccus denitrificans, which have determined the transmembrane voltage of this LPS membrane to be at least100 mV. The electrostatic potential at the surface of the rough LPS membrane supports the fact that two rough-LPS-coated bacteria are unlikely to undergo into a biofilm state due to electrostatic repulsion.19 Likewise, to verify the
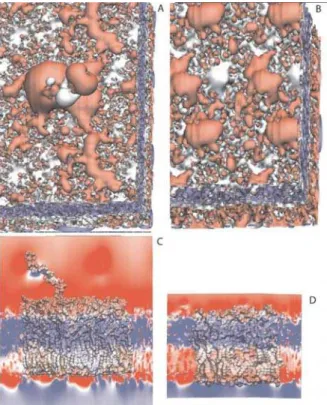
influence of the B-band on the electrostatic properties at the surface of the LPS membrane, the electrostatic potential was calculated for the entire trajectory and averaged over a 100-ps interval. No major changes in the overall electrostatic surface potential were observed throughout the 12 ns trajectory. The electrostatic potential of the A-B+ LPS membrane structure is compared to the rough LPS (Figure 5). The presence of the B-band disrupts the uniformity of the more hydrophobic surface of the rough LPS membrane, polarizing it around the O antigen and lowering the overall surface charge elsewhere (Figure 5A and B). Nevertheless, the surface of the A-B+ LPS membrane maintains its hydrophilic character. These changes in the potential of the smooth LPS membrane of the B-band could then facilitate disruption between B-band expressing cells by electrostatic repulsion.
Figure 5. Electrostatic potential of the A-B+ and rough LPS membranes: A) Top view of the electrostatic potential isocontourns for the smooth (A) and rough (B) LPS in the range of 200 to 200 mV; (B) and (D) display the electrostatic potential mapped onto the molecular surfaces and x-y planes of the smooth and rough LPS membranes, respectively. Red corresponds to a negative potential, blue to a positive potential and white to neutral areas of the LPS membranes. The structure of the rough LPS membrane has been obtained from a previous simulation from ref. 19.
Conclusions
significantly modulate the LPS membrane electrostatics, which is probably the major factor behind LPS remodeling towards cell adhesion and biofilm modulation.
Acknowledgments
To Ricardo, the professor, mentor, and friend, whose lessons and lifetime example have not only taught us science and how to approach it, but also values dear to a scientist such as integrity, rigor and perseverance.
This research was supported by the NIH, National Institute for Allergy and Infectious Diseases, and the Geosciences program of the DOE Office of Basic Energy Sciences through the project “Molecular Basis for Microbial Attachment and Geochemical Surface Reactions”. Development of the large-scale trajectory analysis required for this project was supported by the Data Intensive Computing for Complex Biological Systems project funded by the Department of Energy Office of Advanced Scientific Computing Research. The authors acknowledge the use of computational resources provided by the William R. Wiley Environmental Molecular Sciences Laboratory. Pacific Northwest National Laboratory is operated for the Department of Energy by Battelle. The authors also thank one of the reviewers for the estimate of the lateral diffusion data from the calculated MSD curves and its correlation with the available experimental data.
References
1. Ferreira, R. C.; J. Theor. Biol. 1973,39, 665.
2. Goldenberg, J. B.; Pier, G. B.; Trends Microbiol. 1996,4,
490.
3. Lyczak, J. B.; Cannon, C. L.; Pier, G. B.; Microbes Infect. 2000,
2, 1051.
4. Brandenburg, K.; Wiese, A.; Curr. Top. Med. Chem. 2004,4,
1127.
5. Nikaido, H.; Microbiol. Mol. Biol. Rev. 2003,67, 593.
6. Raetz, C. R. H.; Whitfield, C.; Ann. Rev. Biochem. 2002,71,
635.
7. Knirel, Y. A.; Bystrova, O. V.; Kocharova, N. A.; Zaehringer,
U.; Pier, G. B.; J. Endotoxin Res. 2006,12, 324.
8. Wilkinson, S. G.; Prog. Lipid Res. 1996,35, 283.
9. Burrows, L. L.; Lam, J. S.; J. Bacteriol. 1999,181, 973.
10. Beveridge, T. J.; Makin, S. A.; Kadurugamuwa, J. L.; Li, Z.;
FEMS Microbiol. Rev. 1997,20, 291.
11. Cryz, S. J.; Pitt, T. L.; Furer, E.; Germanier, R.; Infect. Immun.
1986,44, 508.
12. Joiner, K. A.; Grossman, N.; Schmetz, M.; Leive, L.; J. Immunol.
1986,136, 710.
13. Hancock, R. E. W.; Mutharia, L. M.; Chan, L.; Darveau, R. P.;
Speert, D. P.; Pier, G. B.; Infect. Immun. 1983,42, 170.
14. Augustin, D. K.; Song, Y.; Baek, M. S.; Sawa, Y.; Singh, G.; Taylor, B.; Rubio-Mills, A.; Flanagan, J. L.; Wiener-Kronish,
J. P.; Lynch, S. V.; J. Bacteriol. 2007,189, 2203.
15. Lam, J. S.; Graham, L. L.; Lightfoot, J.; Dasgupta, T.; Beveridge,
T. J.; J. Bacteriol. 1992,174, 7159.
16. Sadovskaya, I.; Brisson, J. R.; Thibault, P.; Richards, J. C.; Lam,
J. S.; Altman, E.; Eur. J. Biochem. 2000,267, 1640.
17. Makin, S. A.; Beveridge, T. J.; Microbiology 1996,142, 299.
18. Soares, T. A.; Straatsma, T. P.; Mol. Simul. 2007, DOI:
10.1080/08927020701829880, in press.
19. Lins, R. D.; Straatsma, T. P.; Biophys. J. 2001,81, 1037.
20. Shroll, R. M.; Straatsma, T. P.; Biopolymers 2002, 65,
395.
21. Berendsen, H. J. C.; Grigera, J. R.; Straatsma, T. P.; J. Phys.
Chem. B 1987,91, 6269.
22. Hockney, R. W.; The potential calculation and some applications. InMethods in Computational Physics, Alder, B.; Fernbach, S.; Rotenberg, M., eds. Academic Press: New York/London, 1970; vol. 9.
23. Berendsen, H. J. C.; Postma, J. P. M.; van Gunsteren, W. F.;
DiNola, A.; Haak, J. R.; J. Chem. Phys. 1984,81, 3684.
24. Ryckaert, J. P.; Ciccotti, G.; Berendsen, H. J. C.; J. Comput.
Phys.1977,23, 327.
25. Straatsma, T. P.; Philippopoulos, M.; McCammon, J. A.;
Comput. Phys. Commun. 2000,128, 377.
26. Woods, R. J.; Dwek, R. A.; Edge, C. J.; Fraserreid, B.; J. Phys.
Chem.1995,99, 3832.
27. Chandrasekhar, I.; Kastenholz, M.; Lins, R. D.; Oostenbrink,
C.; Schuler, L. D.; Tieleman, D. P.; van Gunsteren, W. F.; Eur.
Biophys. J. 2003,32, 67.
28. Douliez, J. -P.; Ferrarini, A.; Dufourc, E. -J.; J. Phys. Chem.
1988,109, 2513.
29. Egberts, E.; Berendsen, H. J. C.; J. Phys. Chem. 1988,89, 3718.
30. Amadei, A.; Linssen, A. B. M.; Berendsen, H. J. C.; Proteins
1993,17.
31. Honig, B.; Nicholls, A.; Science1995,268, 1144.
32. Hunenberger, P. H.; Borjesson, U.; Lins, R. D.; Chimia2001,
55, 861.
33. Lins, R. D.; Adesokan, A.; Soares, T. A.; Briggs, J. M.;
Pharmacol. Ther. 2000,85, 123.
34. Lins, R. D.; Straatsma, T. P.; Briggs, J. M.; Biopolymers 2000,
53, 308.
35. Nagle, J. F.; Tristram-Nagle, S.; Biochim. Biophys. Acta 2000,
1469, 159.
36. Nagle, J. F.; Biophys. J. 1993,64, 1476.
37. Petrache, H. I.; Dodd, S. W.; Brown, M. F.; Biophys. J. 2000,
79, 3172.
38. Thurmond, R. L.; Dodd, S. W.; Brown, M. F.; Biophys. J. 1991,
39. Snyder, S.; Kim, D.; McIntosh, T. J.; Biochemistry 1999,38, 10758.
40. Brandenburg, K.; Seydel, U.; Eur. J. Biochem. 1990, 191,
229.
41. Beveridge, T. J.; Graham, L. L.; Microbiol. Rev. 1991,55,
684.
42. Yao, X.; Jericho, M.; Pink, D.; Beveridge, T. J.; Science1989,
246, 645.
43. Beveridge, T. J.; J. Bacteriol. 1999,181, 4725.
44. Grossfield, A.; Feller, S. C.; Pitman, M. C.; Proteins 2007,67,
31.
45. Triantafilou, K.; Triantafilou, M.; Ladha, S.; Mackie, A.;
Dedrick, R. L.; Fernandez, N.; Cherry, R.; J. Cell Sci. 2001,
114, 2535.
46. Triantafilou, M.; Morath, S.; Mackie, A.; Hartung, T.;
Triantafilou, K.; J. Cell Sci. 2004,117, 4007.
Received: September 10, 2007