Article
Printed in Brazil - ©2017 Sociedade Brasileira de Química0103 - 5053 $6.00+0.00*e-mail: [email protected], [email protected]
NIR Monitoring and Modelling of Soybean Oil Methanolysis with Multivariate
Curve Resolution-Alternating Least Squares with Correlation Constraint
Rafaella F. Sales,a Suzana M. de Lima,b Luiz Stragevitch,a Maria Fernanda Pimentel*,a
and Anna de Juanc
aDepartamento de Engenharia Química, Universidade Federal de Pernambuco,
Avenida Prof. Arthur de Sá s/n, Cidade Universitária, 50740-521 Recife-PE, Brazil
bInstituto Federal de Pernambuco, Av. Prof. Luís Freire, 500, Cidade Universitária,
50740-540 Recife-PE, Brazil
cDepartment of Analytical Chemistry, Universitat de Barcelona, Diagonal 645,
08028 Barcelona, Spain
Near infrared spectroscopy in-line monitoring and modelling of soybean oil methanolysis has been done using multivariate curve resolution alternating least squares (MCR-ALS) with correlation constraint. This constraint allows for quantitation of the methyl ester formed with little calibration effort and the MCR model provides additionally a general description (qualitative and quantitative) of the rest of components in the process. Due to the complexity of this process, which shows components with severe kinetic and spectral overlap, suitably designed multiset analysis strategies were adopted to improve the recovery of concentration profiles of the methyl ester. To assess the temperature and catalyst concentration effects on the kinetic reaction, five batches with different temperatures (20, 44 and 55 °C) and catalyst concentrations (0.75 and 1 m/m%) were produced. The concentration profiles of methyl ester obtained by MCR-ALS for each batch was the starting information used to develop a simplified kinetic model and calculate the activation energy.
Keywords: multivariate curve resolution, correlation constraint, near infrared, biodiesel, processes monitoring
Introduction
Owing to the wide fuel-based energy consumption and environmental advantages, the biodiesel industry has expanded worldwide. Biofuel consists of a mixture of fatty acid alkyl esters, derived primarily from renewable vegetable oils, waste oils, animal fats and algae oils. Transesterification is the process most used for biodiesel production. This process, also known as alcoholysis reaction, involves a chemical reaction between triacylglycerols and a short-chained alcohol, such as methanol or ethanol.1
In general, biodiesel is produced by transesterification of triacylglycerols and methanol (methanolysis reaction) using alkaline compounds as catalysts. These compounds are essential for rapid achievement of the maximum conversion. The methanolysis process is commonly reported as three stepwise reversible reactions: in
the first step, triacylglycerols react with methanol to produce diacylglycerols and a methyl ester; in the second, diacylglycerols react with methanol to form a monoacylglycerol and a methyl ester; and finally, more methyl ester and glycerol are produced by the reaction between monoacylglycerols and methanol. Due to the reversibility of reactions, the methanol is always added in excess relative to the amount of oil in order to increase the reaction yield.2 These three consecutive and reversible steps
for alkali-catalyzed methanolysis are the normal process for a wide range of vegetable oils (rapeseed, sunflower, soybean and palm oils). These reactions take place at temperatures between 20 and 70 °C and a molar ratio of methanol to oil up to 6:1.3
development of a kinetic model of the reaction, which is essential for the design of optimal reaction conditions. Till present, there is no consensus about the kinetic behavior of the methanolysis reaction.2-6 Thus, there are diverse studies
on the kinetics of methanolysis for biodiesel production using different types of vegetable oils and catalysts (homogeneous and heterogeneous), based on different methods for analytical monitoring of the reaction, that report different results.
The reactions involved in the methanolysis process have been sometimes studied using complex kinetic models based on the three reversible stepwise reactions.7,8 In other
reports, the three stepwise reversible reaction mechanism was not expressed as such and the kinetic models described simplified reactions. Tubino et al.2 considered only the first
step (diacylglycerols formation) in the kinetic investigation. Other works considered the global reaction and developed a kinetic model based on triacylglycerols concentration.3,5,9
Jain and Sharma10 carried out analysis of the methanolysis
process of pre-esterified Jatropha curcas oil catalyzed by
NaOH and developed a first order kinetic model based on the percentage of methyl ester yield, based on the global reaction and ignoring the intermediates.
Most of the kinetic investigations about the methanolysis process are based on chromatographic measurements. Nevertheless, these methods are not considered the most appropriate for the kinetic study of this reaction, especially because of its fast conversion. In general, due to their analysis time limitations, these methods are not applicable for consecutive measurements within a reduced time interval. Therefore, physical properties, such as viscosity and refractive index, were applied as alternative options for the adequate monitoring of the methanolysis process.2,6
Another analytical technique successfully applied to monitor the transesterification for biodiesel production is near infrared spectroscopy (NIRS).11-14 This is a rapid
and non-destructive technique, which requires no sample pretreatment and can be applied for in-line, at-line, on-line and off-line process monitoring.15
Regarding the application of NIRS to real time on- and in-line determination of the main components in the reaction mixture during biodiesel production, only few works were found. Such studies are based on the use of multivariate calibration by partial least-squares (PLS).12,14,16,17 Lima et al.12 is the only among
the aforementioned studies that applied NIRS for in-line monitoring of transesterification reaction. PLS and multiple linear regression (MLR) calibration models were developed to estimate the contents of methyl ester, monoacylglycerols, diacylglycerols and triacylglycerols during soybean oil methanolysis. For PLS and MLR model development, 50 samples were collected under different experimental
conditions and analyzed by gas chromatography to obtain the reference values.
The other aforementioned studies described the on-line monitoring of transesterification reaction using NIRS.14,16,17
Killner et al.17 developed PLS calibration models to monitor
on-line the progress of the soybean oil methanolysis and estimate the conversion of glycerides. To develop the PLS model, 45 samples from three batches were analyzed by NIR and 1H NMR to develop the PLS model. In 2011,
Richard et al.16 described the application of NIRS for
on-line monitoring of the ethanolysis of high oleic sunflower oil conducted in batch reactor. Two PLS regression models for reactions at different ranges of temperature were developed to estimate the ethyl ester and monoacylglycerols contents during the reaction. 34 and 21 reference calibration samples were employed for models developed at reaction temperatures from 30 to 80 °C, and 70 °C, respectively. In 2013, Richard et al.14 also described the use of NIRS for
on-line monitoring of ethanolysis of high oleic sunflower oil but carried out in microreactors. Two PLS calibration models were developed to estimate the ethyl oleate content in reaction mixtures conducted under different conditions. To develop both the models, 44 and 40 calibration samples were employed.
Another way to analyze and model processes is by using soft-modelling multivariate curve resolution (MCR) methods. MCR methods are essentially calibration-free methods that provide the evolution of concentration profiles and pure spectra of the compounds participating in a process from the spectra collected and without assuming any kind of mechanistic model. Among the known algorithms, multivariate curve resolution alternating least squares (MCR-ALS) is mostly used because of its adaptability to different scenarios.18-22 MCR-ALS
decomposes the spectroscopic data matrix acquired during process monitoring into a bilinear model given by matrices related to the concentration and spectra profiles of the spectroscopically-active chemical components evolving in the process.23 This technique has been successfully
applied to near infrared data acquired from the monitoring of esterification of myristic acid with isopropanol. The researchers also estimated the rate constants in order to assess the effect of experimental variables on the reaction rate.24 In addition, Cruz et al.25 applied MCR-ALS to
estimate the kinetic parameters of complex catalytic reactions from on-line NIRS data. As far as the authors are concerned, works reporting the application of multivariate curve resolution (MCR) algorithms to study the biodiesel process production have not been found.
arbitrary units. To overcome this problem, the correlation constraint was introduced. This constraint makes possible to obtain concentration profiles in real concentration units by performing regression models between MCR-ALS concentration values and reference concentration values. Therefore, a real quantitative process monitoring is possible by applying the correlation constraint.26-28 In general,
an advantage of MCR with correlation constraint over PLS-based approaches is related to the lower number of reference values needed to develop the regression models. This is due to the fact that, since the information of each component is in separate profiles, pseudo univariate calibration models are built that require less calibration samples than a classical multivariate calibration model. Besides, not only the analyte of interest is predicted, but an overall description of all other compounds in the process, subject or not to a regression step, is obtained.
Studies on the use of NIRS technique for kinetic modelling of the methanolysis process were not found. In fact, with respect to the use of MCR-ALS for biodiesel analysis, only a few research studies have been reported. Thus, this technique was used for sulfate and acidity determination in biodiesel blends,29,30 for quantitative
analysis of blends of biodiesel with mineral diesel,31 and for
determination of biodiesel concentrations and antioxidant content in biodiesel mixtures.28 In addition, besides the
research reported in the aforementioned articles, only Oliveira et al.28 have employed the new correlation constraint
to the application of MCR-ALS to biodiesel analysis. In the present work, an assessment of the application of MCR-ALS with correlation constraint has been carried out using data from NIR in-line monitoring of soybean oil methanolysis. Due to the complexity of the system, several strategies linked to multiset analysis (i.e., simultaneous analysis of batches produced in different conditions) were adopted for the improvement of the recovery of methyl ester concentration profiles. The concentration values in these profiles were then used to develop a simple kinetic model for the chemically controlled regime of the reaction based on methyl ester concentration. To assess the effect of temperature and concentration of the catalyst (sodium hydroxide) on the kinetic reaction, five batches with different temperatures (20, 44 and 55 °C) and catalyst concentrations (0.75 and 1 m/m% based on oil weight) were monitored and analyzed.
Experimental
Methanolysis experiments
The methanolysis process of commercial soybean oil
(Liza) with methanol (Merck, purity of 99.9%) using sodium hydroxide (Merck, purity of 99%) as catalyst, was carried out in a 500 mL batch reactor. The system was formed by a thermocouple, a mechanical stirrer and a thermostatized water bath to control the temperature of the reactor. For all experiments, the impeller speed was set at a constant value throughout the experiment (500 rpm). The in-line monitoring of reaction was performed by immersing a near infrared fiber-optic transflectance probe in the reaction mixture. To assess the temperature and the amount of catalyst effects on the reaction kinetic, five batches with different temperatures (20, 45 and 55 °C) and catalyst concentrations (0.75 and 1 m/m% in relation to initial amount of oil) were produced and monitored. The aforementioned three temperature values were set based on Killner et al.17 and Lima et al.12 Although
the condition at 20 °C is not usually of industrial interest, a lower temperature is of great theoretical importance to track some phenomena that cannot be properly modelled at higher temperatures. In addition, another batch with different composition of reactants and a different catalyst concentration was produced. The batches and their descriptions are shown in Table 1.
For each experiment, the batch reactor was charged with 400 g of soybean oil. The mechanical stirrer was turned on at the desired speed and the reactor was heated to the defined temperature (20, 45 or 55 °C) under atmospheric pressure. Sodium hydroxide was dissolved in methanol and the solution was quickly added to the reactor when the temperature of the oil had reached the desired value. Spectroscopic measurements were started immediately after the sodium methoxide solution was being added to the reactor.
NIRS data acquisition
Near infrared spectra of the reaction mixture were measured using a fiber-optic transflectance probe (Solvias) connected to the FTLA 2000-160 FTIR spectrometer (ABB Bomem) with a resolution of 16 cm-1 and an
average of 64 scans, recorded every 20 s. The optical path
Table 1. Experimental data for the six batches produced Batch
name
Methanol to oil molar ratio
Temperature / °C
Catalyst / m/m%
Monitoring time / min
M1 6:1 20 0.75 90
M2 6:1 20 1.0 90
M3 6:1 45 0.75 60
M4 6:1 55 0.75 45
M5 6:1 55 1.0 45
length was adjusted to 5 mm and the spectral range was 14000-3800 cm-1. Background spectra were acquired with
the probe immersed in the empty reactor. The first spectra of each batch were removed because of the complicated biphasic nature of the methanolysis system, especially at the beginning of the process, as well as for temperature stabilization.4
Data pretreatment and software
Prior to MCR-ALS analysis, the spectroscopic data were subject to multiplicative scatter correction (MSC) to subtract the baseline and keep positive spectra. This technique corrects each original spectrum (xorg,i) in relation
to a reference spectrum (xref), which is in general the mean
spectrum. In the application of MSC, coefficients b0,i and
bref,i are calculated by equation 1:32
(1)
where e is the residual part. Afterwards, the correction
coefficients are used to calculate the corrected spectrum (xcorr,i), from the equation 2:32
(2)
The preprocessing and data set configuration were performed with Matlab® R2010a 1997.10.0.499
(Mathworks). MCR-ALS analysis was also performed on Matlab® using an updated version of the graphical interface
for MCR-ALS that can be freely downloaded from the MCR webpage.33,34
MCR-ALS analysis
Multivariate curve resolution decomposes a two-dimensional matrix (D) into a bilinear model. In the case
of spectroscopic data and adopting the assumption that Lambert Beer’s law is valid, matrices resulting from the MCR-ALS analysis can be interpreted as concentration (C) and spectra (ST) profiles of the spectroscopically-active
compounds present in the reaction mixture. In matrix form, the expression that represents the decomposition of a data matrix D by MCR can be written as equation 3,
D = CST+ E (3)
where E is the residual matrix.23 In the present work, the
spectroscopic data (D) are near infrared spectra obtained
during methanolysis monitoring.
The main steps to perform MCR-ALS are the determination of the number of components, the generation of initial estimates and the ALS optimization under constraints until the achievement of a convergence criterion. The number of components can be determined by singular value decomposition (SVD) of matrix D or by other
methods. Initial estimates of concentration profiles can be obtained using methods such as evolving factor analysis, or initial spectra profiles can be provided using methods of pure variable selection. In the ALS optimization step, different constraints can be applied to force the spectra and concentration profiles to follow chemical or mathematical properties. The optimization is iteratively performed until a convergence criterion is satisfied.18,19
Moreover, MCR-ALS multiset analysis allows treating experiments that share information in common. Multiset analysis on a column-wise augmented matrix is performed when several experiments are monitored by the same instrumental technique, but run under different experimental conditions. In this case, the pure spectra are common to all experiments. In contrast, the multiset analysis on row-wise augmented matrices is applied when an experiment is monitored by more than one instrumental technique.33
Figure 1a shows a representation of the decomposition of a spectroscopic data by MCR-ALS (e.g., a single batch of methanolysis process). Figure 1b shows a schematic representation of the multiset analysis for the simultaneous analysis of several experiments (batches) monitored with the same technique.
Due to the complexity of the system described in this work, pure spectra of the four compounds (triacylglycerols,
Figure 1. (a) Representation of the decomposition of a spectroscopic data
methanol, methyl ester and glycerol) were provided as initial estimates. These pure spectra were acquired at different temperatures, similarly to the reaction monitoring previously described, but using a different optical pathlength (1 mm) for triacylglycerol, methanol and methyl ester. Monoacylglycerols and diacylglycerols were not taken into account because their spectroscopic profiles are strongly correlated to the spectroscopic profiles of triacylglycerols (soybean oil) and methyl ester (biodiesel).
The non-negativity constraint was applied to the concentration and spectra profiles. In addition, another less common constraint was applied, the correlation constraint, which provides quantitative information from MCR-ALS analysis since the final concentration profiles obtained are in real concentration units.
The correlation constraint proceeds developing pseudo univariate calibration models between the relative concentration values calculated by MCR-ALS, in arbitrary units, and the reference concentration values acquired along the reaction. In each iteration, a regression model is built (expressed by equation 4) between the relative concentration values ( ) of calibration samples calculated by MCR-ALS and the reference values ( ) previously provided.
(4)
The parameters of the model (b and b1) are then used to
predict the concentration values of the other samples ( ) using the relative concentration values of these samples ( ), as expressed by equation 5. Therefore, it is possible to obtain the full concentration profile of the constrained compound in real concentration units.28
(5)
To assess the quality of the MCR model fit, parameters such as lack of fit (equation 6) and the explained data variance (equation 7) are used.
(6)
(7)
where dij is an element of the experimental data matrix and
eij is the related residual value obtained from the difference
between the experimental data and the data obtained by MCR-ALS.33
To assess the quality of the univariate calibration models associated with the use of correlation constraint, parameters such as the correlation coefficient (R) and the root mean square error of calibration (RMSEC) are used. According to Jaumot et al.,27 the RMSEC value is calculated by the
equation 8.
(8)
where m is the number of samples used to build the univariate model, yi,cal are the known concentration values
of the compounds and ŷi,cal are the predicted concentration
values of the compounds.27
Results and Discussion
Spectroscopic data
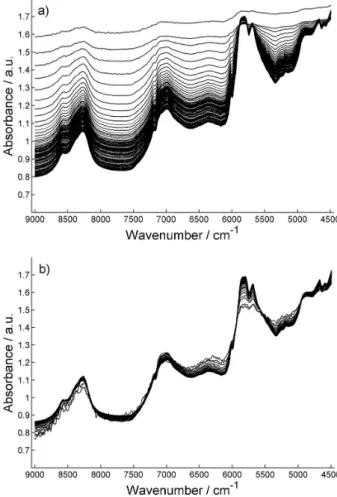
Figures 2a and 2b show the near infrared spectra for the reaction mixture at 45 °C (batch M3) before and after the application of multiplicative scatter correction, respectively. Spectral regions below 9003 and above 4482 cm-1 presented
saturation and absence of significant information and, therefore, were excluded from further analysis. As it can be seen, the raw spectra exhibit a significant baseline shift. This is probably associated with the changes in the physical properties of the reaction mixture that occur along the progress of the methanolysis.12
MSC was applied to the raw spectra because this preprocessing provided a satisfactory baseline correction and allowed the use of a non-negativity constraint in the spectra direction when MCR-ALS analysis was carried out, as opposed to approaches like standard normal variate (SNV) and derivative preprocessing.
Data set configurations
The basic reaction adopted in this work for the methanolysis process is described by equation 9.
TG + 3 MeOH 3 ME + G (9)
where TG stands for triacylglycerols, MeOH for methanol, ME for methyl ester and G for glycerol.
that can be modeled by MCR-ALS is lower than the actual number of chemical species involved in the reaction.20-22
According to the mechanism of this reaction, only two contributions could be detected if a single batch was analyzed (this is due to the fact that TG and MeOH, and ME and G evolve with kinetic profiles showing the same shape). In addition, an extreme spectral similarity was observed in the spectral direction since the triacylglycerols (soybean oil) and the methyl ester (biodiesel) presented extremely correlated spectra (r² = 0.9911).
The application of multiset analysis to the batches organized in a column-wise augmented data matrix was essential in this work to surmount the drawbacks inherent to the nature of the process studied. The additional and different information present in the multiset structure allows a significant improvement of the models and can promote the reduction of the ambiguities associated with the fact that more than one solution can fit the experimental data.27
The multiset structure adopted in this work is presented in Figure 3.
Although the concentration profiles of batch M6 are not the focus of this work, this batch was added to the
multiset structure to help to provide a difference between the TG and MeOH and to reduce the rank deficiency in the concentration direction due to the identical evolution of these two reagents in the process. This is achieved because the ratio between the two reagents changes from M6 to the rest of batches and the augmented profiles of the two reagents (TG and MeOH) are no longer multiple of each other. Furthermore, a matrix containing a hundred pure spectra of methyl ester was added to the multiset structure to suppress the rank deficiency linked to the identical evolution of the products by adding selectivity to the data. This also helped to improve the correct identification of methyl ester, which is the most important compound in this work.20 The theoretical reasoning about the rank is
supported by the SVD analysis on the multiset structure, in which both the singular value magnitude and the process-like patterned scores confirm the need of four compounds to define the multiset studied.
MCR-ALS analysis
MCR-ALS was applied to the multiset structure adopting the non-negativity constraint in the concentration and spectral directions. The correlation constraint was applied only to the methyl ester, since this compound was the main target of interest. In the use of correlation constraint, five reference concentration values for methyl ester of each batch were employed (as mentioned before, this is a very small number of reference measurements compared with the number of calibration samples needed in classical multivariate calibration models). For batches at 20 and 45 °C, the reference values were obtained by chromatographic analysis as previously described by Lima et al.12 For batches at 55 °C, these values were
obtained through the PLS calibration model developed by Lima et al.12 since the available data from chromatographic
analysis did not include the concentration values at the
Figure 2. (a) Raw near infrared spectra and (b) MSC corrected spectra
of batch at 45 °C.
beginning of the reaction. If these values were available, it would not be necessary to use the PLS model. This model predicts the methyl ester content throughout the methanolysis reaction of soybean oil under the same conditions employed in the present work. In addition, although it has not been tested in the present work, it might be possible to prepare standards solutions simulating the reaction mixture and use their concentration as reference values. The concentration values used as reference for MCR models development for each batch are shown in Table 2.
Since the calibration relationship between the spectra of pure compounds and concentrations can change with temperature, four different MCR models were built applying the correlation constraint only to the batches obtained at a single temperature. A model for each batch at 55 °C had also been built. Models for batches at 20 and 45 °C were obtained using the data configuration presented in Figure 3. The two models for batches at 55 ºC were obtained using the same structure presented in Figure 3, but excluding batch M1 of the analysis. For each model, the pure spectra of the four compounds of the reaction, measured at the same temperature of the batch where the correlation constraint was applied were used as initial estimates.
Therefore, for the development of the first model, the structure presented in Figure 3 was used but the correlation constraint was only applied to the batches at 20 °C (M1 and M2). For model 2, the same structure presented in Figure 3 was used but the correlation constraint was only applied to the batch at 45 °C (M3). For model 3, the
structure presented in Figure 3 was also used, but excluding data from batch M1. For this model, only batch M4 was constrained with the correlation constraint. Similarly, for model 4, the same structure used for the development of model 3 was used, but only batch M5 was constrained with the correlation constraint. These data set configurations provided the best results in relation to the recovery of methyl ester concentration and spectral profile.
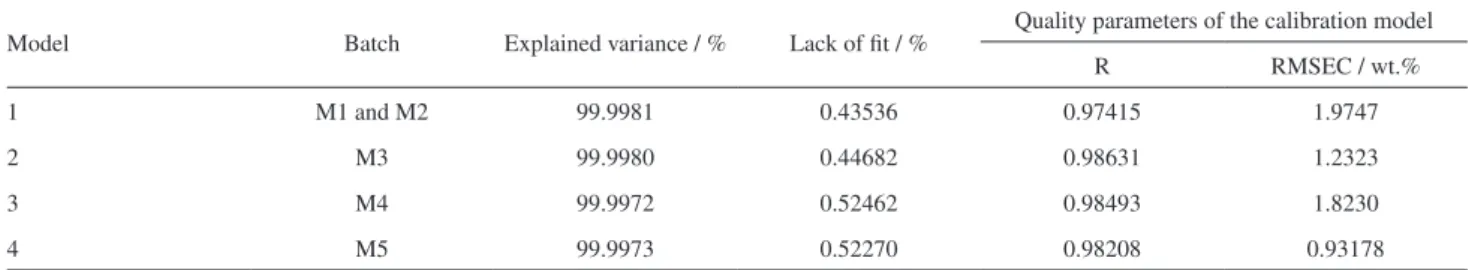
Table 3 shows the figures of merit of the models performed in this study. In all cases, squared correlation coefficients higher than 0.9999 were achieved between the recovered and experimental pure spectral shapes of methyl ester. As can be seen, the explained variance was always higher than 99.99%. The lack of fit also presented satisfactory values in all cases.
In addition, the parameters used to assess the ability to predict the methyl ester concentration using the correlation constraint (R and RMSEC) presented suitable values with RMSEC less than 2 wt.% for all models.
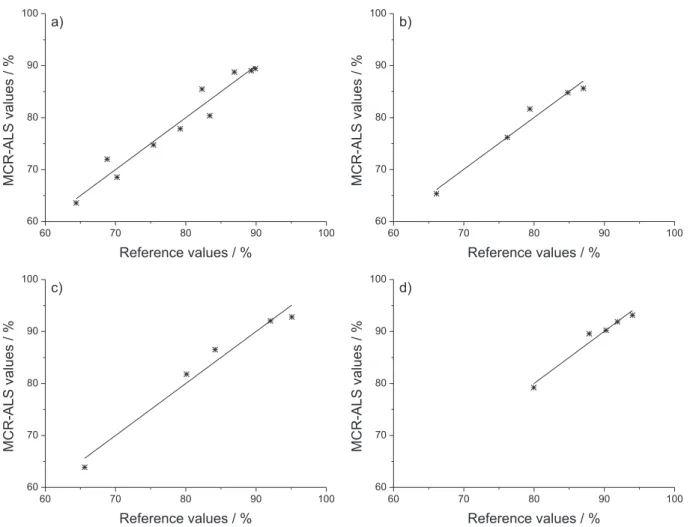
Figure 4 shows the graphs from calibration due to the application of correlation constraint in the MCR-ALS analysis for the four models. These graphs present the comparison between the values obtained from MCR-ALS and the reference values for concentration. Corroborating what was set in Table 3, these graphs show that the application of correlation constraint presented satisfactory results.
For example purpose, Figure 5 presents the concentration and spectra profiles of the four compounds involved in the overall reaction of soybean oil methanolysis provided by MCR-ALS analysis for batch M1 as well as the pure spectra of these compounds, that were applied as initial estimates. Figure 5a shows the normalized spectra provided by MCR-ALS and Figure 5b shows the pure spectra of the compounds corrected by MSC, for comparison purpose. Although there are some discrepancies in shapes among the resolved spectra and the pure ones for some species due to the presence of rotational ambiguity, it should be noted that the spectrum of the compound of interest, methyl ester, is perfectly recovered. The concentration profiles obtained by MCR-ALS were divided into two graphs because of the
Table 2. Reference concentration values of methyl ester for each batch under different experimental condition
Batch Reference concentration values of methyl ester / %
M1 64.40 70.20 75.40 79.20 83.40
M2 68.80 82.30 86.90 89.30 89.90
M3 66.10 76.20 79.40 84.80 87.00
M4 65.61 80.10 84.17 92.04 95.08
M5 79.94 87.84 90.25 91.87 94.00
Table 3. Figures of merit of the MCR-ALS analysis and quality parameters of the calibration model related to the use of correlation constrain for all models
Model Batch Explained variance / % Lack of fit / % Quality parameters of the calibration model
R RMSEC / wt.%
1 M1 and M2 99.9981 0.43536 0.97415 1.9747
2 M3 99.9980 0.44682 0.98631 1.2323
3 M4 99.9972 0.52462 0.98493 1.8230
different scales and are shown in Figures 5c and 5d. The most relevant conclusion is that concentration profile and pure spectra for methyl ester are satisfactory and evolve in the expected way. The rest of the compounds can be differentiated, although their profiles may show sometimes less satisfactory shapes due to the complexity of the system, the softer constraints applied to model them and, as a consequence, the remaining ambiguity in the final results.
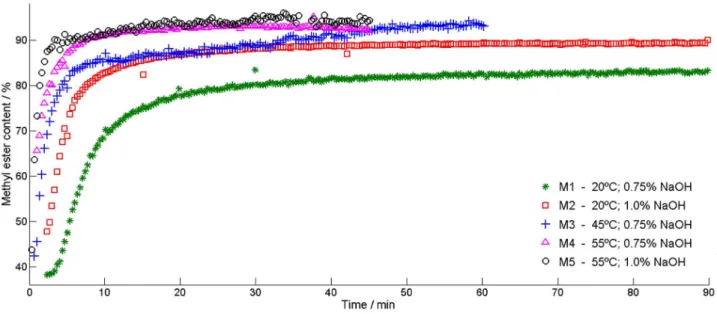
Figure 6 shows the resolved methyl ester concentration profiles (in real concentration units) for the five batches studied. A qualitative interpretation of the profiles demonstrates that an increase in the temperature and catalyst concentration improve the reaction rate and the methyl ester yield, as expected.
Batch M1, at 20 °C and with 0.75 m/m% of catalyst, presented a very low yield within the monitoring time. Moreover, it was observed that the difference among reaction behavior with different catalyst concentrations reduces as the temperature increases. Therefore, the effect of an increase in catalyst concentration is more evident for batches at 20 °C than for batches at 55 °C, since M4 and M5 presented similar methyl ester yields.
Noriega et al.7 observed similar behavior evaluating the
effect of temperature (from 40 to 60 °C) and catalyst concentration (NaOH, from 0.2 to 12 m/m%) on Jatropha
oil methanolysis.
For batch M1, at 20 °C and with 0.75 m/m% of catalyst, it was possible to recognize a sigmoidal profile. For this batch, there was a delay in ME production, followed by a rapid increase in the reaction rate after 4 min, approximately. Apparently, this batch did not reach the equilibrium in the total time that it was monitored (90 min). The sigmoidal shape has also been observed in other works, especially for reactions at lower temperatures. Most of them have suggested that the sigmoidal shape is associated with a mass transfer-controlled region, followed by a chemically-controlled region in the pseudo-homogeneous regime, and a final slow region as the system approaches equilibrium.3,35,36 In contrast, Csernica and Hsu4 studied
the phase behavior effect on the kinetic of soybean oil methanolysis, using KOH as catalyst. Contradicting what was previously proposed, the authors explained the sigmoidal shape by the phase transition from two phases to a single phase. Therefore, according to the authors, the
increase of triacylglycerols in the methanol phase, due to the formation of the single phase, provides an increase in rate of methyl ester production.
For other batches, this sigmoidal profile could not be identified. In the initial stage of these batches, the production of ME was fast and then slowed down, and
Figure 5. (a) Spectra provided by MCR-ALS; (b) pure spectra of the compounds corrected by MSC and (c and d) concentration profiles obtained by MCR-ALS. TG (dash dot magenta), MeOH (dashed red), ME (solid blue), G (dot green).
finally reached the equilibrium. According to Csernica and Hsu,4 the presence of methyl ester increases the solubility
of triacylglycerols in methanol and the mass transfer coefficient, which can explain the fast conversion of these reactions.
Vicente et al.36 also observed the shortening of first
slow regime for experiments at higher temperatures. This fact was attributed to the higher solubility of the oil in the methanol at higher temperatures. Noureddini and Zhu35
also observed this behavior at higher temperatures, but associated the fact with higher energy state of the molecules resulting in more effective collisions.
Kinetic modelling
Studies have identified three regimes of methanolysis reaction: a slow mass transfer-controlled heterogeneous regime at the beginning, followed by a fast pseudo-homogeneous chemical reaction-controlled regime and a final slow regime as the reaction approaches equilibrium.3
In the present work, a simplified kinetic model was considered including only the pseudo-homogeneous regime where the overall process kinetics is under chemical reaction control and a fast methanolysis rate is observed. Moreover, according to Vicente et al.36 and Noureddini and
Zhu,35 the initial mass transfer-controlled heterogeneous
regime is shortened at higher temperatures. Therefore, as can be seen in Figure 6, the sigmoidal curve (probably related to the initial mass transfer controlled regime) was mainly observed for batches at 20 °C and not for the other batches at 45 and 55 °C. In addition, the process was represented by the overall reaction, expressed by the aforementioned equation 9.
For the kinetic modelling, the following assumptions were adopted:
(i) the overall reaction (equation 9) is able to model
the methanolysis of the vegetable oil for biodiesel production. This assumption implies that the instantaneous concentrations of monoacylglycerols and diacylglycerols are small as a result of their consumption rates being fast;1,5
(ii) since the methanol is added in excess in relation to
the initial amount of vegetable oil, the reverse reaction is considered negligible;3
(iii) the composition of the reaction mixture was
considered uniform, perfectly mixed;1,5,37
(iv) the free fatty acid (FFA) content in the vegetable oil
was considered negligible; therefore, the neutralization of the free fatty acids was neglected. The saponification side reaction was also neglected. Both side reactions have also been neglected by other authors in the study of the soybean oil methanolysis;2,35
(v) the methanolysis of soybean oil was then considered
to follow a pseudo-first order overall kinetics based on methyl ester concentration, as was proposed by Jain and Sharma,10 following the equation 10:
(10)
where rME is the reaction rate, k is the first order rate constant
and [ME] is the concentration of methyl ester (mol m-³).
Integrating equation 10 and considering the density of reaction mixture constant throughout the reaction, leads to equation 11:
(11)
where wME is the methyl ester mass fraction, C’ is a constant
of integration and is the reaction time.
The temperature effect on the reaction rate was evaluated applying the Arrhenius law, expressed by equation 12.
(12)
where R is the universal gas constant, T is the absolute temperature (K), k0 is the frequency factor and Ea is the
activation energy (kJ mol-1).
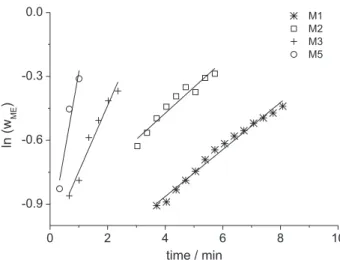
For the fast regime, the best kinetic behavior for analyzed data appears to follow a first-order model based on ME formation, as was proposed by Jain and Sharma.10
A plot of ln [wME] vs. reaction time for the methanolysis
processes is shown in Figure 7. The values of wME to
construct this graphic correspond to the values obtained from MCR-ALS analysis.
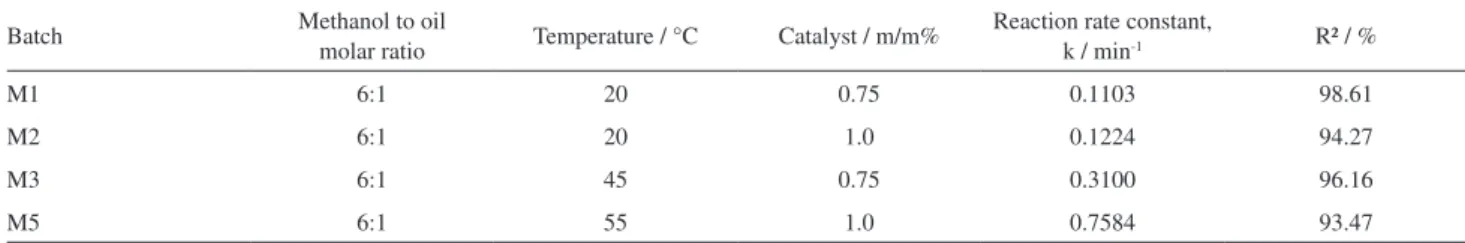
Table 4 reports the rate constants (k) and the correlation coefficients (R2) for the linear fit. The results showed an
Figure 7. The irreversible first order kinetic model based on methyl ester
acceptable fit for the linear model. The kinetic constant for batch M4 could not be obtained because of the lack of reliable initial concentration values. The estimated rate constants were used to determine the activation energy according equation 12, as shown in Figure 8. Results showed an acceptable fit to the Arrhenius equation (R2 = 95.6%).
The obtained activation energy value (39.3 kJ mol-1) was
comparable to the values reported by other authors using similar and different vegetable oils and kinetic models.3,7,36,38
Conclusions
In this work, the MCR-ALS method with correlation constraint was applied to NIR data acquired from monitoring of soybean oil methanolysis. This method was oriented to obtain the concentration profiles of the methyl ester along the process. The correlation constraint was applied during optimization by MCR-ALS to provide the concentration profiles in real concentration units for methyl ester production. To achieve this goal, five reference values were sufficient for each batch analyzed, as opposed to other analytical methods that require a greater effort in setting a suitable calibration set for analysis.
Due to the complexity of the system, a strategy based on the use of well designed multiset structures including a batch with different initial composition and the addition of pure spectra of the compound of interest was needed to improve the results. In this way, it was possible to recover
Table 4. Reaction rate constants and correlation coefficient of fitted equation 11
Batch Methanol to oil molar ratio Temperature / °C Catalyst / m/m% Reaction rate constant, k / min-1 R² / %
M1 6:1 20 0.75 0.1103 98.61
M2 6:1 20 1.0 0.1224 94.27
M3 6:1 45 0.75 0.3100 96.16
M5 6:1 55 1.0 0.7584 93.47
Figure 8. Arrhenius plot of reaction rate constants versus reciprocal of
temperature.
correct concentration profiles, in real concentration units, and pure spectrum for the methyl-ester.
The profiles recovered were then used to develop a simplified kinetic model and evaluate the effect of catalyst concentration and temperature on the kinetic reaction, since five batches at different conditions had been produced. The sigmoidal shape observed by other authors could also be observed in this work for the batch at 20 °C and with 0.75 m/m% of catalyst concentration. Moreover, it was possible to identify that the effect of an increase in catalyst concentration was more powerful for the batches at 20 °C than for batches at 55 °C, as had been expected. The activation energy calculated by the Arrhenius equation was in agreement with other values found in the literature. Thus, MCR-ALS with a correlation constraint applied to in-line NIR monitoring, provided useful information in enabling the recovery of spectra profiles and consequently developing kinetic models, even in a complex system, such as the methanolysis of soybean oil. This opens the use of NIR, much faster and simpler analytical technique than others previously used, combined with chemometrics for the analysis of the industrially relevant methanolysis process for biodiesel production.
Acknowledgments
The authors would like to thank FACEPE/NUQAAPE, CNPq/INCTAA science funding programs for partial financial support. Research fellowships granted by the Brazilian agencies ANP/Petrobras, CNPq are also gratefully acknowledged. A. J. also acknowledges funding of the Spanish government through the grant CTQ2015-66254-C2-2-P.
References
1. Miladinović, M. R.; Krstić, J. B.; Tasić, M. B.; Stamenković, O. S.; Veljkvić, V. B.; Chem. Eng. Res. Des. 2014, 92, 1740. 2. Tubino, M.; Rocha Junior, J. G.; Bauerfeldt, G. F.; Fuel 2014,
125, 164.
4. Csernica, S. N.; Hsu, J. T.; Ind. Eng. Chem. Res. 2012, 51, 6340. 5. Tasić, M. B.; Miladinović, M. R.; Stamenković, O. S.; Veljković,
V. B.; Skala, D. U.; Chem. Eng. Technol. 2015, 38, 1550. 6. Zabala, S.; Arzamendi, G.; Reyero, I.; Gandía, L. M.; Fuel 2014,
121, 157.
7. Noriega, M. A.; Narváez, P. C.; Heinz, C.; Fuel 2014, 134, 244.
8. Vicente, G.; Martínez, M.; Aracil, J.; Energy Fuels 2006, 20, 1722.
9. Nambo, A.; Miralda, C. M.; Jasinski, J. B.; Carreon, M. A.; React. Kinet., Mech. Catal. 2015, 114, 583.
10. Jain, S.; Sharma, S. P.; Bioresour. Technol. 2010, 101, 7701. 11. Knothe, G.; J. Am. Oil Chem. Soc. 2000, 77, 489.
12. Lima, S. M.; Silva, B. F. A.; Pontes, D. V.; Pereira, C. F.; Stragevitch, L.; Pimentel, M. F.; Fuel 2014, 115, 46.
13. Pinzi, S.; Alonso, F.; Olmo, J. G.; Dorado, M. P.; Fuel 2012, 92, 354.
14. Richard, R.; Dubreuil, B.; Thiebaud-Roux, D.; Prat, L.; Fuel
2013, 4, 318.
15. Kona, R.; Q. U. H.; Mattes, R.; Jancsik, B.; Fahmy, R. M.; Hoag, S. W.; Int. J. Pharm. 2013, 452, 63.
16. Richard, R.; Li, Y.; Dubreuil, B.; Thiebaud-Roux, S.; Prat, L.; Bioresour. Technol. 2011, 102, 6702.
17. Killner, M. H. M.; Rohwedder, J. J. R.; Pasquini, C.; Fuel 2011, 90, 3268.
18. De Juan, A.; Jaumot, J.; Tauler, R.; Anal. Methods 2014, 6, 4964.
19. De Juan, A.; Tauler, R.; Crit. Rev. Anal. Chem. 2006, 36, 163. 20. Ruckebusch, C.; Blanchet L.; Anal. Chim. Acta 2013, 765, 28.
21. Amrhein, M.; Srinivasan, B.; Bonvin, D.; Schumacher, M.; Chemom. Intell. Lab. Syst. 1996, 33, 17.
22. Salvatore, E.; Cocchi, M.; Marchetti, A.; Marini, F.; de Juan, A.; Anal. Chim. Acta 2013, 761, 34.
23. Tauler, R.; Chemom. Intell. Lab. Syst. 1995, 30, 133. 24. Blanco, M.; Castillo, M.; Beneyto, R.; Talanta 2007, 72, 519.
25. Cruz, S. C.; Rothenberg, G.; Westerhuis, J. A.; Smilde, A. K.; Chemom. Intell. Lab. Syst. 2008, 91, 101.
26. Antunes, M. C.; Simão, J. E. J.; Duarte, A. C.; Tauler, R.; Analyst
2002, 127, 809.
27. Jaumot, J.; Igne, B.; Anderson, C. A.; Drennen, J. K.; De Juan, A.; Talanta 2013, 117, 492.
28. Oliveira, R. R.; Lima, K. M. G.; Tauler, R.; De Juan, A.; Talanta
2014, 25, 233.
29. Río, V.; Larrechi, M. S.; Callao, M. P.; Anal. Chim. Acta 2010, 676, 28.
30. Río, V.; Larrechi, M. S.; Callao, M. P.; Talanta 2010, 81, 1572. 31. Mogollon, N. G. S.; Ribeiro, F. A. L.; Lopez, M. M.; Hantao,
L. W.; Poppi, R. J.; Augusto, F.; Anal. Chim. Acta 2013, 796, 130.
32. Rinnan, Å.; Berg, F. V. D.; Engelsen, S. B.; Trends Anal. Chem.
2009, 28, 1201.
33. Jaumot, J.; De Juan, A.; Tauler, R.; Chemom. Intell. Lab. Syst.
2015, 140, 1.
34. www.mcrals.info, accessed in July 2016.
35. Noureddini, H.; Zhu, D.; J. Am. Oil Chem. Soc. 1997, 74, 1457.
36. Vicente, G.; Martínez, M.; Aracil, J.; Esteban, A.; Ind. Eng. Chem. Res. 2005, 44, 5447.
37. Miladinović, M. R.; Stamenković, O. S.; Veljkvić, V. B.; Skala, D. U.; Fuel 2015, 154, 301.
38. Darnoko, D.; Cheryan, M.; J. Am. Oil Chem. Soc. 2000, 77, 1263.
Submitted: May 22, 2016