Magnetic and Transport Properties of PdH:
Intriguing Superconductive Observations
∗
Paolo Tripodi
1†, Daniele Di Gioacchino
2, and Jenny Darja Vinko
11H.E.R.A., Hydrogen Energy Research Agency, Corso della Repubblica 448, 00049 Velletri, Italy
2INFN-LNF National Institute of Nuclear Physics - National Laboratory of Frascati, Via Enrico Fermi 40, 00044 Frascati, Italy
Received on May 21, 2003
Since the discovery of superconductivity in palladium-hydrogen (PdH) and its isotopes (D,T) at low tempera-ture, several efforts have been made to study the properties of this system. Superconductivity of PdH system has been initially claimed by resistance drop versus temperature and then confirmed by dc magnetic susceptibility measurements. These studies have shown that the critical transition temperature is a function of the hydrogen concentrationxin theP dHxsystem. In all these experiments, the highest concentrationxof hydrogen in
palla-dium was lower than the unit. In the last decade we defined a room temperature and room pressure technique to load hydrogen and its isotopes into palladium at levels higher than unit, using electrochemical set-up, followed by a stabilization process to maintain the hydrogen concentration in palladium lattice stable. In the meanwhile, several measurements of resistance versus temperature have been performed. These measurements have shown several resistive drops in the range of [18K< Tc<273K] similar to the results presented in literature, when the
superconducting phase has been discovered. Moreover, on PdH wires 6cm long the current-voltage characteris-tic with a current density greater than6∗104Acm−2has been measured at liquid nitrogen temperature. These measurements have the same behavior as superconducting I-V characteristic with sample resistivity, at 77K, of two orders of magnitude lower than copper or silver at the same temperature. The measurements of first and third harmonic of ac magnetic susceptibility inP dHxsystem have been performed. These represent a good
tool to understand the vortex dynamics, since the superconducting response is strongly non-linear. Clear ac susceptibility signals confirming the literature data at low temperature (9K) and new significant signals at high temperature (263K) have been detected. A phenomenological approach to describe the resistance behaviour of PdH versus stoichiometryxat room temperature has been developed. The valuex=1.6 to achieve a macroscopic superconducting state inP dHxhas been predicted.
1
Introduction
1.1
PdH
x: overview
Hydrogen (H) and its isotopes dissolve in many metals and occupy interstitial sites in the host lattice producing an ex-pansion of the lattice. Each interstitial H causes displace-ment of the metal atoms from their original sites while its electrons fill the electronic band of the metal at the Fermi energy levelEF. This gives rise to a series of changes in physical properties of the hosting metal [1, 2]. In this frame-work Palladium (Pd) is a metal, intensely studied, for much of its peculiarities [3]. Usually it is employed as catalyst for hydrogen reactions [4]. Generally, for Pd the4d10state
should be completely filled but in reality the 10 electrons are shared between two zones and theEF intersects the 4d and the broad 5sp bands [3, 5]. There are 0.36 electrons in the 5sp band [5] and equal number of positive holes of unfilled state in d shell. For this reason Pd absorbs H very strongly. The paramagnetic susceptibility of pure Pd decreases from 550−600∗10−6 cgs units to diamagnetic behaviour of
P dHx for stoichiometryx =0.75, wherexrepresents the ratio between Pd and H moles [4]. These measurements lead
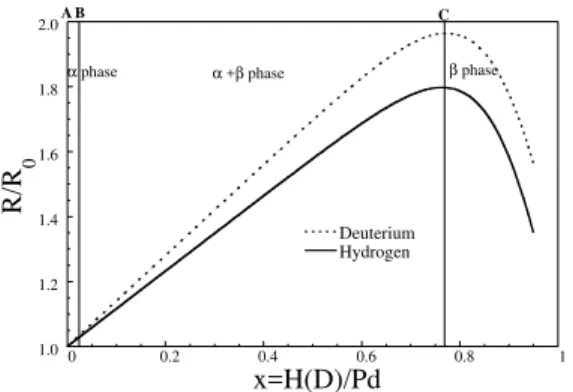
to deduction that the electron of the H goes into the d shell, thereby the number of positive holes decreases and hence the paramagnetic behaviour diminishes. There is a relation-ship between the electrical resistance of P dHx and the H stoichiometric valuex(Fig. 1). Analysing the relative resis-tanceR(x)/Ro, whereR(x)is the P dHx electrical resis-tance versusxandRois the pure Pd electrical resistance, an experimental pseudo-parabolic curve with negative concav-ity is observed. At room temperature, this curve has a max-imum atx≈0.75 and then it decreases almost to the initial value atx≈1. Considering that ideally in the fcc Pd lattice it should be possible to achieve a valuex=3 when all the octahedral and tetrahedral sites are occupied, immediately rises the question: what happens to the electrical resistivity of the PdH at room temperature forx>1? For low temper-atures, withx≤1 the answer is well known: P dHxsystem becomes superconductor [7, 8] withTc proportional to the x, namely, fromx =0.75 withTc=1K up toTc=9K forx close to 1. We will attempt a reply to our questions through experimental details.
∗Presented at the Workshop on Unconventional Superconductors (U-Super), Campinas May 20-24, 2003.
†Also at INFN-LNF National Institute of Nuclear Physics National Laboratory of Frascati, Via Enrico Fermi 40, 00044 Frascati, Italy;
1.0 1.2 1.4 1.6 1.8 2.0
0 0.2 0.4 0.6 0.8 1
Deuterium Hydrogen
R/R
0
x=H(D)/Pd
β phase
α phase α +β phase
A B C
Figure 1. Relative resistance R/Ro versus H stoichiometry
x=H/Pd (D/Pd) forP dHxsample (full line) and forP dDx
(dot-ted line).Rois the resistance of pure Pd sample at stoichiometry
x=0.
1.2
P dH
x: thermal coefficient of resistance
λ
We have studied the thermal coefficient of resistanceλfor P dHxsystem. It is well known that the resistance of metal-lic compounds depends on temperature. For a narrow tem-perature range, the resistance is described by equation (1):
R(T) =R(To) (1 +λ∆T) (1) where R(To) is the resistance of the sample at0oC.∆T = T-Tois the change in temperature andλrepresents the tem-perature coefficient of resistance. From the equation (1) the λequation (2) is calculated:
λ=
R(T)
R(To)−1
∗ ∆T−1 (2)
where λ expresses the sensitivity of the resistive element versus temperature.
103
104
105
0 0.2 0.4 0.6 0.8 1
λ
10
-6 [K
-1 ]
x
α
phase
α+β phase
β phase
γ phase
Figure 2. Thermal coefficientλofP dHx, in function of hydrogen
stoichiometryx[6]. The horizontal axes has been reverted for a better comparison with Fig. 3.
103
104
105
0 100 3 104 6 104 9 104 1,2 105 1,5 105
λ
10
-6 [K
-1 ]
Elapsed time [s]
λ
MAX previously measured [6]
λ
MIN previously measured
λ of pure Pd
x<1 x>1
Figure 3. Thermal coefficientλofP dHx, in function of time
dur-ing a slight H deloaddur-ing (Elapsed time). Each experimental point represents a measurement ofλin the temperature range 273-373K. In these measurements the exact stoichiometryx, is not known, but x >1 is present at the beginning of the experiment, i.e. when the elapsed time (τ) is in the range [0s< τ <9∗104s]. After the H loading the sample was stabilized and measured in temperature as to defineλversus elapsed time while the sample slightly leaks H.
There are contributions to the resistivity other than those due to lattice vibrations. For example, if a second element is present in a metal either as an impurity or as an alloy-ing element, this destroys the periodicity in the electrical potential and gives rise to elastic scattering, hence the re-sistivity increases. On the other hand, if a short or long range order is present then the resistivity decreases. Clearly the resistivity and in particular λ, are rather sensitive to the order/disorder states [9]. It is well known that λ is also dependent on the variation of stoichiometryx. Pure Pd (Fig. 2) hasλ =4000ppm then it increases to a maxi-mum ofλ=4200ppm atx≈0.05 corresponding to the phase transition between the αand the α+β phase. Increasing the H stoichiometryx,λdecreases reaching a minimum of λ=1800ppm at x≈0.75 corresponding to the phase transi-tion between theα+βand theβphase whereλremains con-stant [4]. Then a steep increase ofλ=15000ppm (Fig. 2) has been measured at aboutx≈1 [6]. This quasi-asymptotic behaviour shown in Fig. 2 would indicate a possible new phase transition between theβphase and the newγphase at x=0.95 [6].
In Fig. 3 we show further new experimental data demon-strating that withx >1 the coefficientλdecreases to lower values, that confirm the presence of the phase transition be-tween theβand the newγphase [6]. Experimental method to obtain these results is as follows: in the temperature range between the ice melting temperatureT0and the water
boil-ing temperatureTB, for fixed stoichiometryx, the temper-ature coefficient of resistanceλcan be considered constant, i.e. we assume that in the temperature range∆T=TB-T0the
slope of resistance versus temperature is constant as claimed in the formula (1). After the loading procedure the sample was cooled toT0 and the resistance was measured. After
again in the electrolitycal cell in floating configuration to obtain a slight H deloading. This procedure was repeated several times and in Fig. 3 every experimental point rep-resents a measurement ofλin function of the elapsed time during slow H deloading. During these measurements it was impossible to measure the H stoichiometryxin the sample. The only available indication onxis that the stoichiometry is decreasing in time, i.e at elapsed time zero,xis maximum and then it decreases with time. The last threeλpoints, in Fig. 3, are coherent withλvalues forx <1 shown in Fig. 2 [6]. This indicates that the other points in Fig. 3 showλat very high stoichiometryx >1. In conclusion, in the newγ phase (x >1) theλvalue is extremely low, in some cases we have measured aλas low as 1ppm, whereas close to the transition stoichiometry (x≈1)λachieves very high values, up to 66000ppm.
1.3
PdH
x: electrical transport measurements
A series of electrical transport measurements on P dHx wires, with 50µm diameter, will be presented. Experimental data on theP dHxbehaviour at very high, unexplored, stable H concentrationxversus temperature (Fig. 4) shows a resis-tance drop atTc=51.6K. Applying 1T dc magnetic field, the resistive drop splits to two lower temperatures of 31.3K and 18.8K [10, 11]. This data renders more consistent,but not definitive reply to our question, on the presence of a pos-sible superconducting phase. In the light of this data, we prepared severalP dHxsamples with very high stoichiome-tryxand hence several resistive drops have been measured from 80K up to 273K as shown in Fig. 4. These measured resistance drops, from 5% to 10% of the offset resistance values, have already been published [10, 11]. The presence of these resistance drops for different temperaturesTc in-dicates differentxconcentrations in the samples and that only a small fractions of the sample have thexvalue such as to cause the decreases of the resistance at given temper-ature. In order to calculate the correspondingxcvalues we used the equation presented in Fig. 13. This equation corre-latesxcwithTc. Another interesting measurement is the I-V characteristic for aP dHxsample atLN2temperature that
shows superconducting critical current greater than6∗104
Acm−2(Fig. 5) [10]. The I-V value threshold is by 2
or-ders of magnitude higher, as we have already underlined in the reference [10]. However, our evaluation is based on the fact that the voltage drop on theP dHx wire at 77K is a constant value with a variable current I. This cannot be a be-havior of a normal resistance since there is no slope of the I-V characteristic. Moreover, the rapid increase of the volt-age drop V around the current value of 1A indicates a rapid resistance increase. As shown in Fig. 5, the effectiveP dHx sample resistivity at 77K is 5nΩcm which is lower than cop-per and silver resistivity at 77K respectively of 300nΩcm and 200nΩcm.
20
40
60
0
1
2
3
4
5
Normalized Resistance
80
90
100
TEMPERATURE (K)
265
275
Figure 4. A series of superconducting transitions forP dHx. The
normalized resistance versus temperature is shown, as reported in literature [8].
0 1 2 3 4 5 6 7
0.0 0.2 0.4 0.6 0.8 1.0 1.2
V(mV)
I(A) lenght=6cm ; diameter=50 micron
J
c = 6*10 4
[A/cm2]
E
c=3x10 -4
V/cm
T=77K
Figure 5. Critical current inP dHxwire at T=77K [10].
1.4
PdH
x: sample preparation
H was loaded into the Pd lattice using an electrochemi-cal cell. This chemielectrochemi-cal absorption process of H was used preferentially over physical absorption ( via H2gas
to the cathode. The attainment of very high loading levels was found to be critically dependent on controlling the im-purities in the electrolyte. The electrolyte consisted of stron-tium sulfate (SrSO4) dissolved in 18MΩcm water (10−5M)
giving a slightly acidic solution (5.0≤pH≤6.5). The elec-trolysis required a dc current from 5mA up to 200mA. Dur-ing electrolysis the four probe ac resistance measurements of the Pd cathode were taken using an RCL meter at 1mA, 1KHz sinusoidal current. Highly loadedP dHx samples, were electrochemically stabilised by adding (10−5M)
mer-curous sulfate (Hg2SO4) to the electrolyte. With this
pro-cedure the coated cathodes are found to be resistant to H deloading for periods of months at room temperature and pressure. The Pd-Hg “alloy” forms an amalgam that covers the Pd surface and the depth of this “coating” is hundreds of nanometers, so that the effect of the resistance decrease, due to this coating, is negligible.
1.5
PdH
x: mean stoichiometry measurement
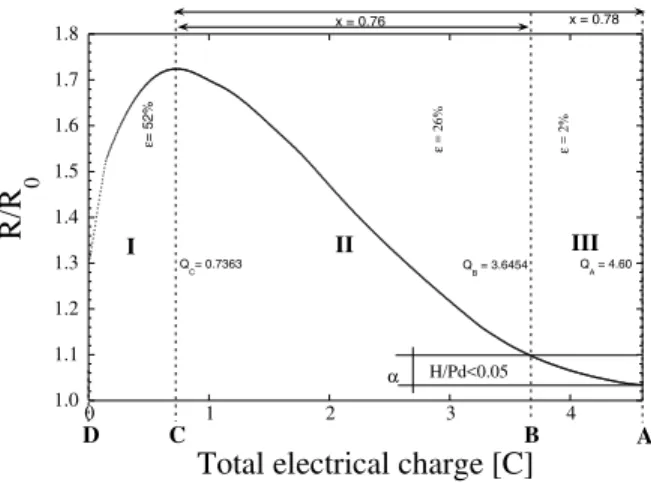
Important characterization of the sample is the measurement of the average final stoichiometric valuex. In order to ob-tain the x value, it is necessary to know the value of H and Pd moles. Pd moles are measurable with a sensitiv-ity of about 1µmol, but due to the low weight of H moles inside the Pd sample these measurements for hydrogen are not simple. For this purpose we have defined an electro-chemical method, destructive however, for theP dHx sam-ple. Therefore it can only be used as a standard method for the measurement of relative resistance R(x)/Roversusxas described below. To calculatexwe need to evaluate the effi-ciencyεduring the electrochemical H deloading process to avoid the undesired overestimation ofx.εis defined as ratio between the variation of stoichiometry∆xcorrelated with deloaded H from the sample and the corresponding amount of electrical charge∆Qtransferred through the electrodes:
ε= ∆x
∆Q (3)
For the ε calculation the following experimental evi-dences are used:
1. the behavior of R(x)/Roversusxof theP dHx(fig.1) has 3 experimental constraints:
(a) point (A) where R(x)/Ro=1 forx=0;
(b) point (B) that is the separation point between α and α+ β phase where R(x)/Ro=1.07 for x≈0.05;
(c) point (C) the maximum of the curve where R(x)/Ro=1.76 forx=0.75;
2. The electric chargeQpassed through the electrodes during the deloading ofP dHxsamples, proportional to the amount of H moles that exit Pd lattice. For the average final valuex, the following is used:
1. The final value R(x)/Roachieved during the H load-ing in Pd (point D Fig. 6);
2. The estimated efficiencyεvalue.
1.0 1.1 1.2 1.3 1.4 1.5 1.6 1.7 1.8
0 1 2 3 4
R/R
0
Total electrical charge [C]
H/Pd<0.05
α
x = 0.78 x = 0.76
ε
= 26%
Q
C= 0.7363 QB = 3.6454 QA = 4.60
ε
= 2%
I II III
A
D C B
ε
= 52%
Figure 6. R(x)/Ro during H deloading versus electric charge
passed trough the electrodes.
6.1 6.2 6.3
0.0 2.5 5.0 7.5 10.0
4 6 8 10 12 14 16
χ'
1
χ"
1
χ
' 1
(arb.unit x 10
-3 )
χ
"
1 (arb.unit x 10
-5
)
Temperature (K)
Figure 7. Real (triangles) and imaginary (circles) part of first har-monic (Hac=6G f=1KHz) ofP dHxslab (x≈1).
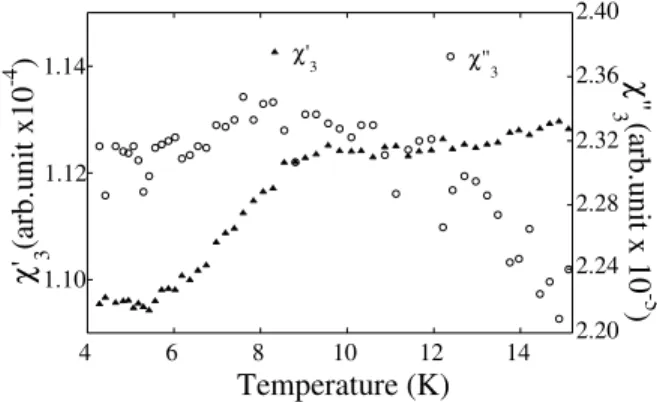
1.10 1.12 1.14
2.20 2.24 2.28 2.32 2.36 2.40
4 6 8 10 12 14
χ'
3 χ"3
χ
' 3
(arb.unit x10
-4 ) χ"
3 (arb.unit x 10
-5
)
Temperature (K)
Figure 8. Real (triangles) and imaginary (circles) part of third har-monic (Hac=6G f=1KHz) ofP dHxslab (x≈1).
From this definitiveεvalue we obtain the final meanx value. The electric charge in the zone I, from the point (C) to the point (D), is∆Q=0.8 Coulomb. Hence the mole num-ber of the H entered in the sample for the zone I, consid-eringε=52%, gives∆x=0.4. Now, as stated in item 1(c), the stoichiometry of the sample is∆x=0.75. Therefore the final stoichiometry isxf ≥0.75 + 0.4 =1.15. Resuming this procedure, there are two important implications. First of all, this method is general and valid for any sample ge-ometry. Secondly, it is independent from any concurrent electrochemical processes and from Pd sample moles.
2
Results and Discussion
To further define the possible superconducting properties of P dHx at high temperatures, we have performed and are presenting in this paper, the measurements of ac magnetic susceptibility and its higher harmonics. It is extremely im-portant to check the presence of high harmonics since the superconducting response is strongly non-linear. In fact in the following section 2.1, we will discuss the first and third harmonic of the ac magnetic susceptibility measurements, moreover in section 2.2 a possible simple phenomenologi-cal approach that explains theP dHx relative resistance in function ofxat fixed temperature (300K) will be presented.
-2 0 2 4 6 8 10 12 14
258 260 262 264 266
1 measure 2 measure
χ
"
1(arb.units x 10
-5
)
Temperature (K)
Figure 9. Imaginary parts of first harmonic ofP dHxslab, first
measure (full circles), second measure after 1 week (empty circles) (x >1).
2.1
ac susceptibility measurements
The ac magnetic susceptibility (χn=χ ′
n+iχ”n : n=1,3) measurements were performed with the European Facility 8T flow cryostat [12]. This cryostat has a susceptometer with an in-line double pick-up coil (Helmotz like) bridge with an exciting external ac magnetic field up to 6G at fre-quency in the range [31Hz<f<2kHz], able to acquire with a lock-in amplifier the first seven harmonics of ac magnetic susceptibility, with the possibility to use a dc magnetic field up to 8T. The sample was cooled down to LHe temperature in ZFC (Zero Field Cooling) then the temperature has been slowly increased up to 300K. The data file collects the exper-imental value of ac susceptibility as the average value of 5 points while the temperature is not varied more than 0.01K. The subtraction of the null file due to the measurement sys-tem has been performed.
Some consideration on the phase measurement of the sample must be done for clarity. Usually in the ac mag-netic susceptibility measurements the phase of the signal is imposed in order to maximize the in-phase (χ′1) component and minimize the out-phase (χ”
1) component when the
sam-ple is in superconducting or normal state (zero-phase pro-cedure). In this case we minimized the imaginary part at LHe temperature. In Fig. 7, the realχ′1and the imaginary
χ”
1components of the first harmonic are plotted at low
tem-perature and a Tcof 9K [7] is shown. In Fig. 8, the third harmonic χ′3 and χ”
3 shows similar behavior of the
sam-ple. This indicates the presence of the well-known super-conducting phase at low temperature. This superconduct-ing phase, in accordance with literature data, is achieved for a stoichiometry x≈1 [7]. In Fig. 9 (first measurement) a very significant signal of the imaginary component χ′′1 is
to lower temperatureTc=261.5K (slight deloading, proba-bly due to thermal cycles). A clear diamagnetic signal of the real componentχ′1is shown in Fig. 10, overlapped with an extensive paramagnetic signal due to theP dHxzones with stoichiometry in the range [0≤x<0.75] [4, 13]. This in-dicates that only a small fraction of theP dHx sample has the appropriate stoichiometryx >1 corresponding to the su-perconducting phase at this critical temperatureTc=263.5K. This slope recalls the magnetic susceptibility behavior of the RBa2Cu3O7−xwith paramagnetic ordered rare earths
(R=Sa,Eu,etc.) where, decreasing the temperature well be-lowTc, the behavior changes from diamagnetism to param-agnetism [14].
6,95
7,00
7,05
7,10
258
260
262
264
1 measure
2 measure
χ
'
1(arb.units x 10
-3
)
Temperature (K)
Figure 10. Real parts of first harmonic ofP dHxslab, first
mea-sure (full squares), second meamea-sure after 1 week (empty triangles) (x >1).
-10 -5 0 5 10
-1 -0,5 0 0,5 1
240 245 250 255 260 265
χ'
3
χ' '
3
χ
' 3
(arb. unit x10
-6 )
χ
''
3 (arb. unit x10
-6
)
Temperature (K)
Figure 11. Real and imaginary parts of third harmonic ofP dHx
slab (first measure).
The fact thatχ′1signal has a value lower than expected
(about 1/6 less) in comparison with the imaginary compo-nentχ′′
1, can be imputed to the non-appropriate zero-phase
procedure, in fact, the imaginary component has been min-imized at 4.2K and this procedure is strongly dependent on the temperature. We checked the presence of the third har-monic and in Fig. 11 the third harhar-monic real and imaginary part of first measure show a clear oscillation with an onset
temperature of 264K. These results have been obtained af-ter two months (room temperature and pressure) storage of these highly H loadedP dHxsamples and the same sample rendered nearly the sameTc in three consequent measure-ments.
2.2
R/R
oH loading at 300K: a
phenomeno-logical approach
The behaviour interpretation of the relative resistanceR/Ro at 300K in function ofxcontent, uses the concept of the two phases (α,β) and their coexistence (α+β) in theP dHx sys-tem [3] but since H is not a parent metal of Pd, this approach is not applicable. As shown in Fig. 12, a phenomenological model has been developed. The model predicts thatR/Ro of the P dHx systems at room temperature will exponen-tially decrease with the increasing of H loadingxforx>1. Moreover, it predicts thatR/Rowill decrease to zero resis-tance atxc=1.6, so that theP dHxwill be in a room temper-ature superconducting state. TheP dHxsystem is modelled as having two electron transport mechanisms available in parallel: one superconducting fluctuation transport and the other normal transport. In other words, their corresponding resistances are in parallel to obtain the overall resistance.
0.0 0.5 1.0 1.5 2.0
0 0.5 1 1.5 2
R/R
0
X X
0
X
c
T=300K
Figure 12. The best fit of experimental data forP dHx sample
using the parallel model of the relative resistance. A critical tem-peratureTc=300K is achieved atxc=1.6. Thexorepresents the
H stoichiometry where the relative resistance is at maximum value.
The normal electron transport mechanism is modelled to describe a relative resistance that linearly increases with the stoichiometryx. This linear dependence is believed to result from the linear increase in the number of scattering centres in the system with the increase ofx. Thus, the relative resis-tance is written as:
R
Ro
l
= 1 + Λx (4)
is modelled to describe a relative resistance that exponen-tially decreases withx. This exponential dependence for
x>1 is written as:
R
Ro
e
=βe−γ(x−xo)
(5) whereRandRoare as defined in Eq. 4,βis correlated with the frequency described in the superconducting fluctuation theory [15].γis the ratio between the free energy increment [15] or the condensation energy of the superconducting do-mains and the Boltzmann factorkT at 300K. (x-xo) rep-resents the number of fluctuating superconductive domains forxin the range [0.75<x<xc][16].
This superconducting fluctuation process can be ex-plained as follows: During the H loading, the H electron fills the unfilled 4d state easily without affecting much the EF level due to the high electron state density in 4d shell. Increasing H stoichiometry, the electrons fill the unfilled 5sp bands above the 4d bands. Due to the low electron state density of 5sp band, theEF must be raised. This leads us to deduce that the dissolved H atoms in Pd are completely ionised (H+) in interstitial position without being
specifi-cally bound to a particular Pd atom. The dissolvedH+ions
[5] are also extremely mobile. The transition rate is1012
s−1and the self-diffusion coefficient is10−6cm2s−1.H+
ions localized in a cluster, in average remain about their sites for 10 oscillations before moving to nearest-neighbour sites. Meanwhile, the sub-lattice vibrates with very high localized optical frequencies at about1013Hz, due to the lightness of
the H mass. In this context a local fluctuation of supercon-ductivity inP dHxcan occur with a rather unusual coupling between localised optical phonons and theEF electrons that spent considerable time aroundH+ions. This combination
allows the electrons atEF level to experience the attraction through H-sub-lattice (BCS like approach). Increasing H content, the number of clusters and local superconducting fluctuations increases achieving the complete superconduct-ing phase.
0 1 2 3 4 5 6
-0.3 -0.2 -0.1 0 0.1 0.2 0.3 0.4 0.5
ln(Tc)
ln(x)
Tc= n X n
Figure 13. Experimental stoichiometryxdata forP dHxsamples
with lowTc[7] (empty circles) together with our
phenomenologi-cal approach datum (gray square). In accordance with this model, xvalues for a series of experimentalTcshown in Fig. 4, have been
printed as full circles.
Adding the relative resistances from Eq. 4 and Eq. 5 in parallel, one obtains a phenomenological expression for R/Roat room temperature as a function ofx:
R
Ro
p
= (1 + Λx)βe
−γ(x−xo)
1 + Λx+βe−γ(x−xo)
(6)
Using the fitted free parameters, the resulting curve is shown in Fig. 12. The best fit of equation (6) produces the final equations (7,8):
R
Ro
l
= 1 + 1.16x (7)
R
Ro
e
= 40e−12.4(x−0.76) (8)
In equation (7), the parameterΛ=1.16 is strictly corre-lated with the linear lattice expansion during H loading [1]. From equation (8) the condensation energy of 270meV for the superconducting phase can be calculated atx=xc. This value is in the expected range for the formation energy of coherent systems. The equations 6-8 render the valueR=0 forxc=1.6. This indicates a possible superconducting state at 300K for xc=1.6. This datum (gray square in Fig. 13) together with the experimental data at low Tc (empty cir-cles in Fig. 13) reported in literature, are used to extrapolate the relationship in Fig. 13: Tc=nxn. ForP dHx system re-sultsn=7.86. Using this relationship we added the resistance drops data (Fig. 4) to the plot in Fig. 13 (full circles) to ob-tain a quantification of the mean stoichiometryxthat results in the range [1.27< xc<1.57].
3
Summary and conclusions
This letter presents first and third harmonics of ac suscep-tibility data together with our previous variety of experi-mental data [10] on electrical transport. These measure-ments together with several resistive drops in the temper-ature range [51.6K< Tc<273K] give some further indica-tion to answer the quesindica-tion: what happens at room temper-ature forx>1 inP dHxsystem? Should theP dHxsystem
withx>1 be a HTSC, the presented data must be confirmed
with a clear Meissner effect measurement. Nevertheless, a small diamagnetic signal ofχ′1at 263K in coincidence with imaginary part ofχ′′
1 and real and imaginary part of third
harmonics have been measured. A simple phenomenologi-cal approach based on the parallel of two electric transport mechanisms in order to explain theR/Robehaviour at room temperature in theP dHxsystem as a function of the H con-centrationxhas been developed. The first mechanism ex-plains the experimental increases of the relative resistance in theP dHxsystem due to the lattice expansion in the range
[0<x<xo=0.75]. The second mechanism explains the
Acknowledgements
We wish to thank our collaborators Antonio Celluci and Riccardo Romanato for their valuable collaboration.
References
[1] G. Alefeld and J.Vo¨lkl, Hydrogen in Metals I, Springer-Verlag (1978)
[2] G. Alefeld and J.V¨olkl, Hydrogen in Metals II, Springer-Verlag (1978)
[3] N.F. Mott and H.Jones,The Theory of the Properties of Metal and alloys, Dover Publications, Inc. (1936) 183,186 [4] F.A. Lewis,The Palladium Hydrogen,Academic Press (1967) [5] M.H. Lee, Separation Science and Technology, 15, 457
(1980)
[6] P. Tripodi, M.C.H. McKubre, F.L. Tanzella, P.A. Honnor, D. Di Gioacchino, et.al, Physics Letters A276, 122 (2000)
[7] T.Skoskiewicz, Phys. Stat. Sol. (a)11, K123 (1972)
[8] B. Stritker, W. Buckel, Z. Physik257, 1 (1972)
[9] R.J. Weiss,Solid State Physics for Metallurgists, Pergamon, Press. (1963) 235
[10] P. Tripodi, D. Di Gioacchino, R. Borelli, J.D. Vinko, Physica C389, 571 (2003)
[11] Paolo Tripodi, patents WO0167525, EP1269550, AU7436301, US2003144151
[12] This susceptometer is located in Frascati National Labora-tory (I.N.F.N.). Facility of Transnational Access to Research Infrastructure (TARI) contract HPRI-CT-1999-00088
[13] C. Kittel, Introduction to Solid State Physics 6th editions Wiley&Sons (1986) p.417
[14] H. Zhou, C. L. Seaman Y. Dalichaouch, B.W. Lee, K.N. Yang,R.R. Hake, M.B. Maple,R.P. Guertin, M.V. Kuric, Physica C152, 321 (1998)
[15] M. Tinkham, Introduction to Superconductivity, McGraw-Hill (1996) 290-291
![Figure 4. A series of superconducting transitions for P dH x . The normalized resistance versus temperature is shown, as reported in literature [8]](https://thumb-eu.123doks.com/thumbv2/123dok_br/18980272.456769/3.918.494.822.81.353/figure-superconducting-transitions-normalized-resistance-temperature-reported-literature.webp)

![Figure 13. Experimental stoichiometry x data for P dH x samples with low T c [7] (empty circles) together with our phenomenologi-cal approach datum (gray square)](https://thumb-eu.123doks.com/thumbv2/123dok_br/18980272.456769/7.918.123.448.739.966/figure-experimental-stoichiometry-samples-circles-phenomenologi-approach-square.webp)
