Article
J. Braz. Chem. Soc., Vol. 26, No. 3, 572-579, 2015. Printed in Brazil - ©2015 Sociedade Brasileira de Química 0103 - 5053 $6.00+0.00
A
*e-mail: [email protected]
Levels of Soybean Oil and Time of Treatment for Nile Tilapia: a Factorial Design for
Total n-3 Fatty Acids, n-6/n-3 and PUFA/SFA Ratios
Ana P. Lopes,a Vanessa V. A. Schneider,*,b,c Paula F. Montanher,a Ingrid L. Figueiredo,a
Hevelyse M. C. Santos,b Swami A. Maruyama,a Angela M. M. Araújod and
Jesuí V. Visentainera
aDepartment of Chemistry and bPost-Graduate Program of Food Science, State University of
Maringa, Av. Colombo, 5790, 87020-900 Maringá-PR, Brazil
cFederal University of Technology-Paraná, R. Marcílio Dias, 635, 86812-460 Apucarana-PR, Brazil
dDepartment of Statistical, State University of Maringa, Av. Colombo, 5790,
87020-900 Maringá-PR, Brazil
A 22 factorial design (two factors with two levels, in triplicate) was performed to investigate
the influence of factors A (soybean oil content in supplemented diet, at 2.1 and 4.2%) and B (time of treatment, 15 and 30 days) in three responses [(a) total n-3 fatty acids; (b) n-6/n-3 ratio; and (c) polyunsaturated fatty acids (PUFA)/saturated fatty acids (SFA) ratio] from lipids of Nile tilapia submitted to experimental treatment. Normality of residuals was assessed through statistical tests. Factors A and B were significant in all obtained regression models, while AB interaction was not a significant contributor for PUFA/SFA response. ANOVA and response surfaces obtained from factorial design indicated best results in tilapia that received the diet containing 4.2% of soybean oil during 30 days.
Keywords: Oreochromis niloticus, omega-3, response surface, chemometrics
Introduction
Factorial design is a widely used statistical tool in the scientific community for different samples and purposes due to its simplicity, while allowing interpretation of results considering all involved experimental parameters and providing the effects of possible interactions between selected variables.1
According to official data, Brazilian fish production was 500000 t in 2011 and tilapia ranked first in this statistic with more than 253000 t.2 Nile tilapia (Oreochromis niloticus)
accounts for 40% of the total production from national fish aquaculture. Globally, tilapia ranks fourth in commercial breeding of aquatic species and more than 3000000 t of this species were breeded in 2010.3
Studies have been done in order to increase omega-3 (n-3) fatty acid contents in muscular tissues of farm-raised tilapia through dietary enhancements with seeds/oils which are rich in polyunsaturated fatty acids (PUFA).4,5 Significant
differences in lipid composition between wild and
farm-raised freshwater fish were published recently. In general, wild fish possess higher and lower contents of n-3 and n-6 fatty acids, respectively, than farm-raised freshwater fish.6
According to ANVISA, soybean oil has 19-30% of oleic acid (18:1n-9), 44-62% of linoleic acid (18:2n-6; the most important fatty acid from omega-6 (n-6) series), and 4-11% of linolenic acid (18:3n-3; the most important fatty acid from n-3 series).7 From a nutritional point of
view, the PUFA intake is important to humans, while ingestion of saturated fatty acids (SFA) is associated with increased serum cholesterol level in humans. According to the Department of Health and Social Security, diets that feature a PUFA/SFA value greater than 0.45 are considered healthy to human nutrition.8
According to Simopoulos,9 the modern lifestyle led
Therefore, the objective of this work was the application of a 22 factorial design in order to investigate the influence
of two factors, soybean oil content in diets and treatment time, at two levels (2.1 and 4.2%; 15 and 30 days, respectively), for Nile tilapia and to evaluate possible changes on n-3 contents, n-6/n-3 and PUFA/SFA ratios from the obtained fish lipids.
Experimental
Experimental diets
Two supplemented rations, in pellet form, containing soybean oil (2.1 and 4.2%) were produced according to Table 1. The ingredients were milled, sieved, mixed with water to obtain the pellets (3 mm of diameter), and dried in an oven with air circulation at 55 °C for 10 h. The pellets were vacuum-packed, protected from light and kept at
−18 °C until use in fish feeding. Proximate composition
and lipid composition data of the experimental diets are also included in Table 1.
Breeding and sampling of fish
This study was conducted in the laboratory of Food Chemistry, Department of Chemistry of State University of Maringá, during the summer period of 2013. A total of 180 fish (Nile tilapia) were obtained from Fish Experimental Station UEM/Codapar, located in Floriano District of Maringá-PR, with initial average weight of 12.00 ± 1.00 g. The fish were equally divided into 6 tanks of 40 liters with constant oxygenation and external filtration and circulation of water. The cleaning of the tanks was made every morning by siphoning feces and uneaten food. Approximately 50% of the water volume was replaced by clean water after cleaning each tank. Each treatment was conducted in triplicate. In the first 10 days, all tanks were fed with the same diet containing soybean oil at 2.1% for adaptation of the fish to the new conditions. On the 10th day, the zero-time was established.
Then, tanks were divided randomly into two treatments (TI and TII), where the fish received supplemented diets. Fish were fed in the morning and late afternoon, during a period of 30 days. After 15 days, a sample (composed of 12 fish) was removed of each tank and the period of 15 days was established. Sequentially, the experiment was carried out for more 15 days, when the period of 30 days was completed. Samples were also performed by collecting 12 fish per tank. Fish were euthanized with a lidocaine overdose (10 g L−1).
The samples were disemboweled, washed, filleted, vacuum packed in polyethylene bags and stored at −18 °C for later
analysis.
Lipid extraction and fatty acid composition
Total lipids were extracted by the Bligh and Dyer method.10 Fatty acid methyl esters were prepared by
methylation as described by Hartman and Lago,11 and
modified by Maia and Rodriguez-Amaya.12 Analyses were
carried out in triplicate. Methyl esters were separated by gas chromatography in a Thermo model Trace Ultra
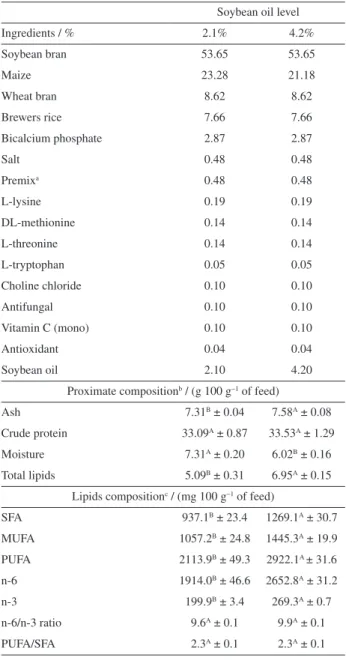
Table 1. Composition of experimental feed diets with soybean oil in two levels
Soybean oil level
Ingredients / % 2.1% 4.2%
Soybean bran 53.65 53.65
Maize 23.28 21.18
Wheat bran 8.62 8.62
Brewers rice 7.66 7.66
Bicalcium phosphate 2.87 2.87
Salt 0.48 0.48
Premixa 0.48 0.48
L-lysine 0.19 0.19
DL-methionine 0.14 0.14
L-threonine 0.14 0.14
L-tryptophan 0.05 0.05
Choline chloride 0.10 0.10
Antifungal 0.10 0.10
Vitamin C (mono) 0.10 0.10
Antioxidant 0.04 0.04
Soybean oil 2.10 4.20
Proximate compositionb / (g 100 g−1 of feed)
Ash 7.31B ± 0.04 7.58A ± 0.08
Crude protein 33.09A ± 0.87 33.53A ± 1.29
Moisture 7.31A ± 0.20 6.02B ± 0.16
Total lipids 5.09B ± 0.31 6.95A ± 0.15
Lipids compositionc / (mg 100 g−1 of feed)
SFA 937.1B ± 23.4 1269.1A ± 30.7
MUFA 1057.2B ± 24.8 1445.3A ± 19.9
PUFA 2113.9B ± 49.3 2922.1A ± 31.6
n-6 1914.0B ± 46.6 2652.8A ± 31.2
n-3 199.9B ± 3.4 269.3A ± 0.7
n-6/n-3 ratio 9.6A ± 0.1 9.9A ± 0.1
PUFA/SFA 2.3A ± 0.1 2.3A ± 0.1
aMineral and vitamin supplement; b and c results expressed as mean ± S.D.
3300 equipped with a flame ionization detector and a cyanopropyl capillary column (100 m × 0.25 i.d., 0.25 µm film thickness, CP-7420). The gas flow rates used were 1.2 mL min−1 carrier gas (H
2); 30 mL min−
1 makeup gas
(N2); 35 and 350 mL min−1 flame gases (H2 and synthetic
air, respectively). The sample (2 µL) splitting ratio was 1:80. Operation parameters were as follows: detector temperature, 240 °C; injection port temperature, 230 °C. Initially, the column temperature was maintained at 165 °C for 7 min. It was then raised to 185 °C, at a rate of 4 °C min−1, and
kept at this temperature for 4.67 min. After this period, it was once again raised to 235 °C at a rate of 6 °C min−1 and
maintained for 5 min, totaling 30 min of chromatographic run. Peak areas were determined by Software Chromquest 5.0. For the fatty acid identification, retention times were compared with those of standard methyl esters. Fatty acids were quantified against tricosanoic acid methyl ester (from Sigma) as an internal standard, as described by Joseph and Ackman.13 Theoretical flame ionization detector (FID)
correction factor values were used to calculate fatty acid concentration values in mg g−1 of total lipids with equation
1, according to Visentainer.14
A W CF
X IS X
FA =
A W CFIS X AE (1)
where FA is mg of fatty acids per g of total lipids, AX is
the peak area (fatty acids), AIS is the peak area of internal
standard methyl ester of tricosanoic acid (23:0), WIS is the
internal standard weight (mg) added to the sample, WX is
the sample weight (g), CFX is the theoretical correction
factor, and CFAE is the conversion factor necessary to
express results as mg of fatty acids rather than as methyl esters.
Experimental design
A 22 factorial design was employed to study three
responses: (i) total n-3 fatty acids in fish (mg g–1 of total
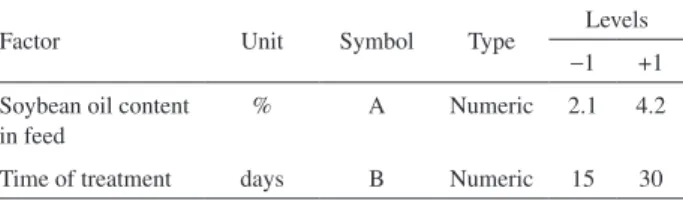
lipids); (ii) n-6/n-3 ratio; and (iii) PUFA/SFA ratio. Soybean oil content in feed diet [A] (2.1 and 4.2%) and time of treatment [B] (15 and 30 days) were the independent variables applied to experimental design (Table 2). All experiments were made in triplicate and carried out randomly.
Statistical analysis
Model fit quality was evaluated by variance analysis and determination of coefficients. The homogeneity and normality of residuals was conducted by Shapiro-Wilk
test15 and confirmed by Jarque-Bera test,16 using R
package software, version 3.1.1. Values of the main effects, interaction and analysis of variance (ANOVA) were obtained using Design-Expert software version 6.0.5 (USA). ANOVA was performed for all responses. Means of diet composition were compared by t test using Statistica software version 8.0 (USA). The significance level used for rejection of the null hypothesis was 5% (p < 0.05).
Results and Discussion
Proximate and lipid composition of supplemented feed diets were compared in Table 1 by t test at 5% of significance (p < 0.05). Results were significantly different especially in relation to total lipid content and lipid composition. As expected, the supplemented feed diet containing 4.2% of soybean oil (TII) showed a higher value of total lipids (6.95 g 100 g−1) compared to feed diet containing 2.1% of
soybean oil (TI) (5.09 g 100 g–1). As well, higher contents
of saturated fatty acids (SFA), monounsaturated fatty acids (MUFA) and polyunsaturated fatty acids (PUFA) were determined in TII. PUFA such as n-6 and n-3 fatty acids were lower in TI. Both ratios, n-6/n-3 and PUFA/SFA, were statistically the same (p < 0.05) between TI and TII. Values of inputs [soybean oil content in the diet (%) and time of treatment (days)] used in 12 assays and responses obtained for each experiment (n-3 fatty acids, n-6/n-3 ratio and PUFA/SFA ratio) followed by responses average and random errors are shown in Table 3.
All studied responses were submitted to multiple regression analysis and, among the models which were indicated by the software (linear, two factor interaction (2FI), polynomial quadratic and cubic), the 2FI one was selected as the most adequate for total n-3 fatty acids and n-6/n-3 ratio, while PUFA/SFA ratio was adjusted in a better manner on the linear model. Respective models were chosen because they possessed a high significance order.
Figure 1 presents residuals versus normal probability plots. Graphical analysis of residuals is a very effective way to investigate the adequacy of regression model fit and to check the underlying assumptions. The graph of normal probability was designed in order to plot the cumulative normal distribution as a straight line, allowing
Table 2. Factors and levels used in the 22 factorial design
Factor Unit Symbol Type Levels
−1 +1 Soybean oil content
in feed
% A Numeric 2.1 4.2
its visual evaluation.17 The residuals plots (Figure 1) appear
satisfactory and there was no reason to suspect that there are
any problems regarding validity of the conclusions. On the other hand, these plots are very basic and can be criticized in a number of ways because they cannot show up defects of specific types.18 In this case, tests for sophisticated
analyses of residuals are preferred. The Shapiro-Wilk and Jarque-Bera tests were employed to confirm the homogeneity and normality of residuals.
The Shapiro-Wilk test aims to evaluate the normality in statistics. The null-hypothesis (H0) of this test is that the
population is normally distributed. Thus, if the p-value is less than the chosen alpha level, then the H0 is rejected and
there is evidence that the tested data tested are not from a normally distributed population. On the contrary, if the p-value is greater than the chosen alpha level, then the H0
cannot be rejected. A Q-Q plot is required for additional checks to this test.15
Table 3. 22 factorial design, responses in triplicate and average followed
by random error
Assay
Soybean oil content in
feed / %
Time of treatment /
days
Response Average Random error
n-3 fatty acids (mg g–1 of total lipids) response
1 2.1 15
26.60
25.70 0.90
23.67 −2.03
26.83 1.13
2 4.2 15
27.03
27.96
−0.93
26.97 −0.99
29.89 1.93
3 2.1 30
36.09
32.37 3.72
30.82 −1.55
30.19 −2.18
4 4.2 30
42.98
44.43
−1.45
43.76 −0.67
46.56 2.13
n-6/n-3 ratio response
5 2.1 15
9.55
9.43
0.12
9.22 −0.21
9.53 0.10
6 4.2 15
8.8
8.75
0.05
8.95 0.20
8.50 −0.25
7 2.1 30
7.42
8.06
−0.64
8.22 0.16
8.54 0.48
8 4.2 30
6.69
6.38
0.31
6.43 0.05
6.03 −0.35
PUFA/SFA ratio response
9 2.1 15
1.34
1.25
0.09
1.08 −0.17
1.34 0.09
10 4.2 15
1.33
1.40
−0.07
1.33 −0.07
1.55 0.15
11 2.1 30
1.49
1.42
0.07
1.37 −0.05
1.40 −0.02
12 4.2 30
1.83
1.80
0.03
1.80 0.00
1.77 −0.03
The Jarque-Bera test is used to check a hypothesis about the fact that a given sample Xs is of normal random
variable with unknown mean and dispersion. As a general rule, this test is applied before using methods of parametric statistics, which requires distribution normality. This test is based on the fact that skewness and kurtosis of normal distribution are equal to zero.16
The homogeneity of residuals for total n-3 fatty acids response, conducted by Shapiro-Wilk test, showed evidence for asserting that the residuals are normally distributed (w = 0.9093; p-value = 0.2087). Jarque-Bera test confirmed the normality (X2 = 1.0912, df = 2, p-value = 0.5795), at
5% of significance.
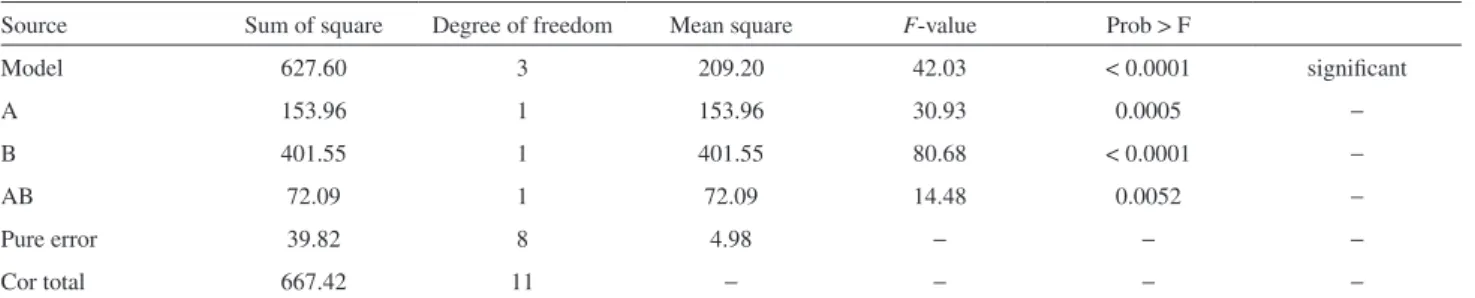
For total n-3 response, the mathematical model proposed by software was significant (F-value = 42.03) and there is only 0.01% chance that a model with an F-value this large could occur due to noise. Variance analysis at 5% significance (p < 0.05) showed that the two-factor interaction (2FI) model proposed was predictive for n-3 fatty acids response.
The statistical significance of the model was also confirmed by its determination coefficient (R 2 = 0.9403)
which implies that only 5.97% of the response variability was not explained by the model. The coefficient of determination (R2) measures the proportion of total
variability explained by the model, i.e., provides a measure of how well observed outcomes are replicated by the model. Furthermore, R2 adjusted value was slightly lower than the
coefficient of determination, indicating that the terms which were included in the model are significant enough to make acceptable predictions (Table 4).
Main effects are shown in Figure 2a. Graphical effects plots presented the normal line, where the points have no significance. The factors and interactions points are significant to the model when the positions of the points are further from the normal line. For n-3 response, no lack of fit was observed and both factors, A and B, and interaction AB as well, were significant.
The response surface obtained for levels and independent variables for n-3 response is shown in Figure 2d, where is
possible to note the increase of n-3 fatty acids content in fish after 30 days of treatment with diet containing 4.2% soybean oil. Therefore, this was a suitable model for predicting the incorporation of n-3 fatty acids in tilapia lipids in the conditions investigated. The predicted values of n-3 response of these conditions using equation 2 were given together with the experimental data in Table 3.
Response n – 3 (mg g–1) = 26.58 – 3.59 × A – 0.21 × B +
0.31 × AB (2)
where A: soybean oil content in feed diet (%), B: time of treatment (days), AB: interaction (product) between A and B. Results published recently showed low levels of n-3 fatty acids in farm-raised freshwater fish.6 In fact,
researches have been conducted focusing on increasing n-3 fatty acids contents in farmed tilapia through feed diets, which were supplemented with vegetables sources of alpha-linolenic acid, such as linseed, chia and perilla.4,5,19
The results for n-3 fatty acids in tilapia presented in this work (from 23 to 47 mg g−1 of total lipids) are similar to
results published by Silva et al.,5 from 28 to 43 (mg g–1 of
total lipids) in tilapia fed with supplemented diet containing soybean oil at 1.9% (m/m).
As expected, the increase of n-3 fatty acids in fish led to a decrease in the n-6/n-3 ratio. In actual Western diets, the ingestion of n-3 fatty acids is highly desirable to regulate the intake of n-6 fatty acids, consecutively, reduce the risk of cardiovascular diseases.9 In the present study, it was
observed that the high content of soybean oil (4.2%) in the diet during 30 days reduced the n-6/n-3 ratio in tilapia from 9.5 to 6.0 (Figure 2e). Even so, such decreased value is not equal to the n-6/n-3 values for wild freshwater fish, which were reported by Carbonera et al.6 (from 1.0 to 4.0).
Moreover, the same data pointed high values of n-6/n-3 ratio (> 4.0) in relation to farm-raised freshwater fish.
Table 5 shows the ANOVA at 95% of confidence for n-6/n-3 response. Previously, residual analysis was conducted by the tests of Shapiro-Wilk and Jarque-Bera.
Table 4. ANOVA for factorial analysis: total n-3 fatty acids
Source Sum of square Degree of freedom Mean square F-value Prob > F
Model 627.60 3 209.20 42.03 < 0.0001 significant
A 153.96 1 153.96 30.93 0.0005 −
B 401.55 1 401.55 80.68 < 0.0001 −
AB 72.09 1 72.09 14.48 0.0052 −
Pure error 39.82 8 4.98 − − −
Cor total 667.42 11 − − − −
Standard deviation = 2.23; R2= 0.9403; R2(adjusted) = 0.9180. A = soybean oil content in feed (%); B = time of treatment (days); AB = interaction between
Both tests (Shapiro-Wilk: w = 0.9534, p-value = 0.6875; Jarque-Bera: X2 = 0.6756, df = 2, p-value = 0.7133) showed
the homogeneity of variance and normality of the residuals at 5% of significance.
ANOVA also indicated a significant and well-adjusted model (F-value = 38.17) for the n-6/n-3 response. The determination coefficient was 0.9347, i.e., around 93% of
the data can be explained by the model. Thus, the 2FI model proposed by the software can be considered predictive (R2adjusted = 0.9102) for n-6/n-3 ratio in tilapia submitted
to experimental conditions. The variables A and B and the interaction AB were significant factors (Figure 2b). The mathematical model obtained from data of Table 3 was described by equation 3.
Response n – 6/n – 3 = 10.50 + 0.15 × A – 0.025 × B –
0. 31 × AB (3)
where A: soybean oil content in feed diet (%), B: time of treatment (days), AB: interaction (product) between A and B.
Residuals from the linear model for PUFA/SFA ratio were also analyzed by conclusive tests of Shapiro-Wilk and Jarque-Bera. Shapiro-Wilk test showed evidence of homogeneity (w = 0.9750, p-value = 0.9554) and Jarque-Bera confirmed the normality of residuals (X2 = 0.1947,
df = 2, p-value = 0.9073) at 5% of significance. The model F-value of 15.49 implied that the model was significant, which means that there is only a 0.12% chance that a model with an F-value this large could occur due to noise. However, the coefficient of determination presented a not high value (R2= 0.7749) (Table 6). In other words, 77%
of the data was explained to the linear model and 72% of the data can be adjusted (R2 = 0.7249).
Data was better fitted to linear model and factors A and B were significant. The interaction AB was not significant and the graphical plots to effects (Figure 2c) showed the AB point near to normal line. As shown in Figure 2c, the AB effect was normally distributed with a mean close to zero, and the point followed the straight line in the graph, whereas the significant effects A and B did not follow the
line. Therefore, the interaction factor AB did not have statistical significance.
The retention of A and B to describe the linear model for PUFA/SFA was demonstrated through equation 4.
Response PUFA/SFA = 0.654 + 0.126 × A +
0.0186 × B (4)
where A: soybean oil content in feed diet (%) and B: time of treatment (days).
The lack of fit associated to the elimination of AB factor was F = 0.0966. This was lower if compared to tabulated F-value = 3.45. On the other hand, the lack of fit F-value = 3.54 implies there is a 9.66% chance that it could occur due to noise; therefore, the lack of fit of the linear model for PUFA/SFA was bad. However, if the AB interaction was maintained, the 2FI model would not be signifcant (F-value of model = 0.0966) at 95% of confidence.
Response surface (Figure 2f) obtained for PUFA/SFA ratio in fish demonstrated that the values were increased after 30 days of treatment with diet containing 4.2 % of soybean oil. All results for PUFA/SFA (Table 3) were greater than 0.45 and, therefore, are considered healthy to human nutrition8.
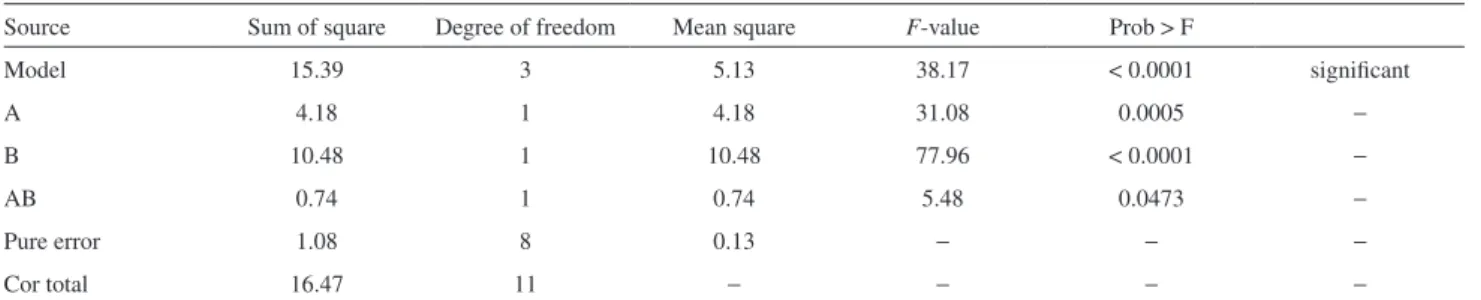
Table 5. ANOVA for factorial analysis: n-6/n-3 ratio
Source Sum of square Degree of freedom Mean square F-value Prob > F
Model 15.39 3 5.13 38.17 < 0.0001 significant
A 4.18 1 4.18 31.08 0.0005 −
B 10.48 1 10.48 77.96 < 0.0001 −
AB 0.74 1 0.74 5.48 0.0473 −
Pure error 1.08 8 0.13 − − −
Cor total 16.47 11 − − − −
Standard deviation = 0.37; R2= 0.9347; R2 (adjusted) = 0.9102. A = soybean oil content in feed (%); B = time of treatment (days); AB = interaction between
oil content and time of treatment.
Table 6. ANOVA for factorial analysis: PUFA/SFA
Source Sum of square Degree of freedom Mean square F-value Prob > F
Model 0.44 2 0.22 15.49 0.0012 significant
A 0.21 1 0.21 14.59 0.0041 −
B 0.23 1 0.23 16.40 0.0029 −
Residual 0.13 9 0.014 − − −
Lack of fit 0.040 1 0.040 3.54 0.0966 not significant
Pure error 0.089 8 0.011 − − −
Cor total 0.57 11 − − − −
Standard deviation = 0.12; R2 = 0.7749; R2 (adjusted) = 0.7249. A = soybean oil content in feed (%); B = time of treatment (days); AB = interaction between
Conclusion
The factorial designs which were carried out in order to investigate the amount of n-3 fatty acids, PUFA/SFA and n-6/n-3 ratios in lipids of Nile tilapia showed significant mathematical models in terms of the studied factors: soybean oil content in feed diet and time of treatment for Nile tilapia. Both factors were significant contributors to the increase of total n-3 fatty acids contents along time and to reduce n-6/n-3 and PUFA/SFA ratios. Due to the significance of the mathematical models obtained in this study, predictions or information about described conditions involved the factors “soybean oil content in ration” and “treatment time” can be estimated. The sample which showed the best lipid quality (related with high contents of n-3 fatty acids, low n-6/n-3 ratio and high PUFA/SFA ratio) was the Nile tilapia submitted to feed diet containing 4.2% of soybean oil for 30 days.
Acknowledgments
The authors are grateful to CAPES and CNPq agencies and UTFPR (Apucarana).
References
1. Costa, L. M.; Kom, M. G. A.; Castro, J. T.; Santos, W. P. C.; Carvalho, E. V.; Nogueira, A. R. A.; Quím. Nova2006, 29, 149. 2. http://www.icmbio.gov.br/cepsul/images/stories/biblioteca/ download/estatistica/est_2011_bol__bra.pdf accessed in January 2015.
3. Food and Agriculture Organization of United Nations (FAO); The State of World Fisheries and Aquaculture 2012, http://www.
fao.org/docrep/016/i2727e/i2727e.pdf accessed in January 2015.
4. Carbonera, F.; Bonafe, E. G.; Martin, C. A.; Montanher, P. F.; Ribeiro, R. P.; Figueiredo, L. C.; Almeida, V. C.; Visentainer, J. V.; Food Chem. 2014, 148, 230.
5. Silva, B. C.; Santos, H. M. C.; Montanher, P. F.; Boeing, J. S.; Almeida, V. C.; Visentainer, J. V.; J. Am. Oil Chem. Soc. 2014, 91, 429.
6. Carbonera, F.; Santos, H. M. C.; Montanher, P. F.; Schneider, V. V. A.; Lopes, A. P.; Visentainer, J. V.; Eur. J. Lipid Sci. Technol. 2014, 116, 1363.
7. http://portal.anvisa.gov.br/wps/wcm/connect/a2190900474588 939242d63fbc4c6735/RDC_482_1999.pdf?MOD=AJPERES accessed in January 2015.
8. Department of Health and Social Security; Diet and Cardiovascular Disease: Report on Health and Social Subjects,
No. 28; HMSO, London, 1984.
9. Simopoulos, A. P.; Biomed. Pharmacother. 2002, 56, 365. 10. Bligh, E. G.; Dyer, W. J.; Can. J. Biochem. Physiol. 1959, 37,
911.
11. Hartman, L.; Lago, R. C.; Lab. Pract. 1973, 22, 475. 12. Maia, E. L.; Rodriguez-Amaya, D. B.; Rev. Inst. Adolfo Lutz
1993, 53, 27.
13. Joseph, J. D.; Ackman, R. G.; J. AOAC Int. 1992, 75, 488. 14. Visentainer, J. V.; Quím. Nova2012, 35, 274.
15. Shapiro, S. S.; Wilk, M. B.; Biometrika 1965, 52, 591. 16. Jarque, C. M.; Bera, A. K.; Int. Stat. Rev. 1987, 55, 163. 17. Montgomery, D. C.; Peck, E. A.; Vining, G. G.; Introduction to
Linear Regression Analysis, 3rd ed.; Wiley: New York, 2001.
18. Draper, N. R.; Smith, H.; Applied Regression Analysis, 3rd ed.;
Wiley: New York, 1998.
19. Visentainer, J. V.; Souza, N. E.; Matsushita, M.; Hayashi, C.; Franco, M. R. B.; Food Chem. 2005, 90, 557.
Submitted: August 29, 2014
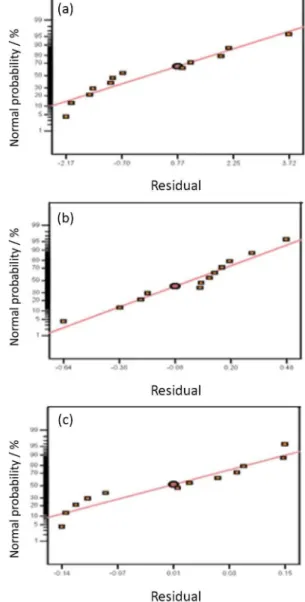
![Figure 2. Normal probability plots (a, b and c) for effects [A = soybean oil content in diet (%); B = time of treatment (days); AB = interaction between factors A and B] of factorial design; response surfaces (d, e and f) for: total n-3 fatty acids; n-6/n](https://thumb-eu.123doks.com/thumbv2/123dok_br/18999536.463293/6.892.138.793.103.915/figure-normal-probability-treatment-interaction-factorial-response-surfaces.webp)