*Correspondence: M. P. D. Gremião and Marlus Chorilli. Faculdade de Ciências Farmacêuticas, Universidade Estadual Prof. Júlio de Mesquita Filho - UNESP. Rodovia Araraquara-Jaú, km. 01, 14801-902 - Araraquara - SP, Brasil. E-mail: pgremiao@fcfar.unesp.br; chorilli@fcfar.unesp.br
A
vol. 50, n. 2, apr./jun., 2014 http://dx.doi.org/10.1590/S1984-82502014000200018
Validation of high-performance liquid chromatographic method for
analysis of fluconazole in microemulsions and liquid crystals
Hilris Rocha e Silva
1, Fernanda Kolenyak dos Santos
1, Gabriela Marielli da Luz
1, Marlus Chorilli
1,*,
Maria Palmira Dalon Gremião
1,*1Departament of Drugs and Medicines, School of Pharmaceutical Sciences, University of State of São Paulo “Júlio de
Mesquita Filho”, Araraquara, SP, Brazil
In recent decades, there has been a signiicant increase in the incidence of fungal diseases. Certain fungal diseases cause cutaneous lesions and in the usual treatment, generally administred orally, the drug reaches the site of action with dificulty and its concentration is too low. An approach much explored in recent years is the development of nanotechnology-based drug delivery systems, and microemulsions (ME) and liquid crystals (LC) are promising. ME and LC were developed with oleic acid or copaiba oil as the oil phase, propoxyl (5OP) ethoxyl (20 OE) cetyl alcohol as surfactant and water. An analytical method to assess the incorporation of luconazole (FLU) in the systems under study was validated according to guidelines of the International Conference on Harmonization (ICH) guidelines and the Brazilian Food, Drug and Sanitation Agency (ANVISA). The method was conducted on a C18-RP column (250 × 4.6 mm i.d.), maintained at room temperature. The mobile phase consisted of acetonitrile and water (50:50, v/v), run at a low rate of 1.0mL/min and using ultraviolet detection at 210nm. The chromatographic separation was obtained with a retention time of 6.3min, and was linear in the range of 20-400 µg/mL (r2=0.9999).
The speciicity showed no interference of the excipients. The accuracy was 100.76%. The limits of detection and quantitation were 0.057 and 0.172 µg.mL-1, respectively. Moreover, method validation
demonstrated satisfactory results for precision and robustness. The proposed method was applied for the analysis of the incorporation of FLU in ME and LC, contributing to improve the quality control and to assure the therapeutic eficacy.
Uniterms: Nanotehcnology. Microemulsions. Liquid crystals. High-performance liquid chromatography/
qualitative analysis. Fluconazole.
Nas últimas décadas, houve aumento signiicativo na incidência de doenças fúngicas. Certas doenças fúngicas provocam lesões cutâneas, sendo que no tratamento usual, geralmente administrado por via oral, o medicamento chega ao local de ação com diiculdade, em concentração muito baixa. Uma abordagem muito explorada nos últimos anos é o desenvolvimento de sistemas de administração de fármacos baseados em nanotecnologia, como as microemulsões (ME) e cristais líquidos (LC). ME e LC foram desenvolvidos com o ácido oleico ou óleo de copaíba como fase oleosa, álcool cetílico propoxilado (5 OP) e etoxilado (20 OE) como tensoativo e água. Método analítico para avaliar a incorporação de luconazol (FLU) nos sistemas em estudo foi validado de acordo com as diretrizes da Conferência Internacional de Harmonização (ICH) e Agência Nacional de Vigilância Sanitária (ANVISA). O método foi desenvolvido empregando coluna C18-RP (250 x 4,6 mm id), mantida à temperatura ambiente. A fase móvel consistiu de acetonitrila e água (50:50, v/v), executado a uma taxa de luxo de 1,0 mL/min e com detecção ultravioleta a 210 nm. A separação cromatográica foi obtida com o tempo de retenção de 6,3min, e mostrou-se linear no intervalo de 20-400 µg/mL (r2=0,9999). Pelo estudo de especiicidade, observou-se não interferência dos
excipientes. A precisão foi 100,76%. Os limites de detecção e de quantiicação foram 0,057 e 0,172 µg.mL-1,
respectivamente. Além disso, a validação do método demonstrou resultados satisfatórios para a precisão e robustez. O método proposto foi aplicado para a análise da incorporação do FLU em ME e cristais líquidos, contribuindo para aumentar o controle de qualidade e garantir a eicácia terapêutica.
INTRODUCTION
Fungal infections are considered a major problem
for public health. A signiicant group of such infections
are the dermatomycoses, involving the skin, especially the stratum corneum, and appendages such as nails, hair and mucous membranes (oral and vaginal) (Negroni, 2010;
Erchiga, Fiorencio, 2005; Bachhav, Patrale, 2009). Fluconazole – FLU (Figure 1) is a white, slightly
soluble in water, soluble in ethanol, methanol and acetone and very slightly soluble in toluene. The presence of two
triazole rings in its structure is responsible for its reduced
lipophilicity (Dash, Elmquist, 2001). Its mechanism of
action, like that of the other azoles, is related to its ability
to alter the membrane permeability of yeasts and other fungi by inhibiting the synthesis of ergosterol. Inhibition
of P-450 lanosterol 14-alpha-demethylase dependent
causes accumulation of sterols methylated depletion ergosterol and inhibition of cell growth (Alnaim et al.,
2007; Jovanović et al., 2005; Pore et al., 2006).
Given the growing cost of fungal infections to the public health system, and highlighting the important role of
azole antifungal agents, it is necessary to seek alternative
administration route for these drugs in the treatment of fungal diseases, so as to increase their bioavailability efficiency and thus their therapeutic and to provide clinicians and patients with a greater diversity of treatment.
Strategies currently being investigated to overcome these limitations include the design and the development
of drug delivery systems that can improve the eficacy of existing drugs. Topical drug delivery systems may
contribute to the enhancement of the current antifungal therapy. Nanotechnology-based drug delivery systems such as liposomes, solid lipid nanoparticles, micro and nanoparticles, microemulsions (ME) and liquid crystals
(LC) can modify the drug release proile, improve drug
stability, increase the residence time of the drug at the
site of action and the ready solubilization of drugs in
these materials (Gupta, Vyas, 2012; El-Nesr et al., 2010; Gabboun et al., 2001; Peira et al., 2001).
ME are thermodynamically stable systems and isotropic systems, composed of an oil phase, an aqueous
phase and a surfactant and/or co-surfactant, their properties facilitate the solubilization of lipophilic drugs, enabling
their incorporation, if desired, at concentrations higher than that required at the target (Wei et al., 2012; Warisnoicharoen
et al., 2000; Holmberg et al., 2002; Kreilgaard, 2002). The interaction of the drug with the system also provides controlled drug release and targeting of the site of action; ME are a type of formulation that can increase penetration through the stratum corneum (Huang et al., 2008; Alvarez-Figuereo, Blanco-Méndez, 2001). This can occur by the
following mechanisms: the composition and structure of these systems allow greater quantities of drug to be incorporated than other, conventional, topical formulations such as lotions, creams and gels. It can increase the solubility of drugs poorly soluble in water, via the oil phase, it can enhance drug stability, modify the diffusion barrier of the skin and promote drug release into the skin, without
leading to signiicant irreversible changes in the skin barrier
function (Baroli et al., 2000; Hoeller et al., 2008; Heuschkel
et al., 2008).
LC are thermodynamically stable, optically isotropic, transparent and condensed structures that are both solid and liquid; thus, they are also known as mesophases (Mainardes
et al., 2011; Formariz et al., 2005; Müller-Goymann, 2004).
These systems combine the properties of both liquid and solid states and can be formed from the addition of solvents
(Müller-Goymann, 2004). Their stability can be checked
by varying the temperature (thermotropic liquid crystals) (Chorilli et al., 2011). The types of liquid crystals that can
be formed are (liquid crystal) lamellar, hexagonal or cubic
phases (Alam, Shrestha, Aramaki, 2009). The lamellar phase is formed by parallel layers of surfactant, aqueous and oil phases, which form one-dimensional networks. In
the hexagonal phase, cylinders of surfactant molecules are
formed and the oil phase may be present either inside the cylinders or in the continuous phase of the system. The cubic phase is the most viscous and has been observed mainly in
water/surfactant or surfactant-like lipid systems or water/ surfactant/oil ternary systems (Alam, Shrestha, Aramaki, 2009). Some authors have experimented with four different organizational arrangements of lamellar liquid crystal
phases and three different arrangements of the cubic phases (Mannock et al., 2007; Chorilli et al., 2011).
LC-based drug delivery systems have been shown to increase the permeation of drugs because of the high concentrations of surfactants. The surfactants are able
to destabilize the lipid layer of the skin, forming small
pores in this structure (Kreilgaard, 2002). Höller, Valenta
permeation of several drugs from LC of the cubic phase, including FLU. The results showed that the incorporation of FLU in the system did not alter the rheological behavior of the formulation, and the drug was retained longer in the skin after skin permeation test.
Analytical methods employed in the quantitative determination of drug delivery systems play an important role in the assessment of pharmaceutical preparations, HPLC being the most frequently used method. To guarantee the quality of commercial products, the development and validation of analytical methods are crucial for the pharmaceutical industry (Apostol et al., 2012). The methods for quantitation and detection must be robust, precise and rapid and are essential in the development, process monitoring and quality control of pharmaceuticals. Analytical validation is necessary for the routine quality control of products, so that reliable results
can be satisfactorily interpreted (Shabir, 2003; ICH-Q2B, 2005).
The validation of an analytical methodology is useful to demonstrate that the method is suitable for its intended purpose, to guarantee that every future measurement will be close enough to the unknown true value, for the content range of the analyte in the sample, and to ensure that the method meets the requirements of analytical methods, producing reliable results (Carvalho
et al., 2009; Cinto et al., 2009). Assays based on HPLC are very commonly used to measure the quality of drugs and, according to ICH, certain parameters must be checked
to validate the analytical method: linearity, speciicity,
accuracy, precision (inter and intraday), limit of detection
(LOD), limit of quantitation (LOQ) and robustness (ICH-Q2B, 2005; González, Herrador, 2007; Hofer et al., 2007).
Sasongko et al. (2003) developed a method that
used HPLC to assay in a form taken FLU orally. Ayub et al. (2007) developed and validated an assay to measure
the permeation of FLU from emulsions applied to the skin. Bachhav, Patravale (2009) validated a method of assaying FLU in released from microemulsions for vaginal use. However, no methodology has been developed to quantify
luconazole incorporated into ME or LC for cutaneous
administration.
In light of this, the aim of this work was to validate an analytical methodology by HPLC to determine the amount of FLU incorporated in ME and LC.
MATERIAL AND METHODS
Equipment
The equipment used was a Varian HPLC with a
ProStar 330 UV-VIS PDA detector and Rheodyne VS 125
injector with a Varian ProStar® 410 autosample.
Chemicals
To formulate the ME, two copaiba oil were utilized, first copaiba oil (CO) was bought from cooperative in Brazil, the second from Sigma (OS). Fluconazole was
purchased from Purifarmaand oleic acid (OA) from Synth.
Propoxyl (5OP) ethoxyl (20 OE) cetyl alcohol (PROC, Croda) was used as surfactant and the water was puriied with a Milli Q Plus.
Development of microemulsion (ME) and liquid crystal (LC) to incorporation of FLU
In order to investigate the ME and LC regions, a ternary phases diagram was constructed, containing as oil
phase copaiba oil obtained of cooperatives of Acre (Brazil) (CO), copaiba oil purchased from Sigma (OS) or oleic acid (OA). The second component was the surfactant propoxyl (5OP) ethoxyl (20 OE) cetyl alcohol (PROC) and the third was water. A ixed concentration of FLU (1%) was
used. The compositions chosen for of the nanostructured systems are shown in Table I.
Incorporation of FLU in formulations
The capacity of formulations to incorporate FLU
was investigated by adding an excess of FLU powder (100 mg/g) to the formulations being tested. After shaking for 48 h at 25 ± 0.1 oC, samples were centrifuged at 360 g for 20 min (Du Pont-Sorvall TC 6 centrifuge), to eliminate
undissolved FLU. The supernatants were diluted with mobile phase and the FLU dissolved in it was measured by HPLC method.
Method validation
The analytical method was validated by HPLC, to
determine the following parameters: linearity, speciicity,
accuracy, inter and intraday precision, limit of detection
(LOD), limit of quantitation (LOQ) and robustness,
following the guidelines of the International Conference
on Harmonization (ICH) guidelines (ICH-Q2B, 2005) and the Brazilian Food, Drug and Sanitation Agency (ANVISA) (Brasil, 2003).
Linearity
In order to assess the validity of the assay, 100
(mobile phase) in 100 mL volumetric lask (1 mg.mL-1).
Appropriate aliquots of this solution were diluted with the mobile phase, yielding concentrations of 20.0,
40.0, 50.0, 100.0, 150.0, 200.0, 250.0, 300.0, 350.0 and 400.0 µg.mL- 1. Tr i p l i c a t e p r e p a r a t i o n s o f e a c h
concentration were performed. The results were subjected to regression analysis by a least-squares method to calculate the calibration equation and determination
coeficient.
Specificity
The speciicity was determined by measuring the
total purity of the chromatographic peaks in samples
of phosphate buffer pH 7.4 containing FLU in the concentration at 150 µg.mL-1 and in the formulations containing oleic acid (OA), copaiba oil (CO) bought locally or from Sigma (OS), respectively, with or without
FLU. This assay was performed in triplicate.
Precision
Precision data for this validation were determined
as recommended by ICH-Q2B (2005). Repeatability was
calculated by assaying samples of 20.0, 200.0 and 400.0 mg mL1 intra- and inter-day in three different days; results must be less than 5%. The RSD of peak areas (n = 3) was
evaluated.
Accuracy
To conirm the accuracy of the proposed method, a sample of luconazole working solution was prepared
in triplicate at three different concentrations, 20, 40 and
200 µg.mL-1, within the analytical curve.
Limit of detection (LOD), limit of quantitation (LOQ) To determine the LOD and LOQ, three analytical
curves were prepared at concentrations near the presumed
LOQ. The LOD and LOQ were calculated from equations (1) and (2) as described by IHC-Q2B (2005).
LOD= 3 (S.D ./a) (1)
LOQ = 10(S.D ./a) (2)
where S.D is the standard deviation of the y-intercepts and S is the slope of the calibration curve.
Robustness
Robustness was assessed against the intervention of some variables related to quantitation and recovery of the
drug like column (Phenomenex and Varian), HPLC (Varian
and HP) and detector (DAD and UV). The chromatographic parameters monitored were capacity factor, tailing factor (peak symmetry) and theoretical plates.
Statistical analysis
The ANOVA and Tukey tests were carried out using the BioEstat 5.0 software. Statistical relevance was assumed at p < 0.05.
RESULTS AND DISCUSSION
Method validation
Linearity
Fluconazole eluted from the column was analyzed in
the mobile phase (acetonitrile and water 1:1) by measuring
TABLE I - Composition (%) of the formulations for the physical system
Components Samples
Oil phase
(CO, OS or OA) Surfactant Aqueous phase LC or ME
CO1
20 40 40
LC hexagonal
OS1 LC hexagonal
OA1 LC lamelar
CO2
30 40 30
LC lamelar
OS2 LC hexagonal
OA2 LC lamelar
CO3
40 40 20
LC lamelar
OS3 LC lamelar
OA3 ME
CO4
50 40 10
ME
OS4 ME
absorbance at 210 nm, and the area under the peak was calculated. The analytical curve was obtained by averaging three curves and performing in triplicate for each dilution curve.
The method was evaluated by the determination
coeficient and intercept, calculated in the corresponding statistical study (ANOVA; p<0.05). The curve showed a
good linearity at these concentrations, the mean (RSD)
slope and y-intercept being 0.0005 and 0.0012, with a determination coeficient (r2) of 0.9999. R2 values > 0.999 and intercepts very close to zero confirmed the good linearity of the method (Brasil, 2003).
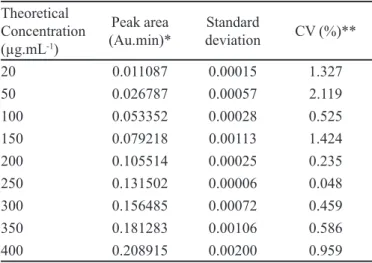
It can be seen that the coefficient of variation
between the samples was less than 2.119% (Table II), fulilling ANVISA requirement of lower than 5% in these analyses (Brasil, 2003).
Precision
Tests of repeatability (intra-day) and intermediate (inter-day), precision were carried out at three
concentration levels, begin low (20 µg.mL-1), medium (200 µg.mL-1) and high (400 µg.mL-1). Table III shows
the results for repeatability.
In the repeatability test, the CV among samples
was calculated and the highest 1%, for the lowest
concentration. This is an acceptable value. According to
ANVISA and ICH the CV must not exceed 5% in these assays, as in the test of linearity (ICH-Q2B, 2005; Brasil, 2003). In Table IV, the results of the inter-day precision
test, done on three consecutive days, are shown.
Again, the values of coefficient of variation are
within the ANVISA and ICH limit of 5% (ICH-Q2B, 2005; Brasil, 2003). Therefore, the analytical method was suficiently precise in both tests.
Accuracy
I n o r d e r t o c h e c k t h e a c c u r a c y, t h e s a m e concentrations as in the precision test were used and the
results were analyzed as percent recovery of the sample.
The results are shown in Table V.
TABLE II - Data used to evaluate the linearity
Theoretical Concentration (µg.mL-1)
Peak area (Au.min)*
Standard
deviation CV (%)**
20 0.011087 0.00015 1.327
50 0.026787 0.00057 2.119
100 0.053352 0.00028 0.525
150 0.079218 0.00113 1.424
200 0.105514 0.00025 0.235
250 0.131502 0.00006 0.048
300 0.156485 0.00072 0.459
350 0.181283 0.00106 0.586
400 0.208915 0.00200 0.959
*Average of three curves. **CV-coefficient of variation, calculated from the mean and standard deviation of the areas obtained.
TABLE III - Results from the repeatability (intra-day precision) test
Theoretical Concentration (µg.mL-1)
Area* Standard
deviation CV (%)
20 0.01096 1.09801.10-4 1.00162
200 0.10386 2.34862.10-4 0.22612
400 0.20392 1.58324.10-4 0.77639
*Average of three values. CV: coeficient of variation.
TABLE IV - Results from the intermediate precision test
Theoretical Concentration (µg.mL-1)
Area* Standard
deviation
CV (%)
20 0.01104 1.29853.10-4 1.17604
200 0.10484 a8.48326.10-4 0.80914
400 0.20776 3.42698.10-3 1.64952
*Average of three values. CV, coeficient of variation.
TABLE V - Results for accuracy
Theoretical Concentration
(µg.mL-1) Area* Standard deviation CV (%) Rec (%)
20 0.01111 7.51022.10-5 0.67589 99.12
200 0.10317 7.71213.10-4 0.74755 101.97
400 0.20362 1.20190.10-4 0.59026 101.21
The percent recovery values are shown in Table VI
and they were all found to be between 99 and 102%. The
results are well within the interval of recovery values
approved by ANVISA, namely 80-120%. Moreover, the CV was less that 1%, being greatest at a concentration of 200 µg.mL-1. The values coeficient of variation are thus ANVISA and ICH limit of 5% (ICH-Q2B, 2005; Brasil, 2003).
Limits of detection (LOD) and quantitation (LOQ)
The detection limit is the smallest amount of the
analyte that can be detected but not necessarily quantiied,
while the limit of quantitation is the smallest content of the
analyte that can be analyzed with accuracy and precision (ICH-Q2B, 2005). The values of LOD and LOQ were 0.057 and 0.172 µg.mL-1,respectively, indicating the excellent sensitivity of the analytical method.
Specificity and Selectivity
Figure 2 shows the chromatogram of a single injection of buffer containing FLU. It can be seen that the buffer did not interfere with in the analysis, as it did not affect the drug peak region. This assay was performed in triplicate.
The analysis of the formulations containing
luconazole (Figure 3) also showed no interference in the
drug peak region.
TABLE VI - Content of luconazole determined the formulations
Sample Sample mass (g) Peak* CC luconazole (µg.mL-1
)* SD CV (%) Content (mg/g)*
OA1 0.0656 0.08134 160.28 1.58 0.99 24.43
OA2 0.0577 0.0772 152.00 1.53 1.00 26.34
OA3 0.0500 0.07565 148.90 2.50 1.68 29.78
OA4 0.0576 0.07690 151.40 2.10 2.08 26.28
CO1 0.1074 0.07902 155.64 0.70 0.45 14.49
CO2 0.1073 0.07849 154.58 2.65 2.57 14.41
CO3 0.0836 0.07956 156.72 1.72 1.10 18.75
CO4 0.0838 0.08036 158.32 1.89 1.19 18.89
OS1 0.1250 0.07561 148.82 1.96 1.32 11.90
OS2 0.1254 0.07901 155.62 2.81 1.80 12.41
OS3 0.1251 0.07637 150.34 2.19 1.45 12.02
OS4 0.1250 0.07307 143.74 0.80 0.56 11.50
*Average of three values. CC - calculated concentration, SD - standard deviation, CV- Coeficient of variation.
FIGURE 3 - Chromatogram solution of selected formulations containing FLU (150μg.mL-1).
The specificity of an analytical method can be assessed by determining the chromatographic peak purity
using a diode array detector (Brasil, 2003), which shows
graphically and numerically the similarity of the spectrum of the peak of the substance of interest. The results indicate
purity index of 0.99 in both cases, indicating the similarity
of the peaks, that is, the chromatographic peak refers to the substance of interest, without interference.
Robustness
In this assay, the interference of certain parameters in the analytical results was assessed. It was found that changing the column make, type of HPLC or detector did not interference with the peak retention time or the drug recovery. The system suitability method acceptance criteria set in each validation run were: capacity factor
< 2.0, tailing factor ≥ 2.0 and theorical plates > 2000. In
all cases, the relative standard deviation (RSD) for the anlayte peak area for two consecutive injections was <
2.0%. The values obtained are in agreement with the literature (ICH-2QB, 2005). Therefore, the method may
be considered robust.
Incorporation of FLU in the formulations
Analyses were performed in triplicate and results
expressed as the content of FLU in the formulation, in
mg.g-1, as shown in Table VI. The concentration was
calculated from the peak area by the equation and analytical
curve obtained in the test of linearity: y=0.0005 x + 0.0012.
The statistical analysis showed that the difference
between the incorporation of FLU into CO1, CO2, CO3, CO4, OS1, OS2, OS3 and OS4 was not statistically
significant (p>0.05). On the other hand, OA1, OA2, OA3 and OA4 exhibited values of FLU incorporation signiicantly higher (p<0.05) than CO1, CO2, CO3, CO4, OS1, OS2, OS3 and OS4.
It was observed that the formulations with CO or CS
as oil phase presented lower quantity of FLU incorporated
when compared with formulations with OA as oil phase. This may be due to the complex composition of these oils,
which contain various nonpolar components and other polar
chains that hinder the solubilization of drugs such as FLU.
Veiga Junior, Pinto, and Maciel et al.(2005) claim
that copaiba oil may vary in relation to the concentration and nature of diterpenes and sesquiterpenes present variations according to species, biological or abiotic factors. Thus, although the difference in the amount of FLU incorporated was not statistically significant in copaiba oils from different sources tested, since they have different amounts of terpenes, this could result in different
afinities by drugs with different degrees of lipophilicity.
CONCLUSIONS
All validation parameters were satisfactory; the results showed that the method is suitable for quantitative analysis of FLU, consistent with the requirements of ICH and ANVISA, and thus providing a reliable analytical method. The proposed method was accurate in measuring the concentration of FLU in ME and LC.
ACKNOWLEDGMENTS
by FAPESP (Fundação de Amparo a Pesquisa), PADC
(Programa de Apoio ao Desenvolvimento Cientíico) and CAPES (Coordenação de Aperfeiçoamento de Pessoal de
Nível Superior) is acknowledged.
REFERENCES
ALAM, M.M.; SHRESTHA, L.K.; ARAMAKI, K. Glycerol effects on the formation and rheology of cubic phase and related gel emulsion. J. Colloid Interf. Sci., v.329,
p.366-371, 2009.
ALNAIM, L.; ABOU ALSOUD, N.; ZAGHLOUL, I.; AL-JASER, M. Effects of luconazole on the pharmacokinetics and pharmacodynamics of antimony in cutaneous leishmaniasis-infected hamsters. Int. J. Antimicrob. Agents.,
v.29, p.728-732, 2007.
ALVAREZ-FIGUEROA, M.J.; BLANCO-MÉNDEZ, J. Transdermal delivery of methotrexate: iontophoretic delivery from hydrogels and passive delivery from microemulsions. Int. J. Antimicrob. Agents, v.215,
p.57-65, 2001.
APOSTOL, I; KRULL, I; KELNER, D. Analytical method validation for biopharmaceuticals. In: KRULL, I.S. (Ed.)
Analytical chemistry. Intech, p.115-134, 2012.
AYUB, A.C.; GOMES, A.D.M.; LIMA, M.V.C.; VIANNA-SOARES, C.D.; FERREIRA, L.A.M. Topical delivery of
luconazole: in vitro skin penetration and permeation using
emulsions as dosage forms. Drug Dev. Ind. Pharm., v.33,
p.273-280, 2007.
BACHHAV, Y.G.; PATRAVALE, V.B. Microemulsion based
vaginal gel of luconazole: Formulation, in vitro and in vivo
evaluation. Int. J. Pharm., v.365, p.175-179, 2009.
BAROLI, B.; LÓPEZ-QUINTELA, M.A.; DELGADO-CHARRO, M.B.; FADDA, A.M.; BLANCO-MÉNDEZ,
J. Microemulsions for topical delivery of 8-methoxsalen. J
Control. Release, v.69, p.209-218, 2000.
BRASIL. Ministério da Saúde. Política Nacional de Assistência Farmacêutica. Resolução nº899, de 29 de maio de 2003. Diário Oficial da União, Brasília (DF). Acessed on: 27 July 2013.
CARVALHO, F.C.; BARBI, M.; GREMIÃO, M.P.D. LC evaluation of in vitro release of AZT from microemulsions. Chromatographia, v.69, p.207-211, 2009.
C H O R I L L I , M . ; P R E S T E S , P. S . ; R I G O N , R . B . ; LEONARDI, G.R.; CHIAVACCI, L.A.; SARMENTO, V.H.V.; OLIVEIRA, A.G.; SCARPA, M.V. Structural
characterization and in vivo evaluation of retinyl palmitate
in non-ionic lamellar liquid crystalline system. Colloids Surf. B Biointerfaces, v.85, p.182-188, 2011.
CINTO, P.O.; SOUZA, A.L.R.; LIMA, A.C.; CHAUD, M.V.; GREMIÃO, M.P.D. LC evaluation of intestinal transport
of praziquantel. Chromatographia, v.69, p.213-217, 2009.
DASH, A.K.; ELMQUIST, W.F. Fluconazole. In: HARRY, G.B. (Ed.) Analytical proiles of drug substances and excipients. London: Academic Press, 2001. v.27, p.67-113.
EL-NESR, O.H.; YAHIYA, S.A.; EL-GAZAYERLY,O.N.
Effect of formulation design and freeze-drying on properties
of luconazole multilamellar liposomes. Saudi Pharm. J.,
v.18, p.217-224, 2010.
ERCHIGA, V.C.; FLORENCIO, V.D. Micosis cutáneas. Med.
Clin., v.125, p.467-474, 2005.
FORMARIZ, T.P.; URBAN, M.C.C.; SILVA JÚNIOR, A.A.; GREMIÃO, M.P.D.; OLIVEIRA. A.G. Microemulsões e fases líquidas cristalinas como sistemas de liberação de
fármacos. Rev. Bras. Ciênc. Farm., v.41, p.301-313, 2005.
GABBOUN, N.H.; NAJIB, N.M.; IBRAHIM, H.G.; ASSAF, S. Release of salicylic acid and diclofenac acid salts from isotropic and anisotropic nonionic surfactant systems across rat skin. Int. J. Pharm., v.212, p.73-80, 2001.
GONZÁLEZ, A.G.; HERRADOR, M.A. A practical guide to analytical method validation, including measurement
uncertainty and accuracy proiles. Trends Anal. Chem., v.26,
p.227-238, 2007.
GUPTA, M.; VYAS,S.P.Development, characterization and in vivo assessment of effective lipidic nanoparticles for dermal
delivery of fluconazole against cutaneous candidiasis.
Chem. Phys. Lipids, v.165, p.454-461, 2012.
HEUSCHKEL, S.; GOEBEL, A.; NEUBERT, R.H.H. Microemulsions-modern colloidal carrier for dermal and transdermal. J. Pharm. Sci., v.97, p.603-631, 2008.
HOFER, J.D.; OLSEN, B.A.; RICKARD, E.C. Is HPLC assay for drug substance a useful quality control attribute? J. Pharm. Biomed. Anal., v.44, p.906-913, 2007.
HÖLLER, S.; VALENTA, C. Effect of selected fluorinated drugs in a “ringing” gel on rheological behavior and skin permeation. Eur. J. Pharm. Biopharm., v.66, p.120-126,
2007.
HOLMBERG, K.; JONSSON, B.; KRONBERG, B.;
LINDMAN, B. Surfactants and polymers in aqueous
solution. West Sussex: John Wiley & Sons, 2002. 545 p.
HUANG, Y.B.; LIN, Y.H.; LU, T.M.; WANG, R.J.; TSAI, Y.H.; WU, P.C. Transdermal delivery of capsaicin derivative-sodium nonivamide acetate using microemulsions as vehicles. Int. J. Pharm., v.349, p.206-211, 2008.
INTERNATIONAL CONFERENCE ON HARMONIZATION. I C H . Te c h n i c a l R e q u i r e m e n t s f o r R e g i s t r a t i o n of Pharmaceutical Human Use Geneva. ICH-Q2B: Switzerland, 2005. Available at: www.ich.org Accessed on: 25th July 2013.
JOVANOVIĆ, D.; KILIBARDA, V.; ĆIRIĆ, B.; VUČINIĆ, S.; SRNIĆ, D.; VEHABOVIĆ, M.; POTOGIJA, N. A randomized, open-label pharmacokinetic comparison of two oral formulations of luconazole 150 mg in healthy adult volunteers. Clin. Ther., v.27 p.1588-1595, 2005.
KREILGAARD, M. Inluence of microemulsions on cutaneous drug delivery. Adv. Drug Deliver. Rev., v.54, p.S77-S98,
2002.
MAINARDES, R.M.; GREMIÃO, M.P.D.; CARVALHO, F.C. Exploring the nanotechnology-based drug delivery systems for AIDS Treatment. In: KASENGA, F.G. (Ed.).
Understanding HIV/AIDS management and care - pandemic approaches in the 21st century. Croatia: Intech, 2011. p.367-384.
MANNOCK, D.A.; COLLINS, M.D.; KREICHBAUM, M.; HARPER, P.E.; GRUNER, S.M.; MCELHANEY, R.N. The thermotropic phase behaviour and phase structure of a homologous series of racemic β-d-galactosyl dialkylglycerols studied by differential scanning calorimetry and X-ray diffraction. Chem. Phys. Lipids, v.148, p.26-50,
2007.
MÜLLER-GOYMANN, C.C. Physicochemical characterization of colloidal drug delivery systems such as reverse micelles, vesicles, liquid crystals and nanoparticles for topical administration. Eur. J. Pharm. Biopharm., v.58, p.343-356,
2004.
NEGRONI, R. Historical aspects of dermatomycoses. Clin.
Dermatol., v.28, p.125-132, 2010.
PEIRA, E.; SCOLARI, P.; GASCO, M.R. Transdermal permeation of apomorphine through hairless mouse skin from microemulsions. Int. J. Pharm., v.226, p.47-51, 2001.
PORE, V.S.; AHER, N.G.; KUMAR, M.; SHUKLA, P.K. Mycotic keratitis: an overview of diagnosis and therapy.
Micoses, v.62, p.11178-11186, 2006.
SASONGKO, L.; WILLIAMS, K.M.; DAY, R.O.; MCLACHLAN, A.J. Human subcutaneous tissue distribution of luconazole: comparison of microdialysis and suction blister techniques. Br. J. Clin. Pharmacol., v.56,
p.551-561, 2003.
SHABIR, G.A. Validation of high performance liquid chromatography methods for pharmaceutical analysis. Understanding the difference and similarities between validation requirements of the US Food and Drug Administration, the US Pharmacopeia and the International
Conference on Harmonization. J. Chromatogr. A, v.987,
p.57-66, 2003.
VEIGA JUNIOR, V.F.; PINTO, A.C.; MACIEL, M.A.M. Plantas medicinais: cura segura? Quím. Nova, v.28, p.519-28, 2005.
WARISNOICHAROEN, W.; LANSLEY, A.B.; LAWRENCE, M.J. Noionic oil-in-water microemulsion effect of oil type on phase behavior. Int. J. Pharm., v.198, p.7-27, 2000.
WEI, J.; SU, B.; XING, H. BAO, Z.; YANG, Y.; REN, Q. Effect of ionic liquids on temperature-induced percolation
behavior of AOT Microemulsions. Colloid. Surface. A,
v.396, p.213-218, 2012.
Received for publication on 05th August 2013