Artigo
*e-mail: [email protected]
DETERMINATION OF Mn2+ ION BY SOLUTION SCANOMETRY AS A NEW, SIMPLE AND INEXPENSIVE
METHOD
Ardeshir Shokrollahia,b,* and Nasrin Shokrollahia,c
aDepartment of Chemistry, Yasouj University, Yasouj, Iran
bRadiation and Pollution Protection Research Center of Mamasani, Mamasani, Fars, Iran cYoung Researchers and Elite Club, Mamasani Branch, Islamic Azad University, Nourabad, Iran
Recebido em 30/01/2014; aceito em 10/08/2014; publicado na web em 08/10/2014
In this research, scanometry was used as a new, simple, fast and inexpensive method for a colorimetric determination of Mn2+ ion in
water samples and thermocouple wire through the use of periodate reagent in an acidic medium. The results showed the oxidization of colorless Mn2+ ion by periodate and the formation of a purplish MnO
4
- ion. The system had a linear range of 1.0 to 70.0 µg mL-1
Mn2+ ion with a detection limit of 0.314 µg mL-1 and a relative standard deviation of 2.77% for G color value. This method has the
capability to determine low levels of Mn2+ ion in thermocouple wire and water samples.
Keywords: Mn2+ ion; periodate; colorimetric; scanometry.
INTRODUCTION
Manganese is a necessary trace element that exists in all active cells1,2 playing a crucial role in bone mineralization, protein and
energy metabolism, metabolic regulation, cellular protection from injurious free radical kinds, glycosaminoglycans formation,3
hu-man energy metabolism and processes related to the synthesis of neurotransmitters,4 biological system, formation of anterior pituitary
hormone, vitamin B1 and C, affecting hematopoiesis, oxidation and
proteometabolism in the body.5 On one hand,lack of manganese
can cause dermatitis, mitochondrial abnormalities, infertilities, bad formation of the bones, serum cholesterol loss, problems related to glucose metabolism and proteins and so forth.6
On the other hand, extra amounts of manganese can also be poisonous especially to the nervous system which appears to be the mainly unprotected7 part, finally leading to symptoms of Parkinson
disease in adults.8 This element is found in rock, soil, water, little tiny
soil-like portions in the air and foods such as tea, grains, rice, soya beans, eggs, nuts and cereals.3,9,10 Moreover, manganese compounds
are used in manufacturing batteries, glass and fireworks, for whitening and sterilization purposes and as oxidants for cleaning.11
Various methods for the determination of manganese are de-scribed in the reports, including inductively coupled plasma mass spectrometric method,4,12-19 colorimetric20 and potentiometric flow
injection,21 spectrophotometric method,5,22,23 flow-injection analysis
(FIA),13 catalytic method,24-27 photometric method,28,29 near infrared
reflectance spectroscopy,30 voltammetry,31,32 total reflection X-ray
fluorescence and ultra sound extraction.33 However, these methods
require expensive instruments, some of them requiring a number of sample pretreatments, the conducting of which is sometimes rather la-borious and time consuming especially when it comes to real matrixes. In this study scanner was used instead of spectrophotometer as a simple, fast and inexpensive method for determining Mn2+ ion.
Paptode was first developed by Abbaspour research group in 200634-36 only later to be coupled with cloud point extraction procedure
as a detection system by Shokrollahi group.37 Recently, instead of
using TLC strips used in paptode34-36 Abbaspour group has studied the
solution-based method using cells for detection and determination of
dopamine38,39 and speciation of iron (II) and iron (III).40
In this method the reaction is carried out in a solution in Plexiglas®
cells or in tubes. Scanometry has some advantages; it is easy to handle and has the capability to test various compounds simultaneously, with a high scanning speed, a quick response and limited interfer-ences. Moreover, it is inexpensive, has portable systems and unlike spectrometer, it eliminates the need to find λ
max.Finally more clear,
symmetrical and homogenous images can be obtained through its use.
EXPERIMENTAL
Reagents and solutions
All chemicals were of analytical grade. In addition, double dis-tilled water was used to prepare reagents and stock solutions. A stock solution with a periodate of 0.048 mol L-1 was prepared by diluting
1.10 g of metapotasium periodate (from Merck company) in a 100 mL-graduated flask by double distilled water. Mn2+ ion solutions were
prepared by diluting 500 µg mL-1 of standard solutions. A sulfuric
acid of 10 mol L-1 was prepared by diluting 27.2 mL of it (taken from
Merck company) in a 50 mL-graduated flask by double distilled water.
Apparatus
Cells built by the sheet of Plexiglas® were used in this study. For
the light source, a flatbed CanoScan LIDE200 with a 3-color (RGB) LED (cold cathode fluorescent lamp (CCFL)) and for the detection system, a charge couple device (CCD) were used. The horizontal and vertical resolution of the scanner was set at 300 dpi. Furthermore, the color of each cell was analyzed with software written in visual basic 6 (VB 6) for red, green and blue values. A Brand micropipette (biohit) was then used for the injection of samples into the cells. Lastly, absorbance measurements of real samples were made by a JASCO V-530, UV-Vis spectrophotometer (Hachioji, Tokiyo, Japan) equipped with 1-cm quartz cells.
Principles of red, green and blue (RGB) color systems
adding more light to a starting black color, and for this reason it is also known as the Additive Color System. Every color in RGB spectrum is made up of a different value for each red, green and blue component, hence, its use by systems that have the ability to add lights such as LCD, CRT and RGB projectors. RGB colors range from 0 to 255, a range that a single 8-bit byte can offer through encoding 256 distinct values. In the RGB system, each color is represented in the form of (R, G, B), in which (0, 0, 0) and (255, 255, 255) refer to black and white respectively, therefore by increasing the intensity of colors, the color values will decrease. In this system 16 777 216 colors can be obtained and any color can be described by the following formula: V=R+256G+2562B
Where, R, G and B are red, green and blue values of the main color. For black and white, V is equal to 0 and 16 777 216 respec-tively. Through the following flowchart, R, G and B values of V for any color can be extracted:
R=V Mod 256
G = ((V- R) Mod (2562))/256
B = (V - R - G × 256) / (2562)
a Mod b is a numeric function which returns the remainder when dividing two numbers.
It should also be mentioned that the R, G or B color value that has the same color as the solution is usually useless, as this value is often higher than 200 and does not significantly change during the experi-ment. In this experiment all three values of the RGB system changed therefore the one with the highest change that is “G”, was chosen.
Designing the cell array
In order to make the reaction chamber, holes with an id of 1.5 cm were made in the sheet of Plexiglas with a thickness of 0.5 cm through the use of a laser beam. So as to cover the bottom of the holes and make the cells, the pierced sheet was attached to another sheet of Plexiglas® with a thickness of 0.1 cm. In our design, the cells were
organized in 4 columns and 8 rows, and a total of 32 cells in the sheet.
In order to investigate possible leakage from neighbor cavities and cross contamination, 500 µL of violet solution with an exact concentration was injected into all cylindrical cavities in Plexiglas®
sheet with no leakage and cross-contamination observed in the sheet.
General procedure
1 mL of 10 mol L-1 H
2SO4 solution, 2.1 mL of 0.048 mol L -1 KIO
4
solution, 3-500 µL of 100 µg mL-1 and 300-700 µL of 500 µg mL-1
Mn2+ ion solution were transferred into 5 mL graduated flasks and an
appropriate amount of double distilled water was added to the mark. Also a 5 mL graduated flask, with no added Mn2+ ion, containing 1 mL
of 10 mol L-1 H
2SO4 solution, 2.1 mL of 0.048 mol L -1 KIO
4 solution
and an appropriate added amount of double distilled water was set as blank. Next, the flasks were shaken to form a homogenous solution, were carefully boiled for 30 minutes in a boiling water bath at 100 °C and then cooled for 5 minutes. The 500 µL portions of each solution were transferred into each cell and finally the Plexiglas® sheet was
scanned with the scanner with the produced image transferred into the computer and any color change in each cell analyzed using a program written in VB 6 media. In this program, the color of each cell was analyzed based on the RGB system for obtaining R, G and B values. It should be noted that in this color analyzing program, a specific area was selected for analyzing and the number of pixels that could be indicated by this area was about 10000–300000. This program could average these pixels, therefore the noise dramatically decreased. The effective intensity for any color values was calculated as follows: Ar =-log (Rs/Rb)
Ag= -log (Gs/Gb)
Ab = -log (Bs/Bb)
where, Ar, Ag and Ab are the effective intensity for red, green and blue
respectively. Rs, Gs, Bs and Rb, Gb and Bb are the red, green and blue
color values of a sample and a blank, respectively.
Preparation of real samples
Water samples
1 mL of concentrated HNO3 was added to water samples which
were used after 1 hour. The procedure given in the general procedure section was then applied for analysis.
Thermocouple wire
So as to analyze thermocouple wire (Solid Chromel/Alumel (Type K)), an exact amount of wire was added to a 6 mL nitric acid and boiled for 2 minutes for a complete dissolution. The resulting solution was completely transferred to a 25 mL flask and dilute to the mark. The obtained solution was lastly analyzed according to the described procedure.
RESULTS AND DISCUSSION
The aim of this work was to develop a simple, fast and inexpensive method for a colorimetric determination of trace amounts of Mn2+ ion
in water samples and thermocouple wire through the use of periodate as oxidizing reagent. In this regard, the influence of various effective parameters, including heating and cooling time and the concentration of chemical reagents were optimized.
Effect of H2SO4
Optimizing the concentration of sulfuric acid is one of the main steps in optimization. This is because manganese has different oxida-tion forms (namely Mn II and Mn VII, Mn IV and Mn VI) each of which is stable in neutral, acidic and basic environments respectively. Worth mentioning is the fact that sulfuric acid concentration has a large influence on the sensitivity and efficiency of the method.
To study the effect of sulfuric acid, solutions containing 500 µL of Mn2+ ion (500 mg L-1) and 2.1 mL of periodate (0.048 mol L-1)
prepared according to the procedure. 500 µL of each sample was then transferred into the cells and after scanning the cells, the image of each cell was analyzed with the software as illustrated in Figure 2. As this Figure shows, with the increase in the concentration of H2SO4, the G value increased, the intensity of violet decreasing, from
2.0 mol L-1 concentration onwards, hence 2.0 mol L-1 was selected
as the optimum concentration for H2SO4. Because the highest value
belonged to parameter G, it was utilized as the original one.
Effect of KIO4
The optimization of the concentration of KIO4 as an oxidizing
reagent was the main step of optimization. To study the effect of this reagent, solutions containing 500 µL of Mn2+ ion (500 mg L-1) and
1.0 mL of sulfuric acid (10 mol L-1) and different concentrations
of periodate (0.001–0.03 mol L-1) were prepared according to the
procedure. Next, 500 µL of each sample was transferred into each Plexiglas® sheet. After scanning the cells, the image of each cell
was finally analyzed with the software. The obtained results are illustrated in Figure 3. As this Figure shows, the G value increased with the increase in the concentration of KIO4 and decreased from the
concentration of 0.02 mol L-1 onwards. Moreover, the redox reaction
was completed with high rather than low amounts of KIO4.
Effect of heating time
The effect of temperature and duration of heating are two impor-tant parameters on the completion of the reaction. The reaction was completed at high temperatures. Figure 4 illustrates that the effective intensity is the highest when the period of heating is 30 minutes. This effect clearly indicates that all Mn2+ ions reacted with IO
-4 and the
effective intensity reached a maximum value.
Effect of cooling time
To study the effect of cooling time, a solution containing 500 µL of Mn2+ ion (500 mg L-1), 2.1 mL of periodate (0.048 mol L-1)
and 1.0 mL sulfuric acid (10 mol L-1) was prepared according to the
procedure. 500 µL of the sample was then transferred into the cells and was scanned for 5-60 minutes. After scanning the cells, their images were analyzed with the software, the results being illustrated in Figure 5. It is seen that the effective intensity is independent of cooling time in the duration of 5-60 minutes therefore the minimum time i.e. 5 minutes was selected for the aforementioned steps.
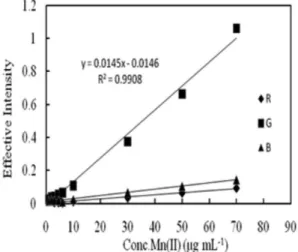
Analytical performance
Figure 6 illustrates the calibration curve under optimum condi-tions. In the range of 1.0–70.0 µg mL-1, a proper linear relationship
was obtained between the effective intensity of the product and the
Figure 2. Effect of H2SO4 amount on reaction (Conditions: 500 µL Mn 2+ ion
(500 mg L-1) + 2.1 mL KIO
4 (0.0478 mol L
-1) + 0.1-3.0 mol L-1 H 2SO4 +30
minutes heating and total volume of 5 mL)
Figure 3. Effect of periodate amount on the reaction (Conditions: 500 µL Mn2+
ion (500 mg L-1) + 1.0 mL H
2SO4 (10 mol L
-1) + 0.001-0.0 3 mol L-1 KIO
4+30
minutes heatingand total volume of 5 mL)
Figure 4. Effect of heating time on the reaction (Conditions: 500 µL Mn2+ ion
(500 mg L-1) + 1.0 mL H
2SO4 (10 mol L
-1) + 2.1 mL KIO
4 (0.0478 mol L
-1) +
10-80 minutes heating and total volume of 5 mL)
Figure 5. Effect of cooling time on the reaction (Conditions: 500 µL Mn2+ ion
(500 mg L-1) + 1.0 mL H
2SO4 (10 mol L
-1) + 2.1 mL KIO
4 (0.0478 mol L
-1) +
concentration of Mn2+ ion. The equation for the regression line was
Y=0.0145X-0.0146 (for G), where C is the concentration of Mn2+
ion in µg mL-1.
In order to render the reproducibility of the method, 6 sample solutions of 50 µg mL-1 Mn2+ ion were analyzed and 2.77 was the
RSD% (Relative Standard Deviation) for G color values. The detec-tion limit was obtained 0.314 µg mL-1 based on the standard deviation
of 8 blanks.
Interference study
To study the selectivity of the proposed method in determining Mn2+ ion, the effect of various species on the determination of 50
µg mL-1 Mn2+ ion was tested under optimum conditions. The
toler-ance limit was defined as the concentration of added ion that causes less than ±5% the relative error of G value. The results are shown in Table 1.
In this method, most of the species do not interfere, because the scanometry is based on the reflective properties of the samples. It
is notable that by this method colored species such as Cr3+, Cr 2O7
2-,
Cu2+ and Ni2+ ions or the product of reaction between the interference
and reagent (which changes the value of R, B or both parameters but not the G value), do not interfere in the determination of manganese.
Application
The applicability of the method in determining Mn2+ ion by the
standard addition technique and recovery was examined with ther-mocouple wire (Solid Chromel / Alumel (Type K)) and six different water samples including tap water, water falls, mineral water, river water, canal water and hot spring.
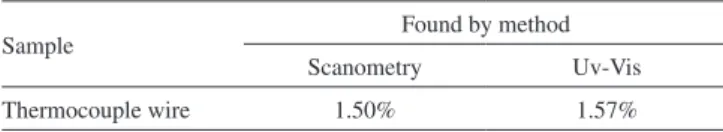
The thermocouple wire sample was prepared according to the experimental section and its manganese percentage was determined by the proposed method and was compared with UV-Vis method. The results are summarized in Table 3.
The determination of Mn2+ ion in the thermocouple wire sample
is remarkably accurate by the proposed method.
CONCLUSIONS
Scanometry as an easy, safe, rapid and inexpensive method has recently been used for the determination of trace amounts of Table 1. Effect of interfering species in the determination of 50 µg mL-1 Mn2+
ion in the optimum conditions
Interfering species Added as Tolerance Conc. (µg mL-1)
Fe3+, Al3+, Ni2+, Cd2+,
Cu2+, Na+, Li+
Nitrate salt 5000
ClO4 -,Cr
2O7 2-, NO
3
- Sodium or Potassium
salt
5000
La3+, Mg2+, Zn2+, Co2+ Nitrate salt 3000
Cr3+ Nitrate salt 1000
Zr4+,Bi3+,Hg2+, Ag+ Choloride salt of Zr4+,
Nitrate salt of Bi3+, Hg2+
and Ag+ ions
500
Figure 6. Calibration curve for determination of Mn2+ ion (Conditions: 1.0-70
mg L-1 Mn2+ ion + 1.0 mL H
2SO4 (10 mol L
-1) + 2.1 mL KIO
4 (0.0478 mol L
-1)
+ 30 minutes heating and total volume of 5 mL)
Table 2. Characteristics of the standard addition curves and recovery percentage, for determination of Mn2+ ion in water samples
sample Regration equation R2 Added (µg mL-1) Found (µg mL-1) Recovery %
Tap water (Yasouj city) A=0.013X-0.044 0.988 00.00 Nda
---20.00 19.99 99.95
40.00 39.64 99.10
Water falls (Yasouj city) A=0.014X-0.050 0.969 00.00 Nd
---20.00 20.02 100.10
40.00 40.01 100.00
Mineral water (Satrap) A=0.014X-0.058 0.966 00.00 Nd
---20.00 20.20 101.00
40.00 40.01 100.00
River water (Mamasani city) A=0.013X-0.034 0.977 00.00 Nd
---20.00 19.95 99.75
40.00 39.78 99.45
Canal water (Mamasani city) A=0.013X-0.026 0.985 00.00 Nd
--20.00 19.60 98.00
40.00 40.56 101.40
Hot spring (Mamasani city) A=0.009X-0.003 0.997 00.00 Nd
---20.00 20.06 100.30
40.00 40.34 100.90
analysts.36,38,39,41,42 In this study, scanometry was used for the
determi-nation of Mn2+ ion. This method has been developed as an alternative
to visible spectrophotometry and the analytical results showed that it can be successfully adopted in determining Mn2+ ion with high
selectivity in real samples.
ACKNOWLEDGEMENTS
We gratefully acknowledge the support of Yasouj University Research in this study.
REFERENCES
1. Oga, S.; Fundamentos de Toxicologia, Atheneu: São Paulo, 2008. 2. Goldhaber, S. B.; Regul. Toxicol. Pharmacol. 2003, 38, 232.
3. Williams-Johnson, M.; Concise International Chemical Assessment Documents 12, 1999.
4 . Amais, R. S.; Donati, G. L.; Nebrega, J. A; Anal. Chim. Acta 2011, 706, 223.
5. Wei, Q.;Yan, L.; Chang, G.; Ou, Q.; Talanta 2003, 59, 253.
6. Agency for Toxic Substances and Disease Registry; Toxicological pro-file for manganese (update). Atlanta, Georgia, 2000: Agency for Toxic Substances and Disease Registry, A-3 to A-5.
7. Erikson, K. M.; Thompson, K.; Aschner, J.; Aschner, M.; Pharmacol. Ther.2007, 113, 369.
8. Garcia, S. J.; Gellein, K.; Syversen, T.; Aschner, M.; Toxicol. Sci. 2007, 95, 205.
9. Mckenzie, H.A.; Smythe, L.E.; Quantitative Trace Analysis of Biological Materials, Elsevier: Amsterdam, 1988.
10. Ferreira, S. L. C.; Souza, A. S.; Brando, G. C.; Ferreira, H. S.; Dos Santos, W. N. L.; Pimentel, M. F.; Vale, M. G. R.; Talanta 2008, 74, 699. 11. Banta, R. G.; Markesbery, W. R.; Neurology 1977, 27, 213.
12. Bezerra, M. A.; Maeda, S. M. N.; Oliveira, E. P.; Carvalho, M. F. B.; Santelli, R. E.; Spectrochim. Acta 2007, 62, 985.
13. Tang, B.; Han, F.; Anal. Lett. 2001, 34, 1353.
14. Yebra, M. C.; Moreno-Cid, A.; Anal. Chim. Acta 2003, 477, 149. 15. Coskun, N.; Akman, S.; Talanta 2004, 64, 496.
16. Tokman, N.; Akman, S.; Ozeroglu, C.; Talanta 2004, 63, 699. 17. Wagatsuma, K.; Kodama, K.; Park, H.; Anal. Chim. Acta 2004, 502, 257. 18. Cozzolino, D.; Moron, A.; Anim. Feed Sci. Technol. 2004, 11, 161. 19. Lemos, V. A.; Baliza, P. X.; Carvalho, A. L.; Oliveira, R. V.; Teixeira, L.
S. G.; Bezerra, M. A.; Talanta 2008, 77, 388. 20. Mehlig, J. P.; Ind. Eng. Chem. 1939, 11, 274.
21. Ohura, H.; Ishibashi, Y.; Imato, T.; Yamasaki, S.; Talanta 2003, 60, 177. 22. Motojima, K.; Hashitani, H.; Imahashi, T.; Anal Chem. 1962, 34, 571. 23. Fathi, M. R.; Hashemi, P.; Abolhasan-Oghly, M. J.; J. Chin. Chem. Soc.
2007, 54, 1253.
24. K. Mutaftchiev; Anal. Lett. 2001, 34, 1401.
25. Pourreza, N.; Kamran-HeKani, S.; Rastegarzadeh, S.; Can. J. Anal. Sci. Spectrosc. 1998, 43, 149.
26. Kang, W.; Zhou, F. L.; Deng, X. P.; Journal of East China Geological Institute 1997, 20, 141.
27. Shi, T.Q.; Huang, J. G.; Qiu, C. Q.; Chin. J. Anal. Lab. 1998, 17, 34. 28. Waldbauer, L.; Ward, N.; Ind. Eng. Chem. 1942, 14, 727.
29. Johnson, D. A.; Lott, P. F.; Anal. Chem. 1963, 35, 1705. 30. Filipe, M. S.; Christopher, M. A.; Talanta 2003, 61, 643. 31. Baytak, S.; Rehber Turker, A.; Turk. J. Chem. 2004, 28, 243. 32. Zhang, F.; Talanta 2003, 60, 31.
33. Alvarez, J.; Marco, L. M.; Arroyo, J.; Greaves, E. D.; Rivas, R.; Spectrochim. Acta 2003, 58, 2183.
34. Abbaspour, A.; Mehrgardi, M. A.; Noori, A.; Sens. Actuators 2006, 113, 857.
35. Abbaspour, A.; Khajehzadeh, A.; Noori, A.; Anal. Sci. 2008, 28, 721. 36. Abbaspour, A.; Mirahmadi, E.; Khajehzadeh, A.; Anal. Methods 2010,
2, 349.
37. Shokrollahi, A.; Abbaspour, A.; Azami Ardekani, Z.; Anal. Methods 2012, 4, 502.
38. Abbaspour, A.; Valizadeh, H.; Khajehzadeh, A.; Anal. Methods 2011, 3, 1405.
39. Abbaspour, A.; Khajehzadeh, A.; Ghaffarinejad, A.; Analyst 2009, 134, 1692.
40. Abbaspour,A.; Khajehzadeh, A.; Ghaffarinejad, A.; Anal. Methods 2011, 3, 2268.
41. Shokrollahi, A.; Roozestan, T.; Anal. Methods 2013, 5, 4824. 42. Shokrollahi, A.; Mohammadpour, Z.; Abbaspour, A.; Pharm. Chem. J.,
in press. Table 3. Determination of manganese percentage in thermocouple wire
Sample Found by method
Scanometry Uv-Vis