Artigo
*e-mail: [email protected]
SIMULTANEOUS DETERMINATION OF PROTOCATECHUIC ALDEHYDE AND PROTOCATECHUIC ACID USING THE LOCALIZED SURFACE PLASMON RESONANCE PEAK OF SILVER NANOPARTICLES AND CHEMOMETRIC METHODS
Javad Khodaveisia, Ali Mohammad Haji Shabania, Shayessteh Dadfarniaa,*, Masoud Rohani Moghadamb and Mohammad
Reza Hormozi-Nezhadc
aDepartment of Chemistry, Faculty of Science, Yazd University, 89195-741 Yazd, Iran bDepartment of Chemistry, Faculty of Science, Vali-e-Asr University, Rafsanjan, Iran cDepartment of Chemistry, Sharif University of Technology, Tehran 11155-9516, Iran
Recebido em 10/01/2015; aceito em 27/04/2015; publicado na web em 21/05/2015
A simple and sensitive spectrophotometric method is proposed for the simultaneous determination of protocatechuic acid and protocatechuic aldehyde. The method is based on the difference in the kinetic rates of the reactions of analytes with [Ag(NH3)2]
+ in the
presence of polyvinylpyrrolidone to produce silver nanoparticles. The data obtained were processed by chemometric methods using principal component analysis artificial neural network and partial least squares. Excellent linearity was obtained in the concentration ranges of 1.23-58.56 µg mL-1 and 0.08-30.39 µg mL-1 for PAC and PAH, respectively. The limits of detection for PAC and PAH were
0.039 and 0.025 µg mL-1, respectively.
Keywords: protocatechuic aldehyde; protocatechuic acid; chemometric methods.
INTRODUCTION
Protocatechuic acid (PAC) and protocatechuic aldehyde (PAH) are the most effective active ingredients in some of the Chinese conventional herbal drug such as Salivia miltorrhrza,1
Fufang-Pugongying-Mixture,2 Shuangdan granule,3 and Zaoren-an-shen
capsules.4 These phenolic compounds are known as the strong
antioxidants and free radical scavengers.5,6 They can improve blood
circulation,7 decrease the area of cerebral infarct,8 and inhibit the
rennin angiotensin system.9 Therefore, in order to study its
clini-cal effects, it is significant to develop an easy, sensitive and fast method for the simultaneous determination of PAC and PAH in pharmaceutical preparations. So far, the commonly used techniques for simultaneous determination of PAH and PAC in pharmaceutical preparations are chromatography (TLC and RP-HPLC)2,10 and
capil-lary electrophoresis with electrochemical, UV-visible absorbance and chemiluminescence detectors.11-13
Silver nanoparticles (Ag-NPs) are among the most widely studied nanomaterials due to their attractive physicochemical properties. One of the most interesting characteristics of these nanoparticles is due to their ability to produce localized surface plasmon resonance (LSPR).14,15 This phenomenon occurs when the incident oscillating
electromagnetic field of the light interacts with the conduction elec-trons of the metal nanoparticles. This interaction causes a collective coherent oscillation of the nanoparticles free electrons in respect to the positive metallic lattice. This process is at resonant at a specific frequency of the light and is termed LSPR.16 Therefore, the Ag-NPs
display a strong absorption band around 450 nm with an extremely large molar extinction coefficient (~3 × 10¹¹ mol L-1 cm-1). Recently,
the gold and silver nanoparticles have been used as a colorimetric sensor for the detection of tryptophan17 and glucose18 by the naked
eye. Colorimetric nanoprobes using plasmon absorbance of noble metal NPs have also been developed for the sensitive determination of neurotransmitter,19 uric acid,20 phenolic compounds,21 ascorbic acid,22
thiol-containing amino acids,23 DNA,24 and pesticides.25
Kinetic methods based on the difference in the reaction rates are often useful for the simultaneous determination of the analytes in multicomponent mixtures without any physical separation. Generally, in these methods, similar analytes react with a common reagent, the difference in the reaction rates is monitored and with the help of the chemometric methods the components are simultaneously determined.26,27
The proportional equations, curve resolution,28,29 and Kalman
filter30 are among the chemometric methods applied to resolve the
multicomponent kinetic systems. Linear and nonlinear chemometric methods, including principal component regression (PCR), partial least squares (PLS), and artificial neural network (ANN), have also been widely used for the simultaneous determination of analytes in the mixtures by means of kinetic-spectrophotometric procedures.31-34
The ANN that stimulates the biological neural network has laye-red structure. It is consists of several neuron layers including input, output, and at least one hidden layer. Synapses connect the layers together form the input to the output through hidden layer. Among various types of neural network structures, the feed forward artificial neural network (FFANN) is the most popular and applicable types of ANNs in analytical chemistry and was used in this work. Basic theory and application of this method to chemical problems have been explained in the literature.35-37 However, with large number of
input data, training process is complex and very large amounts of calibration sample is needed. So, for the spectrum and kinetic data, a method for reduction of input data is necessary. Principal component analysis (PCA), a powerful multivariate technique, rotates the data and reduces the dimensionality of them while retained the maximum information, thus, principal components (PCs) can be useful inputs for ANN.38 The use of the PCA data in the design of the ANN model
have the advantages of decrease the effect of adjustments of weights variation, increase the numerical stability of the model construction process and reduce the amount of colinearity between variables.39
PLS and ANN as two known linear and nonlinear chemometric techniques have the ability to relate the input and output variables without the need for having any preknowledge on the system.40 PLS
the building of regression models is based on the latent variable decomposition that takes into account the information of responses and concentrations simultaneously and is widely used for the simul-taneous determination of species which have spectrum overlap. Its basic concept was originally described by Wold et al.41 The theory
and application of PLS methods have been discussed by several workers.42 The chemometric resolution of the multicomponent
ki-netic systems has the advantages that the details of kiki-netic of reac-tions such as the order of the reaction and the rate constants are not needed. Furthermore, the analyte-analyte interaction, the synergistic effect and the multistep process is not important comparing to the conventional techniques.43
In this work, a simple and sensitive kinetic spectrophotometric method has been reported for the simultaneous determination of PAC and PAH. The method is based on the difference of the kinetic rates of the analytes with silver nitrate in the presence of polyvinylpyr-rolidone (PVP) to produce Ag-NPs. Calibration models have been built from the kinetic data derived from the analyte mixtures with the aid of principal component artificial neural network (PC-ANN) and PLS. Then, these models have been verified and compared. Finally, PC-ANN has been selected and applied for the simultaneous deter-mination of analytes in real samples.
EXPERIMENTAL
Chemicals and reagents
All chemicals used were of the analytical reagent grade from Merck (Darmstadt, Germany) in the highest purity available, except for polyvinylpyrrolidone (PVP) with average molecular weight of 10,000 that was purchased from Acros (Geel, Belgium). The aqueous solutions were prepared using distilled deionized water. The experi-ments were performed at the ambient temperature (25 ± 2 ºC). A stock solution of AgNO3 (1.0 × 10
-3 mol L-1) was prepared by dissolving
an appropriate amount of AgNO3 in distilled water. A solution of
polyvinylpyrrolidone (PVP) (0.4 g L-1) was prepared daily by
dis-solving 0.01 g of PVP in distilled water and diluting to 25 mL. Fresh standardsolutions of analytes were prepared daily by dissolving an appropriate amount of reagents in deionized water.
Apparatus
The UV-Vis absorbance spectra were recorded on a HACH mo-del DR 3900 (Loveland, Colorado, USA) spectrophotometer with a 1.0 cm glass cell. The measurements of the pH were made with an EcoMet model P25 pH meter (Guro-gu, Seoul, Korea) equipped with a combined glass calomel electrode. The sizes of the Ag-NPs were characterized by the transmission electron microscopy (TEM) using a Zeiss transmission electron microscope (Jena, Germany) operated at an accelerating voltage of 80 kV. A PLS program for the calibration prediction and the experimental design was written in MATLAB according to the algorithm described by Martens and Nӕs44 and the PLS routine of PLS Toolbox (Eigenvector, version 2.1).
The principal component analysis (PCA) process was performed also
by the PLS Toolbox, and the scores of the PCA running were fed into ANN program as inputs. The ANN calculations were performed using WinNN32 software.
General procedure
In a 5.0 mL volumetric flask the solutions were added in the following order: 3.0 mL of 1.0 × 10⁻³ mol L-1 AgNO
3, 0.1 mL of
0.25 mol L-1 NH
3, 0.7 mL of 0.4 g L
-1 PVP and 0.1 mL of 0.1 mol L-1
NaOH and was mixed thoroughly. Then, an appropriate volume of PAC or PAH standard or sample solution was added. The mixture was diluted to 5.0 mL with distilled water and was mixed slowly. It was transferred into a 1 cm spectrophotometric cell and the absorbance was recorded against time for 30 min in the 0.1 min interval. The absorbance was measured against a reagent blank at 450 nm, the λmax of silver nanoparticles localized surface plasmon resonance peak.
.
RESULT AND DISSCUSION
Kinetic study of reaction between PAC and PAH and [Ag(NH3)2]
+
The preliminary studies indicated that PAC and PAH can reduce [Ag(NH3)2]
+ complex to the Ag-NPs (Scheme 1) in the presence of
polyvinylpyrrolidone (PVP) as the stabilizer, at an alkaline medium. In the absence of analytes, no absorption peak was observed in the UV-Vis region. But, after addition of analytes, the [Ag(NH3)2]
+ was
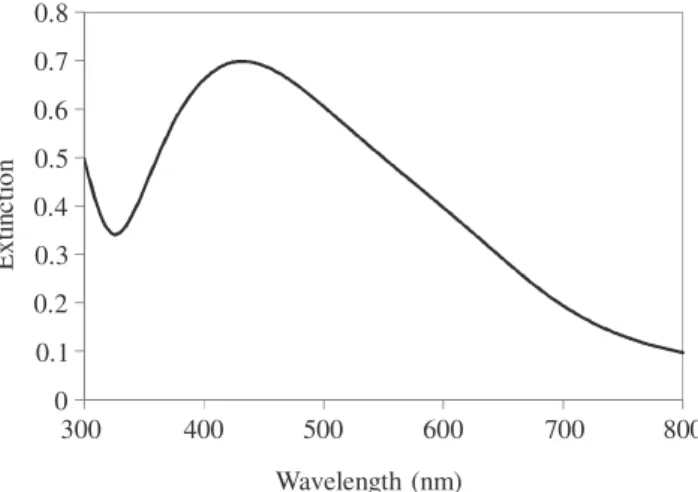
reduced to the Ag-NPs and the localized surface plasmon resonance peak of Ag-NPs was observed (Figure 1). TEM image showed that (Figure 1S) the synthesized Ag-NPs with an average diameter about 10-20 nm were dispersed in aqueous solution. The plot of the absor-bance versus time for analytes (Figure 2) revealed that the reaction of silver ions with PAC is faster than that with PAH. Therefore, a kinetic spectrophotometric method based on the difference between
Scheme 1. Reduction process of [Ag(NH3)2]
+ by the PAC and PAH
0 0.1 0.2 0.3 0.4 0.5 0.6 0.7 0.8
300 400 500 600 700 800
Exti
n
c
ti
o
n
Wavelength (nm)
Figure 1. LSPR spectra of Ag-NPs formed by PAC. Conditions: AgNO3
6.0 × 10⁻⁴ mol L-1, NaOH 2.0 × 10⁻³ mol L-1, NH 3 5.0 × 10
-3 mol L-1, PVP
the reaction rates of PAC and PAP with [Ag(NH3)2]
+ was designed
for the simultaneous determination of these analytes.
It should be noted that in the presence of an excess amount of silver nitrate, there is no remarkable red or blue shift of the LSPR peak with different concentrations of the analytes.
Optimization of experimental factors
Type and concentration of the stabilizer, concentrations of silver nitrate, NaOH and NH3 are the main factors that must be optimized
for improvement of the sensitivity of the method. So, the effect of these parameters on the maximization of the LSPR peak at 450 nm were carefully studied and optimized, individually.
The choice of an appropriate stabilizing agent is very important in the syntheses of nanoparticles as the stabilizing agent prevents the nanoparticle agglomeration. Nanoparticles are often stabilized according to the two basic modes: electrostatic and steric stabili-zation.20 Electrostatic stabilization is the result of the production
of charges on the surface of nanoparticles whereas the steric sta-bilization is achieved when organic molecules or polymers act as the protective shields on the metallic surface (e.g., PVP). In this study PVP, CTAB, Triton X-100 and sodium citrate were exami-ned as the stabilizing agent to prevent the Ag-NPs agglomeration. Figure 3 shows that with the PVP as the stabilizer, the absorbance and consequently the sensitivity of method is higher than with the other stabilizing agents examined. The higher sensitivity of the method in presence of PVP as the stabilizer can be related to its macromolecular structure with N-heteroatom, forming a thick adsorption layer on the surface of the generated Ag-NPs. Thus, it significantly decreases the availability of Ag metal surface, where the catalysis of further silver ions from the solution proceeds. In other words, strong interaction of PVP with the growing Ag-NPs, revealed the most significant deceleration of the studied reaction. The results show (Figure 2S) that the extinction of Ag-NPs resulted from both analytes increased with an increase in the PVP con-centration and reaches its maximum at the PVP concon-centration of 6.0 × 10⁻² g L-1 PVP. Similar results were observed in our previous
study.45 Therefore, the concentration of 6.0 × 10⁻² g L-1 was chosen
as the optimum concentration of PVP for the subsequent studies. The effect of AgNO3concentration on the intensity of LSPR peak
of the Ag-NPs was investigated by varying the concentration in the range of 1.0-8.0 × 10⁻⁴ mol L-1. It was found (Figure 3S) that the
absorbance intensity increases by addition of AgNO3 concentration
up to 6.0 × 10⁻⁴ mol L-1. In higher concentrations of AgNO 3 some
black precipitates was formed in the solution, which were probably
micro-scale silver particles,20 and caused a decrease in LSPR peak
intensity. So, a concentration of 6.0 × 10⁻⁴ mol L-1 was selected as
the optimum silver nitrate concentration for the subsequent studies. As was stated before, the proton is produced during the reaction of analytes with silver ions and the redox potential of PAC and PAH de-creases with an increase in the pH; thus the reducing power of analytes is enhanced in the alkaline medium. Therefore, the effect of the alka-linity of the solution on the reactions was studied by varying the con-centration of NaOH within the range of 0.5 × 10⁻³-3.0 × 10⁻³ mol L-1.
It was observed that (Figure 4S) the absorbance increased by an increase in the NaOH concentration up to a 2.0 × 10⁻³ mol L-1 and
was decreased at higher concentration. The decrease of absorbance at higher concentration may be due to the formation of AgOH pre-cipitate. Thus, a concentration of 2.0 × 10⁻³ mol L-1 of NaOH was
selected as the optimum for further studies.
The effect of ammonia concentration on the absorbance of Ag-NPs was also investigated. The results demonstrated that (Figure 5S) the absorbance increased with an increase in NH3
concentra-tion and reaches its maximum at 5.0 × 10⁻³ mol L-1. The decrease
in the signal at concentration higher than 5.0 × 10⁻³ mol L-1 may be
related to the lower yield of the redox reaction between [Ag(NH3)2] +
complex ion and the analytes at higher concentrations of ammonia. This decrease can be related to the lower yield of the redox reaction between [Ag(NH3)2]
+ complex ion and analytes at higher
concentra-tions of NH3. As can be understood from Nernst equation for
elec-trode potential of [Ag(NH3)2]
+/Ag, with increasing the concentration
of NH3 the potential will decrease. So, the difference between the
redox potentials of [Ag(NH3)2]
+/Ag and analytes and the equilibrium
constant for the redox reaction would also decrease.20 Thus, a
con-centration of 5.0 × 10⁻³ mol L-1 of NH
3 was selected as the optimum
NH3 concentration. Analytical performance
The LSPR spectra of the Ag-NPs formed upon treatment with different concentrations of the PAC and PAH are shown in Figures 4a and 4b, respectively. The figures of merit of the method under the opti-mum experimental conditions (Table 2S) were as follows: The calibra-tion curve for PAC was linear in the range of 1.23-58.56 µg mL-1 with
R2 = 0.9976 and for PAH was linear in the range of 0.08-30.39 µg mL-1
with R2 = 0.9972. The limit of detection (LOD) of PAC and PAH
defined as 3Sb/m
35 (where S
b and m are the standard deviation of the
blank and the slope of the calibration curve) were 0.039 µg mL-1 and
0.025 µg mL-1, respectively. The relative standard deviation (RSD)
0 0.1 0.2 0.3 0.4 0.5 0.6 0.7
0 5 10 15 20 25 30
E
x
ti
n
ct
io
n
Time (min)
PAH PAC
Figure 2. Kinetic curves corresponding to the absorbance changes (at
l = 450 nm) of the analytes stimulated growth of Ag-NPs. Conditions: AgNO3 6.0 × 10
-4 mol L-1, NaOH 2.0 × 10⁻³ mol L-1, NH 3 5.0 × 10
-3 mol L-1,
PVP 6.0 × 10⁻² g L-1, PAC 46.25 µg mL-1, PAH 30.38 µg mL-1
0 0.1 0.2 0.3 0.4 0.5 0.6 0.7
CTAB PVP Sodium
citrate
Triton X -100
With uo t stabilizer
E
x
ti
n
ct
io
n
Stabilizer agent
PAH PAC
Figure 3. Effect of stabilizer type on the extinction of Ag-NPs. Conditions:
AgNO3 6.0 × 10
-4 mol L-1, NaOH 2.0 × 10⁻³ mol L-1, NH 3 5.0 × 10
-3 mol L-1,
for five replicate determinations at 14.50 µg mL-1 of PAC and PAC
were 3.1% and 1.8%, respectively.
Chemometric methods
In order to obtain the optimum conditions from the minimum experimental trials, 45 samples of binary mixtures were designed.
The concentration levels for the analytes were as: PAC (1.24, 6.16, 15.42, 26.20, 35.45, 46.24 and 58.56 µg mL-1); and PAH (0.08, 0.72,
2.76, 8.28, 13.82, 20.72 and 30.38 µg mL-1). The binary mixtures
were analyzed according to the given procedure and the kinetic data were recorded. Then, PLS and PC-ANN were tested for the cons-truction of calibration model. In this network, the data move only in the forward direction from the input nodes through the hidden one to the output nodes without any loops or cycles and a three-layer network was applied.
For doing the PC-ANN analysis, the 45 calibration samples were randomly divided into two sets; training set (containing 35 trials (Table 1S)) and validation set (containing 10 trials) manually. The neural network was constructed using WinNN32 software and effecti-ve factors such as number of principal components, number of layers, number of hidden layers, and number of nodes (neurons) in hidden layers and learning function and learning parameters were optimized for each for each analyte individually. The results of optimization of PC-ANN parameters and the obtained statistical parameters for test set are summarized in Table 1. Another eight synthetic mixtures of the two analyte compounds were used as prediction or test set and the constructed PC-ANN model was applied to its analysis, the results of this study are shown in Table 2.
All 45 calibration samples were mean centered and used for the construction of PLS-1 model. One of the most important param-eters in PLS is the number of significant factors. To ascertain the number of significant factors (latent variables) in the PLS algorithm without over fitting, leave-one-out cross-validation method was used.46 One reasonable choice for the optimum number of latent
0 0.1 0.2 0.3 0.4 0.5 0.6 0.7 0.8
300 400 500 600 700 800
E
x
ti
n
ct
io
n
Wavelength (nm)
0 0.1 0.2 0.3 0.4 0.5 0.6 0.7 0.8
300 400 500 600 700 800
E
x
ti
n
ct
io
n
Wavelength (nm)
0 0.1 0.2 0.3 0.4 0.5 0.6 0.7 0.8
0 10 20 30 40 50 60 Concentration of PAC (µg/mL)
E
x
ti
nc
ti
o
n
0 0.1 0.2 0.3 0.4 0.5 0.6 0.7
0 10 20 30
Concentration of PAH (µg/mL)
E
x
ti
n
ct
io
n
(A)
(B)
Figure 4. LSPR spectra of Ag-NPs in the presence of different concentration
of (A) PAC (1.24-58.56 µg mL-1), (B) PAH (0.08-30.38 µg mL-1) (The inset is a calibration curve of PAC and PAH obtained by measuring the absorbance at 450 nm). Conditions: AgNO3 6.0 × 10
-4 mol L-1, NaOH 2.0 × 10⁻³ mol L-1,
NH3 5.0 × 10
-3 mol L-1, PVP 6.0 × 10⁻² g L-1
Table 1. Optimized parameters used for construction of PC-ANN in
simul-taneous determination of PAC and PAH
Network parameters PAC PAH
Number of layers 3 3
Input nodes (number of PCs) 4 5
Hidden nodes 6 6
Hidden layer transfer function sigmoid sigmoid
Output nodes 1 1
Output layer transfer function sigmoid sigmoid
Momentum 0.04 0.02
Number of iteration 12.000 10.000
Table 2. Analysis of the eight synthesis samples and their relative error (RE), RMSEP and R2 at the optimum conditions
PAH PAC
Added (µg mL-1) Found (µg mL -1)
Added (µg mL-1) Found (µg mL -1)
PLS RE PC-AANN RE PLS RE PC-AANN RE
1.077 1.627 -0.338 1.056 0.019 7.089 5.455 0.299 7.164 -0.011
1.077 1.624 -0.336 1.071 0.005 38.314 33.084 0.158 38.118 0.005 14.778 15.609 -0.053 14.237 0.038 7.089 5.204 0.362 7.114 -0.003 14.778 15.606 -0.053 14.785 0.002 38.314 32.831 0.167 38.156 0.004 22.099 22.749 -0.028 21.685 0.019 7.089 5.395 0.313 7.022 0.009 22.099 22.745 -0.028 22.052 0.002 38.314 33.024 0.160 38.456 -0.003 28.635 26.314 0.088 28.642 0.001 2.366 1.653 0.431 2.345 0.008 28.635 26.892 0.064 28.526 0.003 45.212 39.624 0.141 45.024 0.004 Statistical parameters
RMSEP 0.125 0.00281 0.146 0.00627
variables (LV) is a number that yields the minimum root mean square errors of cross-validation (RMSECV). As it was observed that (Figure 6S) 12 latent variables was selected for both analytes for further analysis. Then, the PLS models were used for analysis of the eight synthetic mixtures of prediction or test set. The results are also summarized in Table 2.
Performances of the methods were tested with the R2 and root
mean square errors of prediction (RMSEP) using the following equation:
(
)
(
)
2
2 1
2 1
n i i n
i i
y y
R
y y
=
= − =
−
∑
∑
(
)
21
n
i i
i
y y
RMSEP
n
= −
=
∑
where ŷi, –y and yi are the estimated output, average of output and the actual output sets, respectively; and n is the number of the samples in each set. The closeness of R2 and RMSEP to one and zero
respec-tively, indicate that the method is suitable for data analysis. In the PC-ANN model with the 45 calibration samples, R2 for PAC and
PAH were 0.996 and 0.997 and RMSEP were 0.00627 and 0.00281, respectively, whereas in the case of PLS model, R2 for PAC and PAH
were 0.824 and 0.852 and RMSEP were 0.146 and 0.125, respectively. Thus, the PC-ANN model is more suitable for analysis of these data. Furthermore, the results of Table 2 clearly indicate that the accuracy of PC-ANN in analysis of the eight synthetic mixtures is much higher than the PLS model. This is probably due to the large numbers of latent variable that is inevitable for both PLS models because of the interaction of the analytes. In other words, it seems that these interac-tions can be best described by the systems that have more nonlinearity. Consequently, PC-ANN was selected for further studies.
Study of interferences
The effect of some potentially interfering substances on the deter-mination of a mixture of 26.21 µg mL-1 PAC and 27.62 µg mL-1 PAH
by the proposed method was examined at the optimum conditions. The tolerance limit was defined as the maximum concentration of the interfering substances that give a relative error of less than ±5%. The results revealed that the glucose and lactose at mole ratio of 800; Na+,
K+, Mg2+, SO 4
2-, and NO 3
- at mole ratio of 400; L-cysteine at mole
ratio of 300; Cu2+, Zn2+and CO 3
2- at mole ratio of 250; sucrose, Ca2+
and Al3+ at mole ratio of 200 and uric acid and Fe3+ at mole ratio of
100 had no significant interference in the determination of analytes.
Application
The feasibility of the technique for the determination of PAC and PAH in real sample was examined. In order to have a sample resembling the drug, the Ringer’s injection solution a nonpyrogenic and sterile serum solution containing common electrolyte with a variety of clinical uses including fluid and electrolyte replenishment, was spiked with different concentration of PAC and PAH and the procedure with the PC-ANN model given above was followed. The results of eight spiked samples are given in Table 3. The recoveries of the added analytes are good (95.3 to 103.8%) indicating the sui-tability of the method for simultaneous determination of PAC and PAH in this type of sample.
CONCLUSIONS
In this research, a novel kinetic-spectrophotometric method combined with chemometrics interpretation of the results for the simultaneous determination of PAC and PAH based on LSPR peak of Ag-NPs was reported. The method is based on the different rates of the
Table 3. Determination of PAC and PAH in Ringer’s injection solution by the PC-ANN method
Sample PAC (µg mL
-1) PAH (µg mL-1)
Added Founda Recovery (%) Added Founda Recovery (%)
1 1.82 1.81 ± 0.03 99.4 1.08 1.06 ± 0.03 98.1
2 16.95 17.2 1± 0.05 101.5 1.08 1.03 ± 0.01 95.3
3 1.82 1.80 ± 0.02 98.9 14.79 14.36 ± 0.06 97.1
4 16.95 16.72 ± 0.02 98.6 14.79 14.26 ± 0.04 96.4
5 1.82 1.89 ± 0.03 103.8 22.10 22.16 ± 0.01 100.3
6 16.95 17.32 ± 0.08 102.2 22.10 22.02 ± 0.02 99.6
7 40.21 40.46 ± 0.06 100.6 28.54 28.11 ± 0.05 98.5
8 52.31 51.98 ± 0.07 99.4 28.54 28.65 ± 0.02 100.4
a The results are mean of five measurements ± standard deviation.
Table 4. Comparision of figures of merit of the present method with other reported methods for determination of PAC and PAH
Method PAC (µg mL
-1) PAH (µg mL-1)
Ref
LDRb LODc LDRb LODc
RP-HPLC 2-200 - 2-200 - 2
Electrochemicala 0.50-100.0 0.25 0.25-100.0 0.10 11
UV-Visa 5- 65 - 4-80 - 12
Chemiluminescencea 0.03-1.54 0.008 0.08-4.14 0.009 13
LSPR 1.23-58.56 0.039 0.08-30.39 0.025 This work
reactions of PAC and PAH as the reducing agents with [Ag(NH3)2] +
complex ion, in alkaline medium and in the presence of PVP as the stabilizing agent. It was shown that the PC-ANN model is more reliable than PLS for this study. Some of the figures of merit of the proposed method is compared with some other reported methods for the simultaneous determination of PAC and PAH (Table 4). The LOD of the proposed method for the PAH is lower than the most of other methods2,13 and the linear dynamic range for the analytes is wider
than the capillary electrophoresis with on-line chemiluminescence detection.13 However, in compare to the RP-HPLC,10
electrochemi-cal11 and UV-Vis,12 the dynamic linear range of LSPR technique is
narrower. This can be related to the shift in the LSPR peak due to the speed of formation and consequently the change in size and shape of the nanoparticles at high and low concentration of analytes. The main advantages of the proposed method are simplicity, sensitivity, low cost, and ease of operation.
SUPPLEMENTARY MATERIAL
Figures 1S to 6S and Tables 1S to 2S are freely available at http:// quimicanova.sbq.org.br/ in pdf format.
REFERENCES
1. Zhang, Y. J.; Wu, L.; Zhang, Q. L.; Li, J.; Yin, F. X.; Yuan, Y.; J. Ethnopharmacol. 2011, 136, 129.
2. Li, X. P.; Yu, J.; Luo, J. Y.; Li, H. S.; Han, F. J.; Chen, X. G.; Hu, Z. D.; Chem. Pharm. Bull. 2004, 52, 1251.
3. Yu, K.; Wang, Y. W.; Cheng, Y. Y.; Chromatographia2006, 63, 389. 4. Li, Y. J.; Sui, Y. J.; Dai, Y. H.; Chromatographia2008, 67, 335. 5. Tseng, T. H.; Hsu, J. D.; Lo, M. H.; Chu, C. Y.; Chou, F. P.; Huang, C.
L.; Wang, C. J.; Cancer Lett. 1998, 126, 199.
6. Chen, C. Y.; Li, H.; Yuan, Y. N.; Dai, H. Q.; Yang, B.; BMC Complementary Altern. Med.2013, 13. 99.
7. Liu, Q.; Lu, Z.; J. Tongji Med. Univ.1999, 19, 40.
8. Han, J. Y.; Fan, J. Y.; Horie, Y.; Miura, S.; Cui, D. H.; Ishii, H.; Hibi, T.; Tsuneki, H.; Kimura, I.; Pharmacol. Ther.2008, 117, 280.
9. Kang, D. G.; Yun, Y. G.; Ryoo, J. H.; Lee, H. S.; Am. J. Chin. Med. 2002, 30, 87.
10. Jian, Y. H.; Xu, G. J.; Jin, R. L.; Xu, L. S.; J. China Pharm. Univ.1989, 20, 5.
11. Pan, Y.; Zhang, L.; Chen, G.; Analyst2001, 126, 1519.
12. Zhang, H. Y.; Hu, Z. D.; Yang, G. L.; Shi, Z. H.; Sun, H. W.; Chromatographia1999, 49, 219.
13. Han, S.; Liu, E.; Li, H.; J. Pharm. Biomed. Anal. 2005, 37, 733. 14. Melo, J. R.; Mauricio, A.; Santos, L. S. S.; Goncalves, M. C.; Nogueira,
A. F.; Quim. Nova2012, 35, 1872.
15. Sifontes, A. B.; Melo, L.; Maza, C.; Mendes, J. J.; Mediavilla, M.; Brito, J. L.; Zoltan, T.; Albornoz, A.; Quim. Nova2010, 33, 1266.
16. Jain, P. K.; Huang, X.; El-sayed, I. H.; El-sayed, M. A.; Acc. Chem. Res.
2008, 41, 1578.
17. Li, H.; Li, F.; Han, C.; Cui, Z.; Xie, G.; Zhang, A.; Sens. Actuators, B
2010, 145, 194.
18. Shen, X. W.; Huang, C. Z.; Li, Y. F.; Talanta2007, 72, 1432. 19. Baron, R.; Zayats, M.; Willner, I.; Anal. Chem.2005, 77, 1566. 20. Amjadi, M.; Rahimpour, E.; Microchim. Acta2012, 178, 373. 21. Hormozi Nezhad, M. R.; Alimohammadi, M.; Tashkhourian, J.;
Razavian, S. M.; Spectrochim. Acta, Part A 2008, 71, 199.
22. Hormozi Nezhad, M. R.; Karimi, M. A.; Shahheydari, F.; Sci. Iran., Trans. F2010, 17, 148.
23. Zhang, F. X.; Han, L.; Israel, L. B.; Daras, J. G.; Maye, M. M.; Ly, N. K.; Zhong, C. J.; Analyst2002, 127, 462.
24. Thaxton, C. S.; Mirkin, C. A.; DNA-gold-nanoparticle conjugates, in: Nanobiotechnology, Wiley-VCH: Weinheim, 2004.
25. Xiong, D.; Li, H.; Nanotechnology2008, 19, 465502.
26. Afkhami, A.; Sarlak, N.; Zarei, A. R.; Madrakian, T.; Bull.Korean Chem. Soc. 2006, 27, 863.
27. Karimi, M. A.; Mashhadizadeh, M. H.; Mazloum Ardakani, M.; Sahraei, N.; J. Food Drug. Anal. 2008, 16, 39.
28. Bijlsma, S.; Smilde, A. K.; Anal. Chim. Acta1999, 396, 231.
29. Saurina, J.; Hernandez-Cassou, S.; Tauler, R.; Anal. Chem. 1997, 69, 2329.
30. Velasco, A.; Rui, X.; Silva, M.; Perez-bendito, D.; Talanta1993, 40, 1505.
31. Karimi, M. A.; Abdollahi, H.; Karami, H.; Banifatemeh, F.; J. Chin. Chem. Soc. 2008, 55, 129.
32. Rohani Moghadam, M. R.; Dadfarnia, S.; Haji Shabani, A. M.; Shahba-zikhah, P.; Anal. Biochem.2011, 410, 289.
33. Ni, Y.; Liu, C.; Kokot, S.; Anal. Chim. Acta2000, 419, 185. 34. Hasani, M.; Moloudi, M.; J. Hazard. Mater.2008, 157, 161.
35. Mocak, J.; Bond, A. M.; Mitchell, S.; Scollary, G.; Pure Appl. Chem.
1997, 69, 297.
36. Zupan, J.; Gasteiger, J.; Neural network for chemists: an introduction, VCH: Weinheim, 1993.
37. Despangne, F.; Massart, D. L.; Analyst1998, 123, 157R. 38. Gemperline, P. J.; Chemometr. Intell. Lab. Syst. 1992, 15, 115. 39. Sekulic, S.; Seasholtz, M. B.; Wang, Z.; Kowalski, B. R.; Lee, S. E.;
Holt, B. R.; Anal. Chem. 1993, 65, 835A.
40. Singh, K. P.; Ojha, P.; Malik, A.; Jain, G.; Chemometr. Intell. Lab. Syst.
2009, 99, 150.
41. Gerlach, R.W.; Kowalski, B. R.; Wold, H. O. A.; Anal. Chim. Acta1979, 112, 417.
42. Geladi, P.; Kowalski, B. R.; Anal. Chim. Acta1986, 185, l. 43. Ni, Y.; Wang, Y.; Kokot, S.; Food Chem.2008, 109, 431.
44. Martens, H.; NӕS, T.; Multivariate Calibration, Wiley: Chichester, 1989.
45. Khodaveisi, J.; Dadfarnia, S.; Haji Shabani, A. M.; Rohani Moghadam, M.; Hormozi Nezhad, M. R.; Spectrochim. Acta, Part A 2015, 138, 474. 46. Stone, M.; Journal of the Royal Statistical Society: Series B1974, 36,