Article
Printed in Brazil - ©2017 Sociedade Brasileira de Química0103 - 5053 $6.00+0.00*e-mail: [email protected]
Femtoliter Scale Detection of an Antithyroid Drug Using Gold Nanoparticles in a
Microfluidic Chip
Atefeh Abbasi-Ahd, Nader Shokoufi,* Sara Adeleh and Kazem Kargosha
Analytical Instrumentation and Spectroscopy Lab, Department of Green Technologies, Chemistry & Chemical Engineering Research Center of Iran (CCERCI), Pazhuhesh Blvd.,
17th km of Tehran-Karaj Highway, 14968-13151 Tehran, Iran
Sensitive detection of methimazole (MMI) at the femtoliter (fL) scale has been achieved based on photo thermal lensing of gold nanoparticles (GNPs). GNPs were used because their surface plasmon resonance (SPR) have absorption in visible range. A combined glass microfluidic chip-photo thermal lens microscopy (MFC-PTLM) system with appropriate laser source was assembled for detection of MMI with GNPs. The thiol group of MMI bound to the surface of GNPs and created the core-shell form and reduced the surface plasmon resonance of GNPs as a consequence the PTLM signal of GNPs decreased following the increase of MMI concentration. The results showed that the changes of PTLM signal in the focal volume of 2.68 fL were proportional to the concentration of MMI over the range of 75-900 × 10-9 mol L-1. The obtained detection limit of this method was 46.5 × 10⁻⁹ mol L-1 and the relative standard deviation for ten repeated measurements of 550 × 10-9 mol L-1 MMI solutions was 3.47%. The developed method was successfully applied for determination of MMI in human serum and pharmaceutical samples.
Keywords: methimazole, gold nanoparticle, glass microfluidic chip, surface plasmon resonance, photo thermal lens microscopy
Introduction
In the last decade, there is a great interest in analytical miniaturized systems on microchips, and on chip integrated systems for different chemical processes like mixing, reactions and detection are on rapid progress.1 The
advantage of miniaturized integrated systems include less sample volume and reagent consumption, more effective reaction because of large ratio of surface-to-volume and lower cost. These benefits lead the microchip technology to the various applications like analytical procedures and chemical analysis.2
Generally, spectroscopic detection methods are utilized for on-chip detection. The laser-induced fluorescence (LIF) method is the most sensitive one. As an example of its application, single-molecule detection in a microchannel has already been reported.3 However, mostly molecules with
low fluorescence yield cannot be detected by this method. Despite of the wide applicability of spectrophotometry, due to the shorter optical path length compared to the conventional cuvettes they are not suit for measurement in a microchannel.4
The photo thermal lens is a technique based on measurement of the temperature rise which is generated in an illuminated matrix because of non-radiative relaxation of absorbed energy from a laser. The advantages of this technique are not only limited to its high-sensitivity but also comprise other unique specifications like ability of low sample volume measurement and dependency on the thermo optical behavior of solvents.5,6 Photo thermal lens
microscopy (PTLM) is a sort of photo thermal spectrometry in which a microscope is used to introduce the lights to the sample. This makes it ideal for low detection volume measurements in a microchannel.
There are some reports that PTLM was utilized for various microchip analyses including capillary electrophoresis and immunoassay.7-10
Methimazole (1-methyl-2-mercaptoimidazole) (MMI) is an antithyroid agent (Figure 1). It inhibits the production of thyroid hormone which are produced and released by the thyroid gland and regulate the body’s metabolism. Moreover, MMI is illegally applied to cattle as a fattening agent and leads to the reduction of the meat quality.11
in different areas such as clinical chemistry, nutrition and pharmaceutical formulations. Several analytical procedures have been described for the determination of MMI including gas chromatography-mass spectrometry
(GC-MS),13 high performance liquid chromatography
(HPLC) and HPLC-mass spectrometry,14-16 capillary
electrophoresis,17,18 thin layer chromatography (TLC),19
flow injection spectrophotometry,20 potentiometry
and voltammetry,21-24 resonance light scattering
spectroscopy,25 fluorimetry,26,27 chemiluminescence,12,28
electrochemiluminescence,29 spectrophotometry30 and
derivative spectrophotometry.31 However, no studies
have been reported on the determination of MMI using microfluidic chip-PTLM. In the present study, for the first time, the concentration of MMI as an anti-thyroid medicine was determined by a gold nanoparticles (GNPs) assisted method in a glass microfluidic chip-PTLM.
Experimental
Reagents and solutions
Tetrachloroauric(III) acid trihydrate (HAuCl4.3H2O,
99.5%) and trisodium citrate were purchased from Merck. Methimazole was obtained from Sigma-Aldrich. Sample tablet (5 mg methimazole per tablet) commercially purchased from Alhavi Pharmacy Ltd. and Loghman pharmaceutical and hygienic Co. EDTA tubes were purchased from Ayset Company.
Apparatus
UV-Vis absorption spectra were obtained with Array spectrophotometer Photonix Ar 2015 (Iran) and Ocean Optic QE65000 (USA). Transmission electron microscopy (TEM) image was recorded with a Jeol 2200fs FEG TEM equipped
to omega filter and energy dispersed spectroscopy (EDS) (Japan). pH of solutions were measured with a Metrohm 780 (Switzerland). Two microfluidic pumps from Lambda VIT-FIT (Switzerland) were utilized for liquid flow controlling.
Fabrication of microfluidic chip
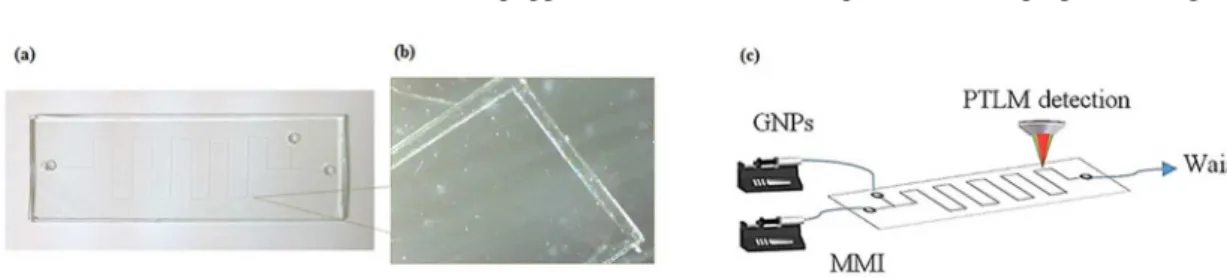
The chip was fabricated by three glass plates (25 × 76 mm), i.e., the bottom, middle, and cover plates with thicknesses of 500, 100 and 500 µm, respectively. Three small access holes (with diameter of 0.5 mm) were mechanically bored into the cover glass (two for inlet and one for outlet). Microchannels were made in the middle plate by wet etching.32 Three plates were bound without
any adhesive by just thermal fusion process at 650 °C for 4 hours. The formed S-type microchannel in the glass chip was 100 µm in depth, 150 µm in width and 19.5 cm in length (Figures 2a and 2b).
Experimental setup
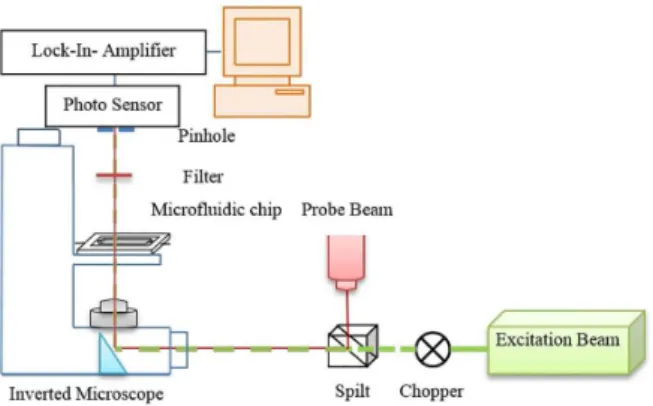
Figure 3 illustrates the experimental setup of PTLM. Briefly, the PTLM was consisted of an inverted microscope (IMM-420, SAIRAN) equipped with two lasers and other optical devices. The excitation beam was a 50 mW diode solid-state laser with an emission line of 532 nm which was modulated with a mechanical chopper. The modulation frequency was 500 Hz. A 5 mW laser 652 nm were used as probe beam. The two beams were coaxially aligned with a 50% beam splitter and introduced into an inverted microscope. Magnification and numerical aperture of the objective lens were 20× and 0.4, respectively. After passing through the sample in the microfluidic channel with the path length of 100 µm, the excitation laser was cut by an interference filter. The probe beam was diverged and after passing through a pinhole was detected by a photodiode connected to a lock-in-amplifier (SRS-10, Stanford Research Instruments). The time constant of the lock-in amplifier was 10 ms.
Preparation of GNPs and methimazole
Gold nanoparticles were prepared using the classical
citrate reduction method.33 All utilized glassware were
washed with aqua regia (3:1 HCl/HNO3) and rinsed
with deionized water and acetone, and dried prior to use. Briefly, in a 250 mL round bottom flask equipped with a condenser, a 50 mL solution containing 1 × 10⁻³ mol L-1 of
HAuCl4.3H2O was prepared and heated under reflux. At
the boiling point, 5.0 mL of 0.04 mol L-1 sodium citrate
solution was quickly added into the stirring solution. It was boiled for additional 20 minutes. The color of solution became deep red. Then the solution was cooled down to room temperature and stored at 4 °C. The gold colloid was characterized by UV-Vis spectra with maximum absorption of 520 nm and dynamic light scattering (DLS) revealed a particle diameter of 13 nm.
Moreover, according to the Beer’s law, the GNPs concentration in the stock solution was determined to be 6.7 × 10⁻⁹ mol L-1 using an absorption coefficient of
2.7 × 108 cm-1 M-1 at 520 nm for GNPs of 13 nm diameter.33
In order to avoid the adsorption of colloid gold particles in glassware, the GNPs solutions were diluted and placed into a plastic tube.
Appropriate amount of MMI standard sample was directly dissolved in water to prepare stock solution of 100 × 10-6 mol L-1 and stored at 0-4 ºC. The working
solutions were then prepared by appropriate dilution of that.
General procedure
A 1.67 × 10⁻⁹ mol L-1 GNPs solution and MMI solution
by the same flow rate were introduced to the microchannels by microsyringe pumps (Figure 2c). The mixture was detected with a PTLM system.
Procedure for pharmaceutical and human serum samples
Two types of pharmaceutical tablets, labeled 5 mg MMI per tablet were used for analysis. Six tablets of each were powdered and dissolved in deionized water to form
a solution of 100 µmol L-1, the mixture was filtered with
0.22 µm membrane filters. The sample solution was then diluted and detected according to the general procedure with seven replicates for each sample. In order to evaluate the accuracy of method, another quantity of MMI standard were added to the sample solution and dissolved for recovery tests.
The blood sample, obtained from healthy volunteer, was collected. Then, 10.0 mL of collected sample was poured in commercially available EDTA tubes. It was vortexed for one minute and then centrifuged for 10 minutes at 5,000 rpm. The supernatant, including proteins and amino acids was collected as the source of plasma. In order to eliminate the proteins and prepare the serum sample, the plasma then was mixed with 10 mL of acetonitrile and was centrifuged at 5000 rpm for 10 min. The resulted supernatant was then filtered (0.22 µm pore size membrane filter). The obtained solution was diluted 5 fold with water and MMI with different concentrations was added to that.
Results and Discussion
Characteristics of PTLM signal
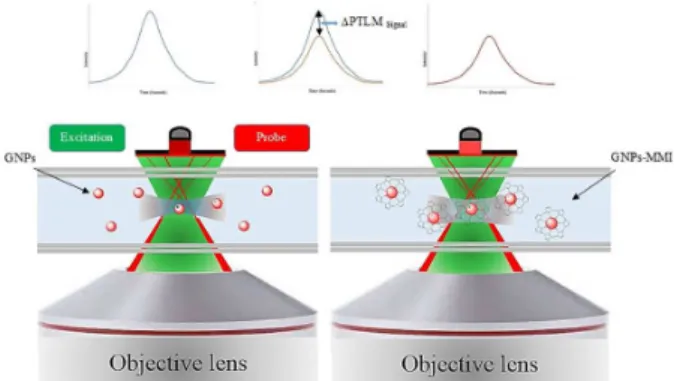
The thiol group of MMI bound to the surface of GNPs and created the core-shell form and reduced the surface plasmon resonance of GNPs as a consequence the PTLM signal of GNPs decreased following the increase of MMI concentration. The difference between the sample and blank signal was calculated as a ∆PTLM signal (Figure 4). The detection volume of the PTLM can be calculated based on the theory of thermal lens.34 The focal volume of
the excitation beam and the number of molecules in this detection volume can be estimated from equations reported in the literature.35 Accordingly, the focal volume of PTLM
and the number of GNPs at this focal volume is calculated to be 2.68 fL (f = 10-15) and 2.7 GNPs respectively.
Density of MMI molecule bound to the surface of a GNP was estimated using equation 1:
(1)
where N0 is the Avogadro constant, CMMI the concentration
of methimazole (mol L-1), D the diameter of GNPs (nm),
np the number of GNPs and V is the sample volume (detection
volume) (L).36
Through the density calculation, for a 500 × 10-9 mol L-1
sample solution of MMI, each nanoparticle was surrounded by about 300 molecules of MMI. So according
to the number of GNPs in this detection volume, the total number of measured MMI molecules estimated to be about 810.
Transmission electron microscopy
TEM was used to proof the aggregation condition of the MMI-capped GNPs. As Figure 5a shows, at pH value of 6.5, the GNPs have a mono-dispersed form in the absence of methimazole. But the slight aggregation of GNPs spices appears in presence of MMI at pH 6.5 (Figure 5b). In contrary, for the same concentration of MMI at the pH value of 3 an intense aggregation of GNPs was observed which is due to the hydrogen bonding of MMI molecules (Figure 5c).
Optimization of the general procedures
Effect of pH
The effect of pH (3-10) was investigated on the PTLM signal. MMI has pKa value of 11.64 due to its thiol group, so the MMI-capped GNPs have negative charge at pH 8.97. Due to the negative charges, the repulsive electrostatic interaction between the particles enhanced, as a result prevent the aggregation of GNPs.
In the lower pH-value hydrogen bonding is more responsible for the aggregation. As a result of hydrogen bonding of MMI molecules and the remarkable cross-linking of GNPs, an intense aggregation and a red shift will occur. This will result decrease of the absorption amount around 532 nm and as a consequence the reduction of ∆PTLM signal. In addition, extreme aggregation makes the colloidal solution which may block the channel and also is not suitable for light passing measurements.
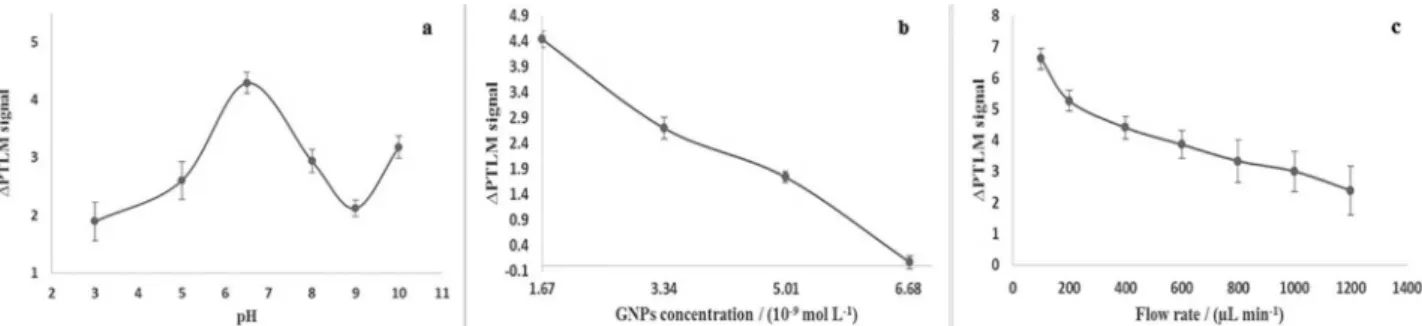
According to Figure 6a, the maximum ∆PTLM signal was found at a pH of 6.5, so the pH of medium was adjusted to that.
The obtained result for PTLM measurements at various pH-values is fully matched with the TEM results which are presented in Figure 6.
Effect of GNPs concentration
The GNPs concentration is an important parameter which has a critical role in sensitivity of method. As illustrated in Figure 6b, upon the increase of GNPs concentration, the ∆PTLM signal starts to be decreased. This negative effect for the higher concentration of GNPs is probably due to the proportion of GNPs and MMI. By increasing the concentration of GNPs, for each particle the density of surrounded MMI reduced and since the GNPs solution is used as blank, so the difference will be less.
Therefore, the concentration of 1.67 × 10⁻⁹ mol L-1
GNPs was chosen as the optimum concentration in which the maximum ∆PTLM signal was achieved.
Effect of flow rate
Dependency of photo thermal lens signal intensity on the flow rate has been reported before.37 The flow rates of
sample were optimized in the range of 100-1200 µL min-1.
(Figure 6c) Signal stated to be decreased following the increase of flow rate which result the heat loss because of mass transfer from the point irradiated by the excitation beam so thermal lens quickly dissipates and disappears.
Figure 5. TEM image of: (a) gold nanoparticles, at pH 6.5; (b) GNPs + 500 × 10-9 mol L-1 MMI, at pH 6.5; (c) GNPs + 500 × 10-9 mol L-1 MMI, at pH 3; all of the concentrations of GNPs solutions were 1.67 × 10⁻⁹ mol L-1.
Flow rate of 200 µL min-1 was chosen for the best
conformity with sensitivity and throughput of sample. Both sample and GNPs solution were introduced at the same flow rate (200 µL min-1) by two microsyringe pumps (Figure 2c).
The chip can be reused after washing it by using aqua regia, acetone and doubled distilled water.
Analytical performances
A series of MMI concentrations were prepared for drawing the calibration curves. A calibration graph of ∆PTLM signal versus the MMI concentration is presented in Figure 7. The obtained range of linearity and detection limit is equal to the MMI concentration range of 75-900 × 10-9 and 46.5 × 10⁻⁹ mol L-1,respectively. The
relative standard deviation for ten repeated measurements of 550 × 10-9 mol L-1MMI solution was 3.47%.
In comparison with the other methods for MMI determination, despite of very low sample and detection volume, the proposed method has nanomolar detection limit which is well comparable with the most of other reported methods (Table 1). In fact, the S-type form of microfluidic channel and the microspace scale of that enhanced the surface interaction of MMI molecules and GNPs, results more effective reaction.
Interferences study
To apply the developed method for MMI determination in complex real samples, the effect of some potential interference compounds like sugars, amino acids and metal ions were evaluated. A standard sample solution of MMI (500 × 10-9 mol L-1) was analyzed in presence of the
extra amounts of coexisting substances. A compound was considered as non-interfering if the variation of its PTLM signal was ± 5% in comparison with the obtained signal in the absence of that.
The tolerable concentration ratios of foreign species
Figure 6. Effect of experimental conditions on ∆PTLM signal (a) effect of pH, GNPs (1.67 × 10⁻⁹ mol L-1) in the presence of 500 × 10-9 mol L-1 MMI; (b) effect of GNPs concentration on the detection of 500 × 10-9 mol L-1 of MMI in pH 6.5; (c) effect of flow rate. Conditions: 1.67 × 10⁻⁹ mol L-1 of GNPs; pH 6.5; 500 × 10-9 mol L-1.
Figure 7. Calibration curve for standard MMI in the concentration range of 75-900 × 10-9 mol L-1.
Table 1. Comparison of this method with other reported methods for determination of MMI
Method Linear range / (mol L-1) Detection limit / (mol L-1) Reference
Flow injection-chemiluminescence 17.0-870.0 × 10⁻⁶ 8.8 × 10⁻⁶ 28
Flow injection-spectroscopy 10.0-500.0 × 10⁻⁶ 3.0 × 10⁻⁶ 20
HPLC-spectrocopy 2.0-10.0 × 10⁻⁶ 1.0 × 10⁻⁶ 14
Potentiometric 1.0-700.0 × 10⁻⁶ 0.5 × 10⁻⁶ 21
Capillary electrophoresis 0.1-200.0 × 10⁻⁶ 50.0 × 10⁻⁹ 18
Chemiluminescence 50.0 × 10⁻⁹-50.0 × 10⁻⁶ 16.0 × 10⁻⁹ 12
Fluorescence assay 8.0-375.0 × 10⁻⁹ 5.5 × 10⁻⁹ 26
MFC-PTLM 75.0-900.0 × 10⁻⁹ 46.5 × 10⁻⁹
for MMI concentration range of 500 × 10-9 mol L-1were
over 100-fold for Na+, K+, Cl−, SO
42−, NO3−, 20-fold for
starch, dextrin, alanine and 5-fold for glucose, sucrose and fructose. Despite of that, cysteine and other thiol-containing amino acids with the similar concentration had ability to increase the ∆PTLM signal. Therefore, as described before, these kinds of amino acids in blood samples were eliminated.
Analysis of real sample
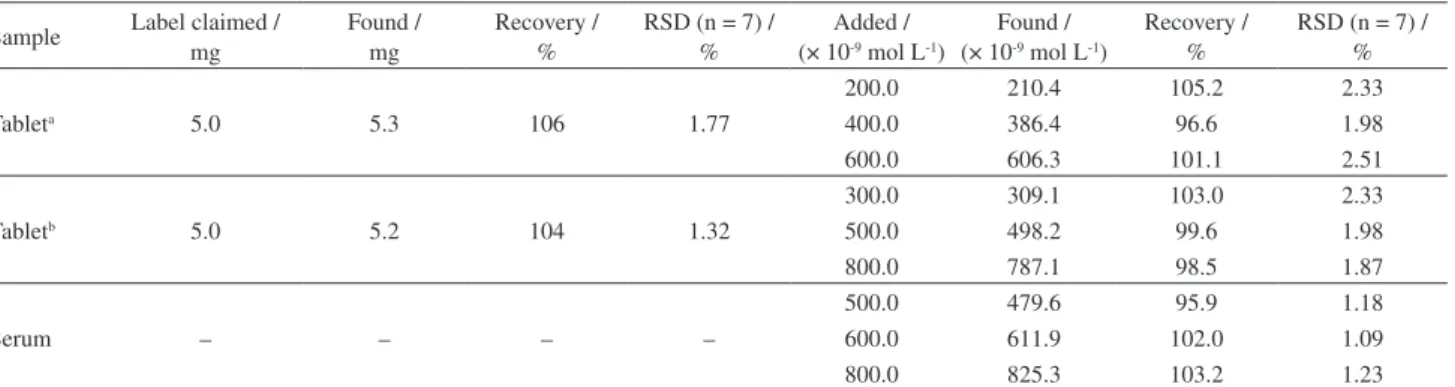
The applicability of optimized method for determination of MMI in human serum and pharmaceutical sample was investigated. The obtained results for both commercial pharmaceutical tablets and human serum are summarized in Table 2. It shows the potential of the developed method for MMI determination in real samples.
Conclusions
In this work, we have proposed a simple and sensitive method for determination of methimazole, based on photo thermal lensing of GNPs in a glass microfluidic chip. The S-type form of microchannel and the micro space scale of that enhanced the surface interaction of MMI molecules and GNPs, results more effective reaction.
The developed method was successfully applied for analysis of MMI in detection volume of 2.68 fL and provides us a good linear relationship in low concentration range with detection limit of 46.5 × 10⁻⁹ mol L-1.
In addition to the fast interaction time and low detection volume, automation, reusability, acceptable accuracy and good reproducibility are the other achievement of developed method.
The results show the capability of method for sensitive measurement of MMI in human serum sample and pharmaceutical tablets.
Acknowledgments
The authors are grateful to the support from the Iran National Science Foundation (INSF) and Chemistry & Chemical Engineering Research Center of Iran (CCERCI) and also would like to thank Prof Ali Baghizadeh for his support for TEM tests.
References
1. Reyes, D. R.; Iossifidis, D.; Auroux, P.-A.; Manz, A.; Anal. Chem. 2002, 74, 2623.
2. Yamauchi, M.; Mawatari, K.; Hibara, A.; Tokeshi, M.; Kitamori, T.; Anal. Chem. 2006, 78, 2646.
3. Goesch, M.; Blom, H.; Holm, J.; Heino, T.; Rigler, R.; Anal. Chem. 2000, 72, 3260.
4. Mawatari, K.; Naganuma, Y.; Shimoide, K.; Anal. Chem. 2005,
77, 687.
5. Franko, M.; Tran, C. D. In Encyclopedia of Analytical Chemistry; Meyers, R. A., ed.; John Wiley & Sons: New Jersey, 2010.
6. Shokoufi, N.; Yoosefian, J.; J. Ind. Eng. Chem. 2016, 35, 153. 7. Zheng, J.; Odake, T.; Kitamori, T.; Sawada, T.; Anal. Chem.
1999, 71, 5003.
8. Minagawa, T.; Tokeshi, M.; Kitamori, T.; Lab Chip 2001, 1, 72. 9. Shimizu, H.; Mawatari, K.; Kitamori, T.; Anal. Chem. 2010,
82, 7479.
10. Sato, K.; Tokeshi, M.; Odake, T.; Kimura, H.; Ooi, T.; Nakao, M.; Kitamori, T.; A n a l . C h e m . 2 0 0 0, 7 2, 1144.
11. Martinez-Frias, M. L.; Cereijo, A.; Rodriguez-Pinilla, E.; Urioste, M.; Lancet 1992, 339, 742.
12. Sheng, Z.; Han, H.; Yang, G.; J. Lumin. 2011, 26, 196. 13. Batjoens, P.; de Brabander, H. F.; de Wasch, K.; J. Chromatogr.
A 1996, 750, 127.
14. Zakrzewski, R.; J. Chromatogr. B:Anal. Technol. Biomed. Life Sci. 2008, 869, 67.
Table 2. Determination of MMI in pharmaceutical tablets and human serum sample
Sample Label claimed / mg
Found / mg
Recovery / %
RSD (n = 7) / %
Added / (× 10-9 mol L-1)
Found / (× 10-9 mol L-1)
Recovery / %
RSD (n = 7) / %
Tableta 5.0 5.3 106 1.77
200.0 210.4 105.2 2.33
400.0 386.4 96.6 1.98
600.0 606.3 101.1 2.51
Tabletb 5.0 5.2 104 1.32
300.0 309.1 103.0 2.33
500.0 498.2 99.6 1.98
800.0 787.1 98.5 1.87
Serum – – – –
500.0 479.6 95.9 1.18
600.0 611.9 102.0 1.09
800.0 825.3 103.2 1.23
15. Meulemans, A.; Manuel, C.; Ferriere, C.; Valpillat, M.; J. Liq. Chromatogr. Relat. Technol. 1980, 3, 287.
16. Kuśmierek, K.; Bald, E.; Talanta 2007, 71, 2121.
17. Wang, A.; Zhang, L.; Zhang, S.; Fang, Y.; J. Pharm. Biomed. Anal. 2000, 23, 429.
18. Sun, J.; Zheng, C.; Xiao, X.; Niu, L.; You, T.; Wang, E.;
Electroanalysis 2005, 17, 1675.
19. Aletrari, M.; Kanari, P.; Partassides, D.; Loizou, E.; J. Pharm. Biomed. Anal. 1998, 16, 785.
20. Sanchez-Pedreno, C.; Albero, M. I.; Garcia, M. S.; Rodenas, V.; Anal. Chim. Acta 1995, 308, 457.
21. Aslanoglu, M.; Peker, N.; J. Pharm. Biomed. Anal. 2003, 33, 1143.
22. Hollosi, L.; Kettrup, A.; Schramm, K. W.; J. Pharm. Biomed. Anal. 2004, 36, 921.
23. Shahrokhian, S.; Ghalkhani, M.; Electroanalysis 2008, 20, 1061. 24. Yazhen, W.; Bioelectrochemistry 2011, 81, 86.
25. Liu, X.; Yuan, H.; Pang, D.; Cai, R.; Spectrochim. Acta, Part A
2004, 60, 385.
26. Farzampour, L.; Amjadi, M.; J. Lumin. 2014, 155, 226. 27. Dong, F.; Hu, K.; Han, H.; Liang, J.; Microchim. Acta 2009,
165, 195.
28. Economou, A.; Tzanavaras, P. D.; Notou, M.; Themelis, D. G.;
Anal. Chim. Acta 2004, 505, 129.
29. Hua, L.; Han, H.; Chen, H.; Electrochim. Acta 2009, 54, 1389. 30. Dong, C.; Zhang, Y.; Guo, L.; Li, Q.-m.; J. Anal. Chem. 2010,
65, 707.
31. El-Bardicy, M. G.; El-Saharty, Y. S.; Tawakkol, M. S.; Spectrosc. Lett. 1991, 24, 1079.
32. Henry, C. S.; Microchip Capillary Electrophoresis: Methods and Protocols, vol. 339; Springer Science & Business Media: Berlin, 2006.
33. Zhang, F.; Zeng, L.; Zhang, Y.; Wang, H.; Wu, A.; Nanoscale
2011, 3, 2150.
34. Bialkowski, S.; Photothermal Spectroscopy Methods for Chemical Analysis, vol. 134; John Wiley & Sons: New York, 1996.
35. Tokeshi, M.; Uchida, M.; Uchiyama, K.; Sawada, T.; Kitamori, T.; J. Lumin. 1999, 83, 261.
36. de Liu, Z.; Huang, C. Z.; Li, Y. F.; Long, Y. F.; Anal. Chim. Acta
2006, 577, 244.
37. Dovichi, N. J.; Harris, J. M.; Anal. Chem. 1981, 53, 689.
Submitted: November 28, 2016