química
www.scielo.br/ eq
Volume 35, número 3, 2010 Art igo/ Art icle
SPECTROPHOTOMETRIC DETERMINATION OF
NEVIRAPINE USING TETRATHIOCYANATOCOBALT(II)
ION AS A REAGENT
T. V. Sreevidya & B. Narayana*
Department of Post-Graduate Studies and Research in Chemistry, Mangalore University, Mangalagangotri-574 199,
Karnataka, INDIA. * E-mail: [email protected]
Abstract: A simple and rapid spectrophotometric method for the determination of nevirapine is described. The method is based on the reaction of nevirapine with tetrathiocyanatocobalt(II) ion in buffer of pH 4 to form the corresponding complex. Beer ’s law is obeyed in the range of 0.2 – 2.0 μg mL-1 for nevirapine. The optical parameters such as molar absorptivity, Sandell’s
sensitivity, detection limit and quantitation limit were found to be 1.16× 10⁴ Lmol-1cm-1, 2.09 X 10⁻³ μg cm-2, 0.073 μg mL-1 and 0.222 μg mL-1 respectively. The optimum reaction conditions
and other analytical parameters were evaluated. The statistical evaluation of the method was examined by determining intra-day and inter-day precision. The proposed method has been successfully applied for the determination of nevirapine in pharmaceutical formulations.
Keywords: Spectrophotometry, Nevirapine, Tetrathiocyanatocobalt(II) ion.
Introduction
Nevirapine (NVP) chemically 11-cyclopropyl-4-methyl-5,11-dihydro-6H -dipyrido[3,2-b:2′,3′-e][1,4]diazepin-6-one, is a non-nucleoside reverse transcriptase inhibitor (NNRTI) class of antiretrovirals used for the tre-atment of HIV-1 infections and AIDS [1-3]. Ne-virapine is structurally a member of the dipyrido-diazepinone chemical class of compounds. It is used in resource poor areas and it is available as a part in generic drug combinations. It is an in-ducer of cytochrome P450 isoenzymes CYP3A4 and CYP2B6 [4,5]. Nevirapine in triple combi-nation therapy has been shown to suppress viral load effectively when used as initial antiretrovi-ral therapy [6,7]. It is a potent and selective non--competitive inhibitor of reverse transcriptase,
restric-tions), which hasmeant that it is a particularly successful anti-HIV treatmentfor young children.
Several analytical techniques have been reported for the determination of nevirapine [15-25]. The method in the United States Pharmaco-poeia (USP)—monograph for determining nevira-pine and its related compounds, A and B—uses a reversed-phase separation with UV detection [26]. The method calls for a 4.6 × 150 mm column pa-cked with L60 (spherical, porous silica gel, 10 øm or less in diameter, the surface of which has been covalently modified with alkyl amide groups and endcapped). Due to the strong retention of impuri-ty C, the separation requires about 30 minutes. In the present work we discuss a rapid spectropho-tometric method for the routine determination of nevirapine using tetrathiocyanatocobalt(II) ion as a reagent in pure and dosage forms.
Experimental
Apparatus
A Shimadzu UV-2550 UV-VIS Spectro-photometer with 1cm matched quartz cells was used for absorbance measurements.
Reagents and Solutions
All chemicals used were of analytical rea-gent grade. NVP drug was obtained as gift sample from SeQuent Scientifi c Ltd, Mangalore. Com-mercial tablets containing 200 mg were used for the study of dosage forms.
A 1000 μg mL-1 standard drug solution was
prepared by dissolving 0.1g of NVP in alcohol di-luting to the mark in a 100 mL standard fl ask. For the calibration samples, a working solution was prepared by appropriate dilution of the stock con-centration in ethanol. Buffer of pH 4 was prepared by transferring one buffer tablet of pH 4 in 100
Procedure
Determination of nevirapine using
tetrathiocyanatocobalt(II) ion
Different aliquots containing 0.2 - 2.0 μg mL-1 of NVP were transferred into a series of 10
mL standard fl asks using a micro burette. To this 4 mL of tetrathiocyanatocobalt(II) ion solution was added followed by 2 mL of pH 4 buffer solution. The contents were shaken well and set aside for 10 minutes and diluted up to the mark with distil-led water and mixed well. The absorbance of each solution was measured at 624.5 nm against the corresponding reagent blank.
Assay of formulations
To determine the content of nevirapine in conventional tablets (label claim: 200 mg/tablet), the tablets were powdered and powder equivalent to 100 mg of nevirapine was weighed. The drug from the powder was extracted with ethanol. To ensure complete extraction of the drug, it was so-nicated for 30 min and volume was made up to 100 mL. The analysis was repeated in triplicate. The possibility of excipients interference in the analysis was studied.
Results and Discussion
The method involves the reaction of NVP with TTC in pH 4 to form a complex [Scheme 1], which has an absorption maximum at 624.5 nm [Fig. 1].
Analytical Data
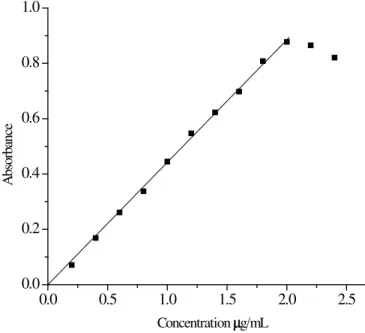
The adherence of Beer’s law was studied by measuring the absorbance values of the solutions va-rying analyte concentration [Fig. 2]. A linear relation was found between absorbance at max and concen-tration ranges given in table 1. Regression analysis of Beer’s law data using the method of least squares were made to evaluate the slope (a), intercept (b) and correlation coeffi cient (R), for each system of NVP and are also presented in table 1. Sensitivity parameters such as molar absorptivity, Sandell’s sen-sitivity, detection limit and quantifi cation limit are also compiled in table 1. The limit of detection and quantitation are calculated according to ICH guidelines.
0.0 0.5 1.0 1.5 2.0 2.5
0.0 0.2 0.4 0.6 0.8 1.0
A
bs
or
bance
Concentration µg/mL
Figure 2. Adherence of Beer’s law
Table 1. Analytical parameters
Parameters Nevirapine (NVP)
max (nm) 624.5
Beer’s law limits (μg mL-1) 0.2 – 2.0 Molar Absorptivity (L mol-1 cm-1) 1.16× 10⁴ Sandell’s sensitivity (μg cm -2) 2.09 × 10⁻³ Limit of detection** (μg mL-1) 0.073 Limit of quantifi cation** (μg mL-1) 0.222
Regression equation* y = ax + b
Slope (a) 0.4508
Intercept (b) -0.0135
Correlation coeffi cient (R) 0.9993
* y is the absorbance and x is the concentration in μg mL-1
** Calculated using ICH – Guidelines
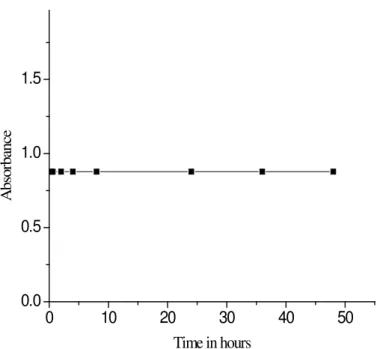
Stability of the Complex
An aliquot containing 2 μg mL-1 (2 mL) of
NVP was pipetted from the stock solution of NVP (10 μg mL-1) into a 10 mL calibrated fl ask. To this
0 1 2 3 4 5 6 0.0
0.1 0.2 0.3 0.4 0.5 0.6 0.7
A
bs
or
banc
e
Volume of CTC added (mL)
Figure 3. Optimum concentration of reagent TTC
Optimum Volume of Reagent
An aliquot containing 2 μg mL-1 (2 mL) of
NVP was pipetted out from the stock solution of NVP (10 μg mL-1) into a 10 mL calibrated fl ask
along with 2 mL of buffer solution of pH 4. Then it was mixed with TTC in the order of 0.5 mL, 1 mL, 2 mL, 3 mL, 4 mL, 5 mL and 6 mL. The com-plexes were made up to 10 mL and absorbance was measured at 624.5 nm. It was found that the volume between 4 and 6 mL is optimum volume of the reagent to get the maximum absorbance and 4 mL was chosen for the experiment [Fig. 4].
0 10 20 30 40 50
0.0 0.5 1.0 1.5
A
b
so
rb
an
ce
Time in hours
Figure 4. Stability of NVP-TTC complex
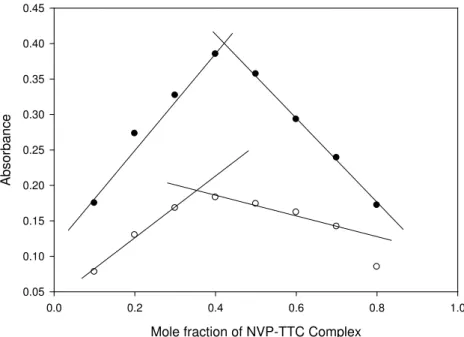
Stability Constant of the Complex
(Turner-Anderson Method)
Mole fraction of NVP-TTC Complex
0.0 0.2 0.4 0.6 0.8 1.0
Absor
b
ance
0.05 0.10 0.15 0.20 0.25 0.30 0.35 0.40 0.45
Figure 5. Continuous variation graph for TTC-NVP Complex
Method Validation
The proposed method is applied to the as-say of NVP in three commercially available dieta-ry supplements. An aliquot containing 1.2 μg mL-1
drug solution is taken and assayed according to the proposed methods. The content of the tablet formulation is calculated by applying suitable di-lution factor. The proposed methods are checked by a thorough analysis of each spiked sample and the results are compiled in table 3 .The accuracy and reliability of the proposed method are fur-ther established by performing recovery studies. The relative error and relative standard deviation indicate the high accuracy and precision for the method and are compiled in table 2. For a better picture of reproducibility on a day- to-day basis, a series of experiments are performed in which standard drug solution at three levels is determi-ned each day for fi ve days with all solutions being prepared afresh each day. The day-to-day relative standard deviation values represent the best ap-praisal of the method in routine use.
Table 2. Evaluation of accuracy and precision
Amount taken (μg mL-1)
Amount found* (μg mL-1)
SD (μg mL-1)
RE (%)
RSD (%)
0.4 0.401 0.002 0.15 0.379
0.6 0.602 0.002 0.23 0.417
0.8 0.801 0.002 0.05 0.287
1.0 1.003 0.006 0.34 0.604
1.2 1.202 0.008 0.17 0.696
1.4 1.404 0.009 0.29 0.637
1.6 1.604 0.006 0.25 0.341
1.8 1.802 0.013 0.11 0.724
* Average of fi ve determinations
SD- Standard deviation, RE- Relative error, RSD-Relative standard deviation
Interference Study
In pharmaceutical analysis, it is important to test the selectivity towards the excipients and fi llers added to the pharmaceutical preparations. Several species which can occur in the real samples together with drug were investigated. The level of interference was considered acceptable. Commonly encounte-red excipients such as talc, starch, glucose etc did not interfere in the determination.
Applications
The proposed methods were applied to the determination of NVP in three commercial dietary supplements (tablets). An aliquot containing 1.2 μg mL-1 drug solution was taken and assayed according
to the proposed methods. The content of the tablet formulation was calculated by applying suitable di-lution factor. The accuracy of the proposed method was checked by a thorough analysis of each spiked sample and the results are compiled in table 3. The accuracy and reliability of the methods were further ascertained by recovery studies.
Table 3. Results of assay of formulations by the proposed method
Brand name of tablet Labeled amount (mg) Found* ± SD (mg)
Nevimunea 200 200.25 ± 0.008
Nevipanb 200 200.59 ± 0.045
Neviretroc 200 198.25± 0.016
*Mean value of three determinations;
Conclusions
Simple spectrophotometric method for the determination of NVP have been developed and validated according to ICH guidelines. The me-thod is simple and easy to perform compared to other existing methods and do not entail any rigo-rous experimental variables which affect the relia-bility of the results. The ingredients usually pre-sent in the pharmaceutical formulations of these drugs seldom interfere in the proposed methods. The proposed method is simple, accurate and easy to perform and can be used for the routine deter-mination of NVP in bulk and in dosage forms.
References
[1] S. Staszewski, J. Morales-Ramirez, K. T. Tashima, A. Rachlis, D. Skiest, J. Stanford, R. Stryker, P. Johnson, D. F. Labriola, D. Farina, D. J. Manion, N. M. Ruiz, N. Engl. J. Med. 341(1999) 1865.
[2] J. S. G. Montaner, P. Reiss, D. Cooper, S. Vella, M. Harris, B. Conway, M. A. Wainberg, D. Smith, P. Robinson, D. Hall, M. Myers, J. M. A. Lange, JAMA, 279 (1998) 930. [3] D. Podzamczer, E. Ferrer, E. Consiglio, J. M. Gatell, P. Perez, J. L. Perez, E. Luna, A. Gonzalez, E. Pedrol, L. Lozano, I. Ocana, J. M. Llibre, A. Casiro, M. Aranda, P. Barrufet, J. Martinez-Lacasa, J. M. Miro, X. Badia, A. Casado, S. Lupo, P. Cahn, M. Manos, J. Estela, Antivir Ther. 7 (2002) 81. [4] L. I. Malaty, J. J. Kupper, Drug Sar. 20(1999)147. [5] D. Back, S. Gibbons, S. Khoo, J. Acquir. Immune Defic. Syndr. 34 (2003) S8–14.
[6] R. Panchagnula, S. Agrawal, Y. Ashokraj, M.V.S. Varma, K. Sateesh, V. Bhardwaj, S. Bedi, I. Gulati, J. Parmar, C. Kaul, B. Blomberg, B. Fourie, G. Roscigno, R. Wire, R. Laing , P. Evans, T. Moore, Methods Find. Exp. Clin. Pharmacol. 26 (2004) 703.
[7] D. Rey, M. Partisani, H. -K. Georgette, V. Krantz, M. Priester, C. Christine, B. -H. Claudine, E. de Mautort, L. Decroix, J.-M. Lang, J. Acquir. Immune Defic. Syndr. 37 (2004) 1454.
[8] C. C. J. Carpenter, M. A. Fischl, S. M. Hammer, M. S. Hirsch, D. M. Jacobsen, D. A. Katzenstein, J. S. G. Montaner, D. D. Richman, M. S. Saag, R. T. Schooley, M. A. Thompson,
[10] W. Cavert, D. W. Notermans, K. Staskus, W. W.Stephen, Z. Mary, G. Kristin, H. Keith, Z. –Q. Zhang, R. Mills, H. McDade, J. Goudsmit, S. A. Danner & T. H. Ashley, Science 276 (1997)960.
[11] A. Carr, D. A. Cooper, Adv. Exp. Med. Biol. 394 (1996) 299.
[12] S. M. Hammer, J. Infect. Dis. 192 (2005) 1.
[13] M. Hartmann, S. Witte, J. Brust, D. Schuster, F. Mosthaf, M. Procaccianti, J. A. Rump, H. Klinker, D. Petzoldt, Int. J. STD. AIDS 16 (2005)404.
[14] P. Barreiro, V. Soriano, F. Blanco, C. Casimiro, J. J. de la Cruz, J. Gonzalez-Lahoz, AIDS 14 (2000) 807.
[15] N. L. Rezk, R. R. Tidwell, A. D. M. Kashuba, J. Chromatogr. B(2004) 805, 241.
[16] C. F. Silverthorn, T. L. Parsons, Biomed. Chromatogr. 20 (2006) 23.
[17] G. Ramachandran, A. K. Hemanthkumar, V. Kumaraswami, S. Swaminathan, J. Chromatogr. B 843 (2006) 339.
[18] B. H. Chi, A. Lee, E. P. Acosta, L. E. Westerman, M. Sinkala, J. S. A. Stringer, HIV Clin. Trials 7 (2006) 263. [19] R. ter Heine, H. Rosing, E. C. M. van Gorp, J. W. Mulder, W. A. van der Steeg, J. H. Beijnen, A. D. R. Huitema, J. Chromatogr. B 867 (2008) 205.
[20] R. Sekar, S. Azhaguvel, Chromatographia 67 (2008) 389.
[21] S. Notari, C. Mancone, T. Alonzi, M. Tripodi, P. Narciso, P. Ascenzi, J. Chromatogr. B 863 (2008) 249. [22] G. Ramachandran, A. K. Hemanthkumar, V. Kumaraswami, S. Swaminathan, J. Chromatogr. B 843 (2006) 339.
[23] G. R. Da Silva, G. P. Lages, G.A. Pianetti, E.D.A. Nunan, C. D. V. Soares, L. M. M. De Campos, Quimica Nova 29 (2006) 1159.
[24] C. F. Silverthorn, T. L. Parsons, Biomed. Chromatogr. 20(2006) 23.
[25] P. Lemmer, S. Schneider, M. Schuman, C. Omes, V. Arendt, J.-C. Tayari, L. Fundira, R. Wennig, Therapeutic Drug Monitoring 27 (2005) 521.