DETERMINING AFLATOXINS B
1, B
2, G
1AND G
2IN MAIZE USING
FLORISIL CLEAN UP WITH THIN LAYER CHROMATOGRAPHY
AND VISUAL AND DENSITOMETRIC QUANTIFICATION
1Luciana de CASTRO
2, Eugenia Azevedo VARGAS
2,*
1 Recebido para publicação em 25/01/00. Aceito para publicação
em 07/05/01.
2 ministério da agricultura e do abastecimento - laboratório
de controle de qualidade e segurança alimentar/LAV/MG. Av. Raja Gabaglia, 245, BH, MG, Brasil, CEP 30380-090. e-mail:gena@cdlnet.com.br;
* A quem a correspondência deve ser enviada.
SUMMARY
A method for determining aflatoxins B1 (AFB1), B2 (AFB2),G1 (AFG1) andG2 (AFG2) in maize with florisil clean up was optimised aiming
at one-dimensional thin layer chromatography (TLC) analysis with visual and densitometric quantification. Aflatoxins were extracted with chloroform: water (30:1, v/v), purified through florisil cartridges, separated on TLC plate, detected and quantified by visual and densitometric analysis. The in-house method performance characteristics were determined by using spiked, naturally contaminated maize samples, and certified reference material. The mean recoveries for aflatoxins were 94.2, 81.9, 93.5 and 97.3% in the range of 1.0 to 242 µg/kg for AFB1, 0.3 to 85mg/kg for AFB2, 0.6 to 148mg/kg for AFG1 and 0.6 to 140mg/kg for
AFG2, respectively. The correlation values between visual and densitometric analysis for spiked samples were higher than 0.99 for AFB1, AFB2, AFG1 and 0.98 for AFG2. The mean relative
standard deviations (RSD) for spiked samples were 16.2, 20.6, 12.8 and 16.9% for AFB1, AFB2, AFG1 and AFG2, respectively.
The RSD of the method for naturally contaminated sample (n = 5) was 16.8% for AFB1 and 27.2% for AFB2. The limits of detection of the method (LD) were 0.2, 0.1, 0.1 and 0.1mg/kg and the limits of quantification (LQ) were 1.0, 0.3, 0.6 and 0.6mg/kg for AFB1, AFB2, AFG1 and AFG2, respectively. (218 words)
Keywords: aflatoxins; florisil; maize; thin-layer chromatography (TLC); densitometry.
RESUMO
DETERMINAÇÃO DE AFLATOXINAS B1, B2,G1 EG2 EM MI-LHO UTILIZANDO PURIFICAÇÃO COM FLORISIL, SEPARA-ÇÃO POR CROMATOGRAFIA EM CAMADA DELGADA E QUANTIFICAÇÃO VISUAL E DENSITOMÉTRICA. Um méto-do para determinação de aflatoxinas B1 (AFB1), B2 (AFB2),G1
(AFG1) eG2 (AFG2) em milho utilizando florisil na etapa de puri-ficação foi otimizado com vistas a cromatografia em camada delgada (CCD) unidimensional com quantificação visual e densitométrica. As aflatoxinas foram extraídas com solução de clorofórmio: água (30:1, v/v), purificada em cartuchos de florisil, separada em placas cromatográfica de sílicagel, detectadas e quantificadas por análise visual e densitométrica. As caracte-rísticas do método foram determinadas utilizando amostras de milho natural e artificialmente contaminadas e material de refe-rência certificado. Os valores de recuperação média para cada aflatoxina obtidos na faixa de 1,0 a 242 µg/kg para AFB1, 0,3 a 85mg/kg para AFB2, 0,6 a 148 mg/kg para AFG1 e 0,6 a 140mg/
kg para AFG2 foram respectivamente 94,2; 81,9 93,5 e 97,3% por análise densitométrica. As correlações obtidas entre análi-se visual e densitométrica para amostras artificialmente
conta-minadas foram maiores que 0,99 para AFB1, AFB2, AFG1 e 0,98 para AFG2. Os desvios padrão relativos (DPR) médios, para
amostras artificialmente contaminadas foram 16,2; 20,6; 12,8 e 16,9% para AFB1, AFB2, AFG1 e AFG2, respectivamente. O DPR
do método, determinado usando amostra naturalmente conta-minada (n = 5) foi 16,8% para AFB1 e 27,2% para AFB2. Os limites de detecção do método foram 0,2; 0,1; 0,1 e 0,1mg/kg e os limites de quantificação foram 1,0; 0,3; 0,6 e 0,6mg/kg para AFB1, AFB2, AFG1 e AFG2, respectivamente.
Palavras-chave: aflatoxinas; florisil; milho; CCD; densitometria.
1 – INTRODUÇÃO
Aflatoxins are produced by three species of fungi namely: Aspergillus flavus, A. parasiticus and A. nomius in agricultural products that are susceptible to mould infection. Aflatoxin B1 - agenotoxic substance - is hepatoxic in humans and animals and nephrotoxic and immunosuppressive in animals [22]. Because of the high toxicity of aflatoxins, regulatory limits for aflatoxins in food and feed have been laid down in many countries including Brazil [16,17,18,19,20], aiming at reducing human and animal exposure to aflatoxins.
The monitoring of aflatoxins – which are present in food and feed usually inmg/kg - depends on precise, reliable and efficient methods for their accurate determination [10].
The major problem associated with most analytical methods for aflatoxins determination is the presence of co-extracted sample interferences, which requires multiple extraction and clean-up steps before quantification [2]. Solid-phase extraction (SPE) has been used in clean-up procedures saving a lot of time, being solvent-efficient and economical [7,37]. The use of SPE cartridges is simple and usually involves three steps: loading the sample, washing the impurities and eluting the toxin to be determined [13]. A variety of solid phase have been used in aflatoxin analysis, such as silicagel, surfaced-modified bonded silica like florisil and octadecil, a mixture of reversed-phase, ion exclusion, and ion exchange adsorbents (ISOLUTE and ROMER multifunctional column) and other minicolumns [1,3,6,7,25,27].
Rapid test kits are available for screening of aflatoxins, such as enzyme linked immunosorbent assay (ELISA) and antibody – based immunoaffinity column clean-up coupled with fluorometry or florisil tip. These methods do not normally allow for simultaneous monitoring of both individual and total aflatoxin levels although the use of immunoaffinity columns with TLC and HPLC [4,34] for the individual determination of the aflatoxins has been reported [30].
In this paper, the use of florisil as clean-up [2,24,25,27] step was investigated in order to improve and assess separation, recovery, reliability and sensitivity of the method, aiming at one-dimensional TLC analysis with visual and densitometric quantification.
Additional tests were carried out to optimise the clean-up, separation, detection and quantification steps.
The determination of the method characteristics – accuracy, precision, linearity and limits of quantification - were carried out by means of recovery tests for spiked maize samples containing five levels of contamination of aflatoxins and by analysis of a naturally contaminated sample (n = 5) and certified reference material.
2 – MATERIAL AND METHODS
2.1 – Standard solutions
Stock standard solutions of AFB1, AFB2, AFG1 and
AFG2 (~10µg/mL) were prepared by dissolving the solid standard (Sigma, Sigma Chemical Co - St. Louis, MO) in benzene: acetonitrile (98:2, v/v) and the exact concentration were measured by spectrophotometer (Shimadzu UV-1601PC, Shimadzu Scientific Instruments, Japan) [5]. A working standard solution of AFB1 (0.12µg/
mL), AFB2 (0.04µg/mL), AFG1 (0.07µg/mL), and AFG2 (0.07µg/mL) in benzene: acetonitrile (98:2, v/v), for spiking and quantification purposes, was prepared by diluting appropriate aliquots of stock solutions of each toxin.
2.2-Extraction
Finelyground (~20mesh) maize samples (50g), at room temperature, were weighed into a suitable flask (Mason Jar) and extracted with 10mL distilled water and 300mL chloroform [25] for 5 minutes in an Omni mixer
(Omni 17105, Omni International, USA) at a medium velocity. The extract was filtered under vacuum through paper filter Whatman 4 and the filtrate were added 20g anhydrous sodium sulphate. Subsequently, the filtrate was filtered under vacuum through a Whatman fiberglass membrane (GF/B 1mm). The filtrate (100mL) was evaporated (40-500C) in rotary evaporator (Buchi B-481,
Labortechnik AG, Switzerland).
2.3 – Clean-up
The residue was transferred with 6mL chloroform to a florisil cartridge (1g, 6mL, vac, Supelcleanä, Supelco, USA), previously conditioned with 6mL chloroform, fitted to plastic stopcock, and connected to a vacuum system (Varian®, Vac Elut, SPS 24, Varian Associates Inc, USA). The cartridge was washed with 6mL chloroform: hexane (1:1, v/v) followed by 6mL chloroform: methanol (9:1, v/v), without allowing air to pass through the cartridge. The aflatoxins were eluted with 30mL acetone: water (97:3, v/v) [39], in small portions of 5mL, allowing air to pass through the cartridge between every aliquot of acetone: water (97:3, v/v). The eluate was evaporated until dryness in a water bath at 40oC (Yamato Water Incubator BT
25, Yamato, Japan) under nitrogen flow. Clean up and TLC analyses were carried out in subdued light.
2.4 – Thin-layer chromatography
The residues were re-dissolved in 150mL benzene: acetonitrile (98:2, v/v) homogenised and 5 mL spotted on a commercially pre-coated silicagel 60 TLCglass plate, 20 x 20cm, 0.25mm thickness, (E. Merck,Germany) along with a working standard calibration curve containing 0.4 to 1.2ng of AFB1, 0.1 to 0.4ng of AFB2, 0.2 to 0.7ng of both AFG1 and AFG2. The plate was first eluted with anhydrous ethyl ether [32], dried up in a fume hood for 5 minutes, and developed with chloroform: acetone (9:1, v/v) [21,32] at same direction. The TLC plate was visually examined under ultraviolet light at 366nm (Chromato-VueÒ C-70G, Ultra-violet Products, USA). The aflatoxins levels in the samples were calculated by comparing the area of chromatographic peak of the samples with those of standard calibration curve by densitometric analysis (Shimadzu Densitometer, CS9301PC, Shimadzu Scientific Instruments, Japan) 200-300nm, mercury lamp l = 366nm, photo mode: fluorescence, beam size: 0.4 x 5.0mm, reference wave: 360nm, scan mode: linear, fluorescence sensitivity: high. Visual analyses were carried out by comparing the florescence intensity of sample spots with those of standard solution.
2.5 – Method characteristics
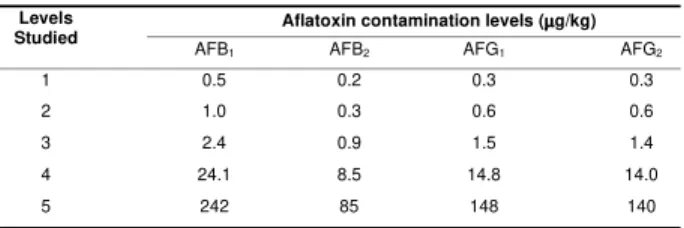
Table 1. Levels of aflatoxin contamination (mg/kg) in spiked maize samples
The linearity of standard calibration curve by densitometry was determined by the application of aflatoxin working standard solution on silicagel 60 TLC plates - 0.24 to 84ng of AFB1, 0.08 to 28ng of AFB2, 0.14 to 49ng of both AFG1 and AFG2. The TLC plate
was developed with anhydrous ethyl ether, dried up, and further developed with chloroform: acetone (9:1, v/v) at same direction (approximately 15-17cm).
The absolute amounts of aflatoxins detectable on a TLC plate were determined by spotting volumes from 0.5 to 5µL of the working standard solution on TLC plates. For visual analysis, the LD was considered the lower amount of each aflatoxin in the spiked sample that could be detectable on TLC plate. For densitometric analysis, the LD of the method was considered the lower amount of each aflatoxin in spiked samples that could be detectable on TLC plate with signal three times the baseline noise of blank sample extract. The limit of quantification for each aflatoxin (LQ) was considered the level of contamination with recoveries rates between 70% and 120%, with RSD lower than 30% [12].
2.6 – Additional tests
Other aspects were investigated during the study, concerned the improvement of separation, resolution and fluorescence intensity of aflatoxins on TLC plates by using different commercially available TLC plates and developing solvent systems. Commercially pre-coated silicagel 60TLCglass plate 20 x 20cm, 0.25mm thickness, (Merck, E. Merck,Germany) and pre-coated silicagel 60TLCglass plate 20 x 20cm, 0.25mm thickness, with pre-adsorbent layer and 19 channels (Whatman, Whatman INC., USA) were spotted with the same aflatoxin standard (0.1 and 0.2ng AFB1) solution and sample extracts; developed with 4 pairs of TLC usual solvent systems at same direction as follows: a) ethyl ether anhydrous [32] followed by ether: methanol: water (96:3:1, v/v, unsaturated tank) [5]; b)ethyl ether anhydrous [32] followed by chloroform: acetone, (9:1, v/v, saturated tank) [21,32]; c)ethyl ether anhydrous [32] followed by toluene: ethyl acetate: chloroform: formic acid (7:5:5:2, v/v, saturated tank) [21] and d) ether: methanol: water (96:3:1, v/v) [5] followed by chloroform: acetone (9:1, v/v, saturated tank) [21,32].
The elution profile patterns of aflatoxins on florisil cartridges were evaluated. For this, volumes of standard solutions were pipetted, evaporated and transferred to cartridges, mimicking sample extracts togive 361; 127; 222 and 210mg/kg of AFB1, AFB2, AFG1 and AFG2,
respectively. Aflatoxins were eluted from 1g florisil cartridges with 30mL of acetone: water (97:3, v/v) [39] by collecting every 5mL portion [11].
3 – RESULTS AND DISCUSSION
3.1 – Method characteristics
The analysis of spiked maize samplesgave an overall mean recoveries for AFB1, AFB2, AFG1 and AFG2 for levels 2 to 5 (Table 1) of 90.6, 90.3, 90.5 and 90.5% for visual analysis and 94.2, 81.9, 93.5 and 97.3% for densitometric analysis, respectively. Individual recoveries values varying from 78.6% to 101% for all aflatoxins were achieved in the range above the quantification limit. The lowest mean recovery was obtained to the lowest level studied – Level 1. The over all mean of relative standard deviation (RSD) for spiked samples were 5.1% for AFB1, AFG1 and AFG2 and 5.3% for AFB2, by visual analysis and 16.2, 20.6, 12.8 and 16.9% for AFB1, AFB2, AFG1 and AFG2, respectively, by densitometric analysis. On Table 2 method performance characteristics of various methods can be observed. The recoveries of aflatoxins from spiked maize samples achieved in the present study, in the range above the limit of quantification, are similar to the results reported for aflatoxins in maize by TLC [25], HPLC [2,37,41] using different clean-up procedures such as florisil [2,25], multifunctional column [37,41], and silica [35]. Although similar recoveries were reported by THEAN et al [35] using silica sep-pak cartridge and HPLC determination, lost of aflatoxins has been reported when silica is used as solid phase due to weak interaction between silica surface and aflatoxins [25] and the effect of small amount of ethanol in the chloroform usually used during loading and washing steps [31]. Lower recoveries for CB and BF method in the analysis of maize samples were reported by KAMIMURA et al [25].
The RSD for visual analysis achieved in this study are comparable to those achieved by KAMIMURA et al [25] and ALI, HASHIM, YOSHIZAWA [2], THEAN et al [35], WILSON and ROMER [41], TRUCKSESS et al [38], and SOARES and RODRIGUEZ-AMAYA [32] using florisil, silica, mycosep column, immunoaffinity column and liquid-liquid partition respectively, as shown on Table 2. The RSD for densitometry were higher than those determined by ALI, HASHIM, YOSHIZAWA [2] and KAMIMURA et al [25] using ISOLUTE multimode column clean-up and HPLC, and florisil clean up with densitometry, respectively; and similar to those determined by BARSMAK and LARSSON [9] and KAMIMURA et al [25] using immunoaffinity column and HPLC, and liquid-liquid partition (CB and BF method), respectively (Table 2). The higher RSD achieved in this study compared to the ones reported by KAMIMURA et al [25] using florisil and densitometry may be due to the wider range of aflatoxin contamination studied in the present paper (Table 2).
Analysis of a naturally contaminated maize sample (n= 5) by densitometrygave agood repeatability of 16.8% for AFB1 (30.5 µg/kg) and 27.2% for AFB2 (2.7µg/kg). The naturally contaminated sample used in this study
Aflatoxin contamination levels (µµµµg/kg) Levels
Studied AFB1 AFB2 AFG1 AFG2
1 0.5 0.2 0.3 0.3
2 1.0 0.3 0.6 0.6
3 2.4 0.9 1.5 1.4
4 24.1 8.5 14.8 14.0
was not contaminated with AFG1 and AFG2. Repeatability (RSDr) of 21.0% for AFB1,15.8% for AFB2 in naturally
contaminated maize using multifunctional clean up with HPLC has been reported [37]. TRUCKSESS et al [38] reported an RSDr of 19.7 and 21.4% for the determination of total aflatoxin in maize by immunoaffinity column clean up with fluorometry and HPLC respectively; and 24.8% for AFB1 with immunoaffinity column and HPLC.
The use of florisil cartridge as clean-up stepgave an extract free of interference and suitable for one-dimensional TLC visual and densitometric analysis. Fi-gure 1 shows typical chromatograms of spiked, naturally contaminated maize samples and aflatoxin working standard solution. The chromatogram shows a characteristic profile with no interference in the retention factor (Rf) of the aflatoxins (AFB1:0.7, AFB2:0.6, AFG1:0.5,
AFG2:0.35) andgood separation indicating thegood specificity and selectivity of the method. Florisil has been reported as an effective solid phase in cleaning extracts for the aflatoxin analysis [24,27] although in some ca-ses another clean-up step and two dimensional TLC analysis has been necessary such as the analysis of aflatoxins in citrus pulp and other feedstuffs [27].
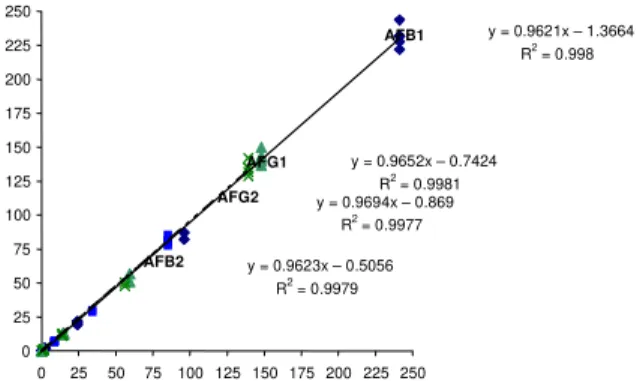
Figures 2 and 3 show the linear regression equations for the recovery tests for aflatoxins in the range studied, by visual and densitometric analysis using florisil cartridge clean up. The equations show coefficient of correlation (R2) for the visual analysis higher than 0.99 for all aflatoxins
indicatinggood linearity (Figure 2). Lower R2 was obtained
for the densitometric analysis with values varying from 0.96 to 0.98 (Figure 3).
FIGURE 1. Chromatogram of working standard solution (a), naturally contaminated (b) and spiked maize sample (c) with AFB1, AFB2, AFG1 and AFG2 (peaks 4 to 1, respectively) obtained
with silicagel 60TLCglass plate, 20 x 20cm, 0.25mm thickness. Mobile phase: First development: ethyl ether anhydrous (unsaturated tank), second development: chloroform: acetone (9:1, v/v, saturated tank), at same direction.
Good linearity (R2 ³ 0.99) between emitted
fluorescence and aflatoxin concentration was obtained for the standard calibration curves over a range of 0.24 to 84ng of AFB1, 0.08 to 28ng of AFB2, 0.14 to 49ng of both AFG1 and of AFG2. AYRES and SINHUBER [8] have reported linearity in a narrower range of 0.25 to 1.5ng of AFB1 while PONS andGOLDBLATT [29] have demonstrated linearity over a range of 0.2 to 10.5ng of AFB1 and KAMIMURA [14] over a range of 0.5 to 20ng of AFB1 and AFG1 and 0.5 to 10ng of AFB2 and AFG2.
a
c b
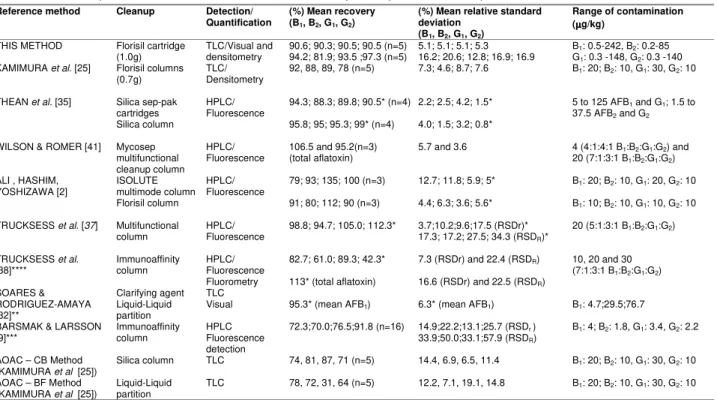
Reference method Cleanup Detection/
Quantification
(%) Mean recovery (B1, B2, G1, G2)
(%) Mean relative standard deviation
(B1, B2, G1, G2)
Range of contamination (µµµµg/kg)
THIS METHOD Florisil cartridge
(1.0g) densitometryTLC/Visual and 90.6; 90.3; 90.5; 90.5 (n=5)94.2; 81.9; 93.5 ;97.3 (n=5) 5.1; 5.1; 5.1; 5.316.2; 20.6; 12.8; 16.9; 16.9 GB11: 0.5-242, B: 0.3 -148, G2: 0.2-852: 0.3 -140 KAMIMURA et al. [25] Florisil columns
(0.7g) TLC/Densitometry 92, 88, 89, 78 (n=5) 7.3; 4.6; 8.7; 7.6 B1: 20; B2: 10, G1: 30, G2: 10
Silica sep-pak
cartridges 94.3; 88.3; 89.8; 90.5* (n=4) 2.2; 2.5; 4.2; 1.5*
THEAN et al. [35]
Silica column
HPLC/ Fluorescence
95.8; 95; 95.3; 99* (n=4) 4.0; 1.5; 3.2; 0.8*
5 to 125 AFB1 and G1; 1.5 to 37.5 AFB2 and G2
WILSON & ROMER [41] Mycosep multifunctional cleanup column
HPLC/
Fluorescence (total aflatoxin)106.5 and 95.2(n=3) 5.7 and 3.6 20 (7:1:3:1 B4 (4:1:4:1 B1:B1:B2:G2:G1:G1:G2) and2)
ISOLUTE multimode column
79; 93; 135; 100 (n=3) 12.7; 11.8; 5.9; 5* B1: 20; B2: 10, G1: 20, G2: 10 ALI , HASHIM,
YOSHIZAWA [2]
Florisil column
HPLC/ Fluorescence
91; 80; 112; 90 (n=3) 4.4; 6.3; 3.6; 5.6* B1: 10; B2: 10, G1: 10, G2: 10
TRUCKSESS et al. [37] Multifunctional
column
HPLC/ Fluorescence
98.8; 94.7; 105.0; 112.3* 3.7;10.2;9.6;17.5 (RSDr)* 17.3; 17.2; 27.5; 34.3 (RSDR)*
20 (5:1:3:1 B1:B2:G1:G2)
HPLC/
Fluorescence 82.7; 61.0; 89.3; 42.3* 7.3 (RSDr) and 22.4 (RSDR) TRUCKSESS et al.
[38]**** Immunoaffinitycolumn
Fluorometry 113* (total aflatoxin) 16.6 (RSDr) and 22.5 (RSDR)
10, 20 and 30 (7:1:3:1 B1:B2:G1:G2)
SOARES & RODRIGUEZ-AMAYA [32]**
Clarifying agent Liquid-Liquid partition
TLC
Visual 95.3* (mean AFB1) 6.3* (mean AFB1) B1: 4.7;29.5;76.7
BARSMAK & LARSSON [9]***
Immunoaffinity column
HPLC Fluorescence detection
72.3;70.0;76.5;91.8 (n=16) 14.9;22.2;13.1;25.7 (RSDr ) 33.9;50.0;33.1;57.9 (RSDR)
B1: 4; B2: 1.8, G1: 3.4, G2: 2.2
AOAC – CB Method
(KAMIMURA et al. [25]) Silica column TLC 74, 81, 87, 71 (n=5) 14.4, 6.9, 6.5, 11.4 B1: 20; B2: 10, G1: 30, G2: 10 AOAC – BF Method
(KAMIMURA et al. [25]) Liquid-Liquidpartition TLC 78, 72, 31, 64 (n=5) 12.2, 7.1, 19.1, 14.8 B1: 20; B2: 10, G1: 30, G2: 10
TABLE 2. Methods performance characteristics for aflatoxin analysis in spiked maize samples.
* data calculated from author’s paper data ** for yellow corn meal
FIGURE 2. Linear regression for visual quantification of AFB1
(), AFB2 (), AFG1 () and AFG2 () in spiked maize samples (5 levels, n³3).
FIGURE 3. Linear regression for densitometric quantification of AFB1 (), AFB2 (), AFG1 () and AFG2 () in spiked maize samples (5 levels, n³3).
Good linearity between visual and densitometric analysis of 0.99 for AFB1, AFB2, AFG1 and 0.98 for AFG2
for spiked maize samples were achieved in the present study with an overall R2 of 0.98 (Figure 4). Lower
coefficients of correlation of 0.94 for AFB1, 0.88 for AFB2, 0.82 for AFG1 and 0.20 for AFG2, for naturally
contaminated maize samples have been reported by OLIVEIRA, PRADO, JUNQUEIRA [26]. According to these authors, the lower correlation obtained for AFG2 in that study was due to very low levels of contamination of this toxin in the analysed samples.
FIGURE 4. Correlation between visual and densitometric quantification for AFB1 (), AFB2 (), AFG1 () and AFG2 () in
spiked maize samples, (5 levels, n³3).
Low LD and LQ for the aflatoxins on TLC plates by densitometric analysis were achieved in this study as
can be observed on Table 3. The low limits LD and LQ determined by the authors are due to a combination of the efficient clean-up procedure andgood separation and resolution of the aflatoxins on TLC plates. Higher limit of detection of 1mg/kg for AFB1 and 5mg/kg for AFG1 in maize by using a florisil open column clean up coupled with HPLC has been reported by ALI, HASHIM, YOSHIZAWA [2]. TRUCKSESS et al [37] also reported higher limits of detection for AFB1 (³3mg/kg), AFB2 (³1mg/kg), AFG1 (³2mg/kg) and AFG2 (³1mg/kg) in maize by multifunctional column clean-up with HPLC in an international collaborative study. SOARES and RODRIGUEZ-AMAYA [32] have determined higher limit of detection of 2mg/kg for AFB1 and a limit of quantification
of 4mg/kg by using clarifying agents and liquid-liquid partition with visual analysis.
This method has been submitted to a proficiency testing scheme (FAPAS, MAFF, UK) for two yearsgiving satisfactory z-score results of 2 < z-score < 2.
TABLE 3. Absolute amount of aflatoxins detectable on TLC plate on silicagel 60 TLC plates, LD and LQ of the method for AFB1, AFB2, AFG1, AFG2 and total aflatoxin by densitometric analysis
The method has shown to be accurate and precise for determining aflatoxins in maize. The limit of detection and quantification of the method comply with the actual regulatory limits for aflatoxin in maize and maize products for human and animal consumption in Brazil [16,17,18]. The performance characteristics in terms of recoveries and repeatability determined in the present study are consistent with the criteria of analytical methods for AFB1 and total aflatoxins established by the European Committee for Standardisation [12] and the European Union Directive 98/53 [15]. This method has been in routine for two years and has been adopted as Official Method of Analysis of the Ministry of Agriculture and Supply, Brazil [19].
3.2 – Additional tests
It was noticed that the development of TLC plates with ethyl ether anhydrous followed by a second development using a solvent system containing ethyl ether increased the Rf values and it was not efficient to remove the usual fluorescence interference present in maize extracts that is observable near AFB2 Rf. The elution of aflatoxins on TLC plates with ethyl ether anhydrous followed by the use of a solvent system containing formic acid quenched the AFB1 fluorescence and cause decreasing of AFB1 and AFG1 and increasing of AFB2
and AFG2 fluorescence intensity as also reported by JAIN and HATCH [23], apart from not being efficient to separate the interference spot near AFG2 Rf, making the visual
y = 0.9623x – 0.5056 R2 = 0.9979
y = 0.9621x – 1.3664 R2 = 0.998
y = 0.9652x – 0.7424 R2 = 0.9981 y = 0.9694x – 0.869
R2 = 0.9977
0 25 50 75 100 125 150 175 200 225 250
0 25 50 75 100 125 150 175 200 225 250
AFB1
AFB2
AFG1
AFG2
y = 0.9702x - 1.0016 R2 = 0.9799
y = 0.9285x + 0.3236 R2 = 0.9813
y = 0.9534x - 0.3746 R2 = 0.9842 y = 1.0558x - 1.2718 R2 = 0.9619
0 25 50 75 100 125 150 175 200 225 250
0 50 100 150 200 250 300
AFB1
AFB2
AFG1
AFG2
A
fla
tox
in c
onc
en
trati
on (
µ
g/
kg
)
D
ens
itom
etri
c anal
ys
is
Aflatoxin concentration (µg/kg) Visual analysis 0
50 100 150 200 250 300
0 50 100 150 200 250 300
AFB1 AFB2 AFG1 AFG2 Total
aflatoxin Absolute amount of
aflatoxins detectable on TLC plate (ng)
0.10 0.04 0.06 0.04 0.24
LD (µµµµg/kg) 0.2 0.1 0.1 0.1 0.4
and densitometric analysis of difficult resolution. The best separation of aflatoxins on TLC plates for standard and maize sample extracts was obtained by developing the plate with ethyl ether anhydrous followed by a second development with chloroform: acetone (9:1, v/v, saturated tank)giving an easily recognised profile with no fluorescence interference and streaking in the aflatoxin Rfs (AFB1:0.7, AFB2:0.6, AFG1:0.5, AFG2:0.4) making
the one dimensional TLC with densitometric analysis possible (see Figure 1). The elution of the toxins on TLC plates with ether: methanol: water (96:3:1, v/v) followed by chloroform: acetone (9:1, v/v, saturated tank) at same direction, did notgive agood separation and resolution of the aflatoxins by eluting them to solvent front line.
It was observed that silicagel plates with channels and pre-adsorbent layer were more efficient to separate and resolve the aflatoxins from sample extracts interference, when compared to normal TLC plates, may be due to efficiency of the pre-adsorbent layer in retaining the sample interferences. However, the limit of detection for the aflatoxins on these TLC plates were twice that of normal TLC plates shown in Table 3, and this fact was probably due to spread of the aflatoxin spot on TLC plates because of the type ofglass coating.
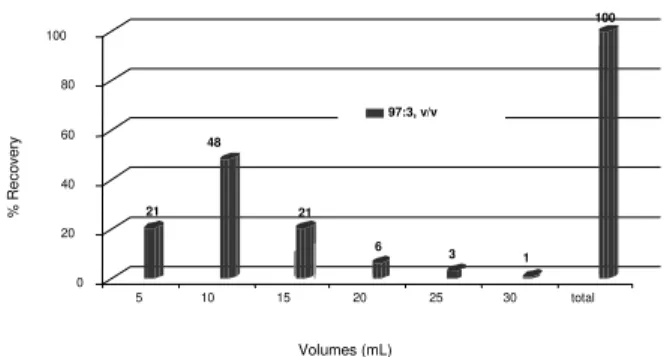
The elution profile pattern of aflatoxins on 1g florisil cartridges is shown in Figure 5.
FIGURE 5. Elution profile pattern of total aflatoxins with acetone: water (97:3, v/v) on 1g florisil cartridge.
Approximately 94% of all aflatoxins were recovered from florisil cartridge (1g) within the first 18mL of acetone: water (97:3, v/v) [11] whereas only 6% were eluted within the last 12mL of acetone: water (97:3, v/v). It was noticed the presence of a tailing in the elution profile pattern of the aflatoxins on florisil cartridge as also reported by van RHIJN, VIVEEN and TUINSTRA [39] for different elution solvent system: acetone: water (98:2, v/v)], acetone: water (97:3, v/v), and acetone: water (95:5, v/v). KAMIMURA et al [25] reported the elution of aflatoxins from florisil cartridges with 30mL of acetone: water (99:1, v/v) while 100% recovery of AFB1 were obtained with approximately 30mL of acetone: water (90:10, v/v) by PAULSCH ,SIZOO, van EGMOND [27]. ALI, HASHIM, YOSHIZAWA [2] have reported the need of 60mL acetone: water (99:1, v/v) for the complete elution of aflatoxins from 0.7g florisil columns.
However, van RHIJN, VIVEEN and TUINSTRA [39] reported lost of 50% of AFB1 in the automation of the
analysis of aflatoxins employing 0.1g florisil cartridge as clean-up step and acetone: water (95:5, v/v) as elution solvent. According to PAULSCH, SIZOO, van EGMOND [27] an addition of 1% water to acetone increase the recovery of aflatoxins; and 10% of water decreases the volume necessary for the elution of the aflatoxins. However, the increase of 20% water decrease the aflatoxin recovery from florisil probably due to decomposition of the aflatoxins caused by the alkali formed by reaction of water on florisil. One can assume that florisil cartridge should be kept in seal tight dissecator with low humidity content until analysis.
Although recoveries of aflatoxins from florisil cartridges were higher than 90% within the first 18mL of acetone: water (97:3, v/v) in this study, it was decided the use of 30mL acetone: water (97:3, v/v) as a suitable volume for a proper elution of the aflatoxins, because the presence of tailing in the elution profile of standard (Figure 5) and of spiked and naturally contaminated maize samples on 1g florisil cartridge [11].
In order to automate the clean-up step, recovery tests have been carried out. For this, different cartridges containing different amounts of florisil (100mg, 500mg) and volumes of loading, washing and elution solvents have been evaluated.
Studies have been conduct aiming at replacing the chloroform as extraction solvent - although the high efficiency of chloroform: water (250:15, v/v) in extracting aflatoxins compared with methanol: water (55:45, v/v) and acetone: water (85:15, v/v) [40] - due to worldwide concern of the use of hazardous chlorinated solvents [4,34]. The use of aqueous methanol, acetone and acetonitrile - reported as suitable solvents for aflatoxin extraction for a wide range of products [4,34] – has been evaluated. The limiting factor is the presence of water in the extract that should be completely removed before loading the florisil cartridges and columns, thus avoiding lost of aflatoxins in this step.
The method has been in-house validated for the analysis of other matrices such asgrains, citrus pulp and feed containing citrus pulp.
4 – CONCLUSIONS
• Florisil has been shown to be an effective solid-phase for the clean-up of the aflatoxins in maizegiving a final extract suitable for one-dimensional TLC analysis;
• The method developed was accurate, specific and reliable in determining the aflatoxins at levels as low as 1.0µg/kg of AFB1, 0.3 µg/kg of AFB2, 0.6µg/kg of both AFG1 and AFG2 in maize;
• The method established can comply with the strictest regulatoryguidelines such as the European Union Regulation, and with the regulatory limits laid down in Brazil.
• The method established by the present study has been adopted as Official Method of Analysis of the Ministry of Agriculture, Brazil.
%
R
eco
ve
ry
Volumes (mL) 21
48
21
6 3
1 100
0 20 40 60 80 100
5 10 15 20 25 30 total
5 – REFERENCES
[1] AKIYAMA, H.; CHEN, D.; MIYAHARA, M.; TOYODA, M.; SAITO, Y. Simple HPLC determination of aflatoxins B1, B2,G1 andG2
in nuts and corn. J. Food Hygienic Society of Japan, v.37, p. 195-201, 1996.
[2] ALI, N., HASHIM, N. H.; YOSHIZAWA, T. Evaluation and application of a simple and rapid method for the analysis of aflatoxins in commercial foods from Malaysia and the Philippines. Food Addit. Contam., v.16, n.7, p. 273-280, 1999.
[3] ALI, N.; SARDJONO; YAMASHITA, A.; YOSHIZAWA, T. Na-tural co-occurrence of aflatoxins and Fusarium mycotoxins (fumonisins, deoxynivalenol, nivalenol and zearalenone) in maize from Indonesia. Food Addit. Contam., v.15, n.4, p.377-384, 1998.
[4] ANKLAM, E. & STROJA, J. Effects and limits of sample preparation for the determination of aflatoxins. The 114th
AOAC International Annual Meeting and Exposition. Fi-nal Program. September 10-14, 2000, Philadelphia, Pensylvania, USA.
[5] AOAC - ASSOCIATION OF OFFICIAL ANALYTICAL CHEMISTS. Official methods of analysis of the AOAC International. 16.ed. 4th ver. 1998. (Software Adobe and
E-DOC/CJS).
[6] ARIM, R. H.; AGUINALDO, A. R.; TANAKA, T.; YOSHIZAWA, T. Optimization and validation of a minicolumn method for determining aflatoxins in copra meal. J. Assoc. Off. Anal. Chem., v.82, n.4, 1999.
[7] ARIM, R. H.; AGUINALDO, A. R.; YOSHIZAWA, T. Application of a modified minicolumn to detection of aflatoxins in corn.
Mycotoxins, v.48, p. 53-57, 1999.
[8] AYRES, J. L.; SINHUBER, R. O. Fluorodensitometry of aflatoxin on thin layer plates. In: SHANTHA, T. Methods for estimation of aflatoxins: a critical appraisal. J. Food Sci. Technol., v.31, n.2, p. 91-103, 1994
[9] BARSMARK, A-L., LARSSON, K. Immunoaffinity column clean-up/liquid chromatographic determination of aflatoxins:an interlaboratory study. J. AOAC International, v.77, n.1, p. 46-53, 1994.
[10] BOENKE, A. Method validation for mycotoxin determination in food and foodstuffs. Trends in Analytical Chemistry, v.17, p. 10-17, 1998.
[11] CASTRO, L., VARGAS, E. A. Use of florisl as clean-up step for aflatoxins analysis. X International IUPAC Symposium on Mycotoxins and Phycotoxins,Guarujá, São P, 21-25 May, 2000.
[12] CEN-European Committee for Standardisation. CEN Report: Food Analysis – Biotoxins – Criteria of analytical methods for mycotoxins. February 1999. 8p
[13] CHU, F. S. Immunoassays for analysis of mycotoxins. J. Food Prot., v.47, n.7, p. 562-569, 1984.
[14] COKER, R. D. High performance liquid chromatography and other chemical quantification methods used in the analysis of mycotoxins in foods. In:GILBERT, J. (Ed.) Analysis of food contaminants. London: Elsevier, 1984. Cap.5, p.207-263.
[15] Comission regulation (98/53/EC) of 16th july 1998. Official Journal of the European Communities L201/93, Luxembourg.
[16] DOU - Diário Oficial da União, 1977, Resolution MS/CNNPA N0. 34/76 published in the Brazilian Official Newspaper in January, 19th, 1977, Section 1, Part V.
[17] DOU - Diário Oficial da União, 1988, Portaria MA/SNAD/ SFA N0. 07 of November 9th, 1988 published in Brazilian
Official Newspaper in November, 14th, 1988
[18] DOU - Diário Oficial da União, 1996, Portaria SFA N0. 183
of March, 21st, 1996 published in Brazilian Official
Newspaper in March, 25th, 1996.
[19] DOU, Diário Oficial da União, 2000, Instrução Normativa SDA, no. 09, 24/03/2000, seção 1, published on the 30/ 03/2000, 39-40.
[20] FAO - Food and Agriculture Organization of the United Nations, 1997, World regulations for mycotoxins 1995. A compendium. FAO Food and Nutrition Paper64 (Rome: FAO).
[21]GIMENO, A., MARTINS, M., L. Rapid thin layer chromatography determination of patulin, citrinin, and aflatoxin in apples and pears, and their juices and jams. J. Assoc. Off. Anal. Chem., v. 66, n. 1, p. 85-91, 1983.
[22] IARC (1993) IARC monographs on the evaluation of carcinogenic risks to humans, Vol. 56, Some naturally occurring substances: food items and constituents, heterocyclic aromatic amines and mycotoxins, Lyon, pp. 145-156.
[23] JAIN, A. V. & HATCH, R.C. Determination of aflatoxins in compounds feedstuffs containing citrus pulp. J. Assoc. Off. Anal. Chem., v.63, n.3, p. 626-630, 1980.
[24] KAMIMURA, H. Simple methods in the analysis and na-tural occurrence of mycotoxins in foods and herbal drugs. Tokyo: JICA, 1988. 121 p.
[25] KAMIMURA, H.; NISHIJIMA, M.; YASUDA, K.; USHIYAMA, H.; TABATA, S.; MATSUMOTO, S.; NISHIMA, T. Simple cleanup method for analysis of aflatoxins and comparison with various methods. J. Assoc. Off. Anal. Chem., v.68, n.3, p. 458-461, 1985.
[26] OLIVEIRA, M. S.; PRADO,G.; JUNQUEIRA, R.G. Comparación entre las técnicas visual y densitométrica de cromatografía en capa fina en la cuantificación de aflatoxinas en maiz (Zea mays L.). In: Segundo Congresso Latinoamericano de Micotoxicologia, 2, 1997, Maracay. Programa y resumenes. Maracay: Universidad Central de Venezuela/ Sociedade Latinoamericana de Micotoxicologia, 1997. p.51-52.
[27] PAULSCH, W. E., SIZOO, E. A., van EGMOND, H. P. Liquid Chromatography determination of aflatoxins in feedstuffs containing citrus pulp. J. Assoc. Off. Anal. Chem., v.71, n.5, p. 957-961, 1988.
[28] PENNINGTON, L. J. Thin layer chromatography and densitometric determination of aflatoxins in mixed feeds containing citrus pulp. J. Assoc. Off. Anal. Chem., v.69, n.4, p. 690-696, 1986.
[29] PONS, J. W. A.;GOLDBLATT, L. A. The determination of aflatoxins in cottonseed products. In: SHANTHA, T. Methods for estimation of aflatoxins: a critical appraisal. J. Food Sci. Technol., v.31, n.2, p. 91-103, 1994.
[30] SCOTT, P. M. & TRUCKSESS, M. W. Application of Immunoaffinity Columns to Mycotoxin Analysis. J. Assoc. Off. Anal. Chem., v.80, n.5, p. 941-949, 1997.
[33] SOUZA, S. V. C. Aflatoxina M1 em leite: Metodologia e ocor-rência no Estado de MinasGerais. Belo Horizonte, 1997. 85p. (Dissertação, Mestrado). Faculdade de Farmácia da Universidade Federal de MinasGerais (UFMG). [34] STROKA, J.; PETZ, M.; JOERISSEN, U.; ANKLAM, E.
Investigation of various extractants for the analysis of aflatoxin B1 in different food and feed matrices. Food Addit.
Contam., v.16, n.8, p. 331-338, 1999.
[35] THEAN, J. E., LORENZ, D. R., WILSON, D. M., RODGERS, K.,GUELDNER, R. C. Extraction, cleanup, and quantitative determination of aflatoxins in corn. J. Assoc. Off. Anal. Chem., v.63, n.3, 1980.
[36] TRUCKSESS, M. W., Rapid analysis (thin layer chromatographic and immunochemical methods) for mycotoxins in food and feeds. In: X International IUPAC Symposium on Mycotoxins and Phycotoxins, p.5, 2000. São Paulo. Abstract book. (conference).
[37] TRUCKSESS, M. W., STACK, M. E., NESHEIM, S., ALBERT, R. H., ROMER, T. R., Multifunctional column coupled with liquid chromatography for determination of aflatoxins B1,
B2,G1 andG2 in corn, almonds, Brazil nuts, peanuts and pistachio nuts: collaborative Study. J. Assoc. Off. Anal. Chem., v.77, p. 1512-1521, 1994.
[38] TRUCKSESS, M. W.; STACK, M. E.; NESHEIM, S.; PAGE, S. W.; ALBERT, R. H.; HANSEN, T. J.; DONAHUE, K. F.
Immunoaffinity column coupled with solution fluorometry or liquid chromatography postcolumn derivatization for determination of aflatoxins in corn, peanuts, and peanut butter: collaborative study. J. Assoc. Off. Anal. Chem., v.74, n.1, p. 81-88, 1991.
[39] Van RHIJN, J. A., VIVEEN, J., TUINSTRA, L.G. M. Automated determination of aflatoxin B1 in cattle feed by two-column
solid-phase extraction with on-line high performance chromatography. Journal of Chromatography, v. 592, p. 265-269, 1992.
[40] WILSON, D. M. Analytical methods for aflatoxins in corn and peanuts. Arch. Environ. Contam. Toxicol., v.18, p. 308-314, 1989.
[41] WILSON, T. J. & ROMER, T. R. Use of the mycosep multifunctional cleanup column for liquid chromatographic determination of aflatoxins in agricultural products. J. Assoc. Off. Anal. Chem., v.74, n.6, p. 951-956, 1991.