Electrolytic Removal of Metals Using a Flow-Through Cell with a
Reticulated Vitreous Carbon Cathode
Rodnei Bertazzoli*, Rosivânia C. Widner, Marcos R.V. Lanza,
Rosana A. Di Iglia, and Maria F.B. Sousa
Universidade Estadual de Campinas, Departamento de Engenharia de Materiais -FEM, C.P. 6122, 13083-970 Campinas - SP, Brazil; e-mail: [email protected]
Received: July 23, 1996; May 8, 1997
O objetivo do presente trabalho foi estabelecer um processo eletrolítico para remover metais de efluentes aquosos usando um catodo tridimensional de carbono vítreo reticulado. Durante o desenvolvimento do trabalho foi estudado a influência do fluxo do eletrólito e da porosidade do eletrodo. A célula eletrolítica utilizou potenciais tais que a reação de redução ocorreu sob controle de transporte de massa. A célula demonstrou eficiência na remoção de chumbo, zinco e cobre, reduzindo a concentração desses metais de 50 mg.L-1 a 0,1 mg.L-1 em 20 min de recirculação da solução.
The aim of the present study was to establish an electrolytic method for the removal of metals from wastewater using a three dimensional, reticulated vitreous carbon cathode. During the development of the experimental set up, particular attention was paid to the electrolyte flow rate and to the cathode porosity. The electrolytic cell employed potential values in such a way that the metals reduction reaction occurred under mass transport control. These potentials were determined by hydrodynamic voltammetry on a vitreous carbon rotating disc electrode. The cell proved to be efficient in removing copper, zinc and lead and it was able to reduce the levels of these metals from 50 mg/L to 0.1 mg/L.
Keywords:: electrolytic removal of metals, three dimensional electrodes, electrochemical reactors
Introduction
The quality of water resources and of the environment in general is a permanent concern and has resulted in new solutions for old problems in the field of wastewater treat-ments. In particular, new efforts have been made at reduc-ing the sources of pollutants and at improvreduc-ing the efficiency of waste treatments.
The toxicity of heavy metals has been known for many years, and the clinical symptoms of prolonged exposure to a heavy metal-contaminated environment are well
de-fined1,2. Heavy metals enter waterways via effluent
dis-charges from electroplating, metal finishing, explosive, pigments and paint producing, and metal/mechanics manu-facturing industries in general. As a result of their high toxicity, the concentration of highly toxic metallic ions in
drinking water is restricted to few ppb3.
The increase in legal pressures and restrictions are forcing industries to accept responsibility for the treatment or storage of waste in an attempt to minimize pollution. The permanent responsibility to care for waste materials “from cradle-to-grave” is encouraging a move towards zero-efflu-ent discharge and the adoption of solutions for the source of effluents rather than treating the waste at the end of the industrial process.
Electrochemical technology offers an efficient means of controlling pollution as it provides removing of heavy metals via redox reactions. The literature on metal ion removal from aqueous electrolytes using three dimensional
electrode cells is extensive4-16.
In this paper we present an electrolytic cell with a porous cathode of reticulated vitreous carbon (RVC) de-signed to remove metals from aqueous streams. The
equip-Article
ment has been tested in copper, lead and zinc removal. By flowing simulated effluents metal ion containing through porous cathodes, it is possible to achieve both high mass transfer rates and large surface areas for the electrochemi-cal reaction. Metals ions in such solutions are reduced at the inner surface of the porous electrodes as the electrolyte is percolated through the cell.
The choice of RVC for the porous cathode isbased on
the observations17 that this material a) is chemically and
electrochemically inert over a wide range of potentials and on a wide variety of chemicals, b) has a high specific surface area within the porous structure that is accessible to electrochemically active species, c) has a high fluid permeability, d) is easily shaped as required by cell design considerations and has good mechanical resistance.
Experimental
The development of the electrolytic cell for metals removal was carried out in two stages. Initially, a voltam-metric study of the Cu(II), Pb(II) and Zn(II) reduction reaction on a glassy carbon rotating disc electrode was performed in order to determine the range of potentials over which this reaction is controlled by mass-transfer. Sub-sequently, a potential value within this interval was se-lected and applied to a flow-through electrolytic cell containing a reticulated vitreous carbon cathode. The elec-trolyte flow rate and the cathode porosity were varied in order to establish the best conditions for metal removal.
Apparatus
All electrochemical experiments were performed using a Model 273 A potentiostat/galvanostat system controlled by the software Model 270/250 (both from EG&G Prince-ton Applied Research Corporation). In both stages, a three-electrode cell was used, as described below. A Model AA 12/1475 Varian spectrometer was employed to determine the Cu(II), Pb(II) and Zn(II) concentration, using an air/acetylene flame.
Chemicals and materials
All reagents were of analytical grade and did not un-dergo further purification. Distilled and deionized water was used to prepare all solutions. The testing containing metallic ions solutions were prepared in such away that the metallic concentration was around 50 mg/L. Copper
solu-tion was prepared from CuSO4 plus Na2SO4 (0.1 mol/L)
and boric acid (0.5 mol/L), with a final pH of 4. The 50
mg/L Pb(II) solution was prepared from Pb(NO3)2 using
boric acid (0.5 mol/L) plus sodium nitrate (0.05 mol/L), pH4. Zinc solution was prepared from 50 mg/L of Zn(II)
as ZnCl2, 0.1 mol/L of KCl and 0.1 mol/L of boric acid, at
pH 5.5. The atomic absorption standards were prepared from Titrisol standard solutions (Merck).
Hydrodynamic voltammetry
The hydrodynamic voltammetric experiments were carried out in a conventional three-electrode cell with sepa-rated compartments for each electrode. A glassy carbon rotating disc electrode (GCRDE) Model 616 (PARC) as a working electrode, a large-surface platinum counter-elec-trode, and a saturated calomel reference electrode (SCE) within a Luggin capillary, were used. The glassy carbon electrode was polished to a mirror-like surface, using
1.0 µm, 0.3 µm and 0.04 µm alumina slurries,
consecu-tively, on polishing clothes. The current-voltage curves were obtained for several rotations (400, 900, 1,600, 2,500 and 3,500 rpm) by cycling the working electrode potential (one cycle). All experiments were carried out at room temperature (around 298 K).
Flow-through cell configuration
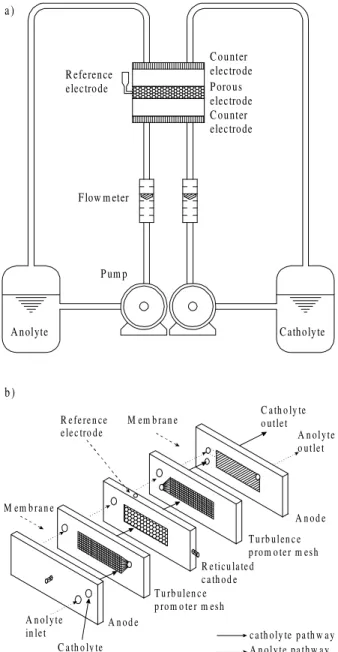
The dual continuous-flow cell design is shown sche-matically in Fig. 1a. The system consisted of an electro-chemical cell, of two 4.0 L PVC reservoirs for catholyte and anolyte, of two recirculation pumps, and of two sets of flowmeters, with a flow range from 60 to 600 L/h, for controlling the catholyte and anolyte flow rates. These components were connected together by polyvinylchloride and polyethylene tubes.
in a closed circuit through the catholyte and anolyte com-partments.
Procedure
After assembling the electrochemical cell, the flow system was loaded with 3.5 L of catholyte and anolyte, each in a separate reservoir. The catholyte consisted of the solutions described above. The anolyte composition was the same as the catholyte, with the exception of the metal ions, and the flow rates of both electrolytes were adjusted to the same value. Then, a constant potential of -0.3 V for copper, -0.8 V for lead and -1.35 V vs. SCE for zinc was applied to the cell from a potentiostatic power supply, in
the controlled-potential mode, for two hours. As observed in the preliminary hydrodynamic voltammetric study, the reduction of those metals at these potentials is mass trans-port-controlled. At predetermined intervals, the solution leaving the cathodic compartment was sampled, and the remaining metal concentration was quantified by atomic absorption spectrometry, in order to monitor the effective-ness of electrolysis.
Results and Discussion
As stated earlier, the development of the electrolytic cell for the removal of metals was accomplished in two phases. In order to determine the appropriate reduction potential for the removal of Cu(II), Pb(II) and Zn(II) ions from the chosen medium under conditions of turbulence, a preliminary hydrodynamic voltammetric study was carried out. Subsequently, this potential was applied to the electro-lytic cell under several combinations of electrolyte flow rate and RVC cathode porosity.
Preliminary hydrodynamic voltammetric experiments Figures 2, 3 and 4 show a series of voltammograms obtained in the hydrodynamic mode for solutions contain-ing 50 mg/L of each metal in the supportcontain-ing electrolyte as described in the experimental section. The potential was scanned on a glassy carbon rotating disc electrode (area =
0.12 cm2) using five different rotation rates (400, 900,
1,600, 2,500 and 3,600 rpm). It should be noted that, in the cathodic scan, all the curves in the three figures show waves for the reduction of M(II) to M, with a well-defined limiting current plateau extending over a large potential range. The value of the limiting current was dependent on the GCRDE rotation rate. This behavior is characteristic of a mass-trans-fer controlled process. According to the literature, the ap-plication of the Levich equation is an appropriate test to verify whether an electrode process is conducted under a C ounter
electrode
C ounter electrode P orous electrode R eference
electrode
F low m eter
P um p
A nolyte C atholyte
a )
b )
M em b ra n e
R e fe re n ce e le c tro d e
M em b ra n e C a th o ly teo u tle t A n o ly te o u tle t
A n o d e T u rb u len c e p ro m o te r m esh
c a th o ly te p a th w a y A n o ly te pa th w a y A n o d e
A n o ly te in le t
C a th o ly te in le t
R e ticu la te d c a th o d e T u rb u len c e p ro m o te r m esh
Figure 1. (a) Dual continuous-flow cell design. (b) Electrolytic cell used for metal removal.
I (m
A
)
E (V v s.S C E )
0 .2
0 .1 5
0 .1
0 .0 5
0
-0 .5 -0 .3 -0 .1 0 .1 0 .3
I (m
A
)
f (s )0 .5 -0 .5 0 .2
0 .1 0
0 5 1 0
3 6 0 0 rp m 2 5 0 0 rp m 1 6 0 0 rp m 9 0 0 rp m 4 0 0 rp m
mass-transfer controlled condition18. The limiting currents
measured at the mid point of the plateaus were plotted as a
function of the square roots of the rotation rates (I vs. ω1/2)
as shown in the insets of Figs. 2, 3 and 4. As predicted by the Levich equation, the plots were linear, confirming the fact that under the conditions of this study, copper, lead and zinc deposition became mass-transport controlled at poten-tials more negative than -0.2, -0.6 and -1.2 V vs. SCE, respectively.
Efficiency of metal removal by the recirculating flow-through cell
In flow-through cell performance studies, the removal of Cu(II), Pb(II) and Zn(II) was conducted in the recircula-tion mode. The deplerecircula-tion of the metals concentrarecircula-tion by potentiostatic electrolysis at the reticulated carbon cath-odes was evaluated by measuring the remaining metallic concentration in the catholyte compartment solution as a function of the electrolysis time. The levels of metals were quantified by atomic absorption spectrometry. Each ex-periment was carried out using 3.5 L of a solution with the same composition as that used in the preliminary experi-ments; the anolyte contained only a supporting electrolyte with no metallic ions. A potential of -0.3 V for copper, -0.8 V for lead and -1.35 V vs. SCE for zinc was applied at the RVC cathode for the electrodeposition of the metals. These potential values were the mid point of the limiting current plateaus obtained in the experiments with the GCRDE.
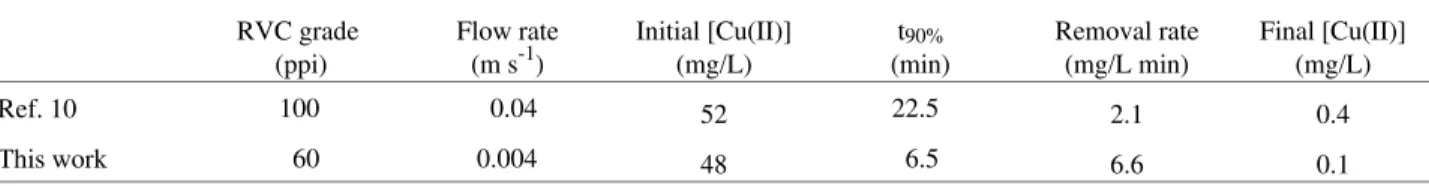
As a preliminary test of the cell performance removal of copper from sulphate media was chosen due to its well known behavior under bulk electrolysis conditions that is
widely found in the literature4-6, 9,10. Figure 5 shows the
decay of copper concentration during the time of electroly-sis. A 60 ppi RVC cathode was used under a flow rate of 120 L/h. After 15 min. of recirculation in open circuit, 48 mg/L of copper were found in solution using AAS analysis. After the cathode polarization at -0.3 V vs. SCE the amount of copper remaining in solution decreased exponentially with the time. After 30 min. of polarization the
concentra-tion was 0.1 mg/L. Literature reports10 removal rates of
2.1 mg.L-1 min-1 considering the time taken for 90 % of
removal from the initial value (t90%). In our case the cell
shown 6.6 mg.L-1 min-1 of removal rate. Table 1 shows the
comparison between the results from the literature with data taken from Fig. 5. The better performance of the cell designed for this work is evident. Using a lower porosity RVC cathode, lower potential for Cu(II) reduction, which means saving of energy, and lower flow rate, that makes the details of construction simpler, our cell presented a greater removal rate than the design used in Ref. 10.
In a new series of experiments using lead containing electrolyte the role of the flow rate on the cell performance was investigated. Electrolysis was carried out using poten-tial of -0.8 V vs. SCE. Figure 6 illustrates the decreasing in normalized Pb(II) concentration, [C(t)/C(0)], plotted against the length of time of electrolysis, using different E (V v s.S C E )
I (m
A
)
f (s )0 .5 -0 .5 3 6 00 rpm
2 5 00 rpm
1 6 00 rpm 9 0 0 rpm
4 0 0 rpm 0 .2 5
0 .2
0 .1 5
0 .1
0 .0 5
0
-0 .0 5
2 1 0
0 2 4 6 8
-1 .4 -1 -0 .6 -0 .2 0 .2
I
(m
A
c
m
)
-2
Figure 3. Voltammograms obtained on a glassy carbon rotating disc electrode. Solution of 50 mg/L of Pb(II). Scan rate 10 mV/s. Rotation rates as indicated on the graph. Inset: Levich plot using the limiting current values taken at the mid point of the plateaus.
E (V v s.S C E )
I (m
A
) f (s )0 .5 -0 .5
1 6 00 rpm
9 0 0 rpm 4 0 0 rpm 3 6 00 rpm 2 5 00 rpm 0 .6
0 .5
0 .4
0 .3
0 .2
0 .1
0 .0
8 .0 6 .0 4 .0 2 .0 0 .0
0 .0 5 .0 1 0.0
-1 .8 -1 .6 -1 .4 -1 .2 -1 .0
I
(m
A
c
m
)
-2
Figure 4. Voltammograms obtained on a glassy carbon rotating disc electrode. Solution of 50 mg/L of Zn(II). Scan rate 2 mV/s. Rotation rates as indicated on the graph. Inset: Levich plot using the limiting current values taken at the mid point of the plateaus.
Table 1. Removal of copper ion from sulphate medium. Comparison between cell performances.
RVC grade (ppi)
Flow rate (m s-1)
Initial [Cu(II)] (mg/L)
t90% (min)
Removal rate (mg/L min)
Final [Cu(II)] (mg/L)
Ref. 10 100 0.04 52 22.5 2.1 0.4
flow rates (60, 120 and 240 L/h) for a 60 ppi cathode. All the curves had the same profile in which the lead ion concentration dropped nearly exponentially with the time. Figure 6 also shows that the Pb(II) concentration decreased from the initial values to less than 0.1 mg/L after an electrolysis time of 20 to 30 min, depending on the flow rate. The data show that the reduction of lead into the RVC cathode is sensitive to the flow rate. Removal rate increases with the flow rate used for the cell operation. Table 2, that shows the effect of the flow rate on the removal rate, also includes data for a 80 ppi esponje.
Figure 6 also shows in the inset that plot of ln[C(t)/C(0)] vs. time of recirculation during cathodic polarization is linear. Controlled potential electrolysis at a reticulated carbon cathode in a similar recycle-mode was also
investi-gated by Pletcher et al.9 According to these authors,
batch-recycle systems similar to that employed in the present work may be modeled very satisfactorily as a simple batch reactor, with no significant need to use a batch-recycle model. For a batch system:
ln[C(t)
C(0)] =
−Ve km Ae
Vr t (1)
where Ve is the cathode volume, Ae is the specific surface
area (i.e., the active area/unit volume of the cathode), Vr is
the total volume of catholyte in the cell, km is the mass
transfer coefficient and C(t) is the concentration of the metallic ion as a function of electrolysis time.
Since Ve/Vr is a constant, the values of km.Ae, taken
from the slopes of ln C(t)/C(0) vs. time plots give an indication of cell efficiency for each operating condition.
If we take into account that Ve/Vr is 0.027 for the cell
configuration used in this study and the approximate elec-trode areas taken from the RVC manufacturer’s literature,
it is possible to calculate the mass transport coefficient, km,
also presented in Table 2. It is possible to note that the mass transport coefficient increases with the flow rate. For higher flow rates, hydrodynamic condition improves the mass transfer within the porous cathode probably reducing the diffusion layer thickness. Results depicted in Table 2 also indicates that the cathode porosity can be used for optimizing the cell performance for the removing of metals. In order to investigate how does the cathode porosity modify the efficiency of the cell a new set of experiments were carried out using a zinc containing electrolyte which composition was described in the experimental section. The influence of the cathode porosity on the effectiveness of electrolysis is depicted in Fig. 7 which shows the experi-ments of zinc removal using potential of -1.35 V vs. SCE. Different RVC porosities (45, 60, 80 and 100 ppi) were
Table 2. Effect of the flow rate on the removal rate and on the mass transport coefficient for two different RVC esponjes.
60 L/h 120 L/h 240 L/h
RVC (ppi) C(0) (mg/L)
t90% (min)
km* C(0) (mg/L)
t90% (min)
km* C(0) (mg/L)
t90% (min)
km*
60 45.0 19.2 0.12 52.0 13.4 0.17 41.7 9.8 0.18
80 51.7 8.9 0.16 45.0 8.2 0.22 43.3 8.8 0.25
* km values in cm min-1.
T im e (m in )
C(
t)
(
m
g
/L)
5 0
4 0
3 0
2 0
1 0
0
0 1 0 2 0 3 0
Figure 5. Concentration vs. time curves for copper removal experiment obtained for a 120 L/h flow rate and cathode porosity of 60 ppi. Initial concentration was 48 mg/L of Cu(II). Potential of -0,3 V vs. SCE.
T im e (m in )
T im e (m in )
C
(t)
/C
(0
) ln
[C
(t
) /C
(0
)]
0 1 0 2 0 3 0
0
-3
-6 1 .0
0 .9 0 .8 0 .7 0 .6 0 .5 0 .4 0 .3 0 .2 0 .1 0 .0
0 5 1 0 1 5 2 0 2 5 3 0
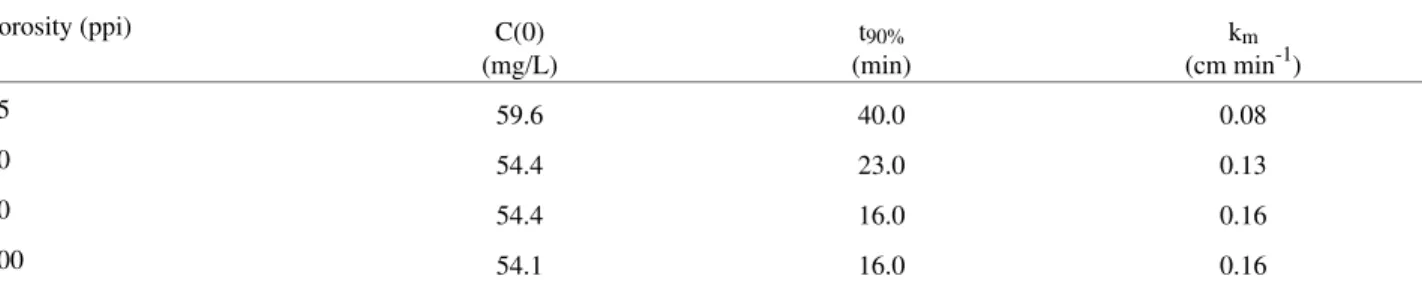
used under a flow rate of 120 L/h. After 20 to 40 min. of electrolysis a concentration of 0.1 mg/L is reached. Table 3 shows results for zinc removal experiments using differ-ent RCV porosities. To achieve lower concdiffer-entrations of Zn(II), the electrolysis demanded less time for higher po-rosities. This behavior reflects differences in the specific surface areas of RVC cathodes, since an increase in RVC porosity results in a larger area being available for the electrodeposition. The data show that as the porosity in-creases, the reduction of Zn(II) becomes more effective, with a clear limiting value of 80 ppi from which the mass transport coefficient, calculated using Eq. 1, becomes con-stant.
Although the plots for lead concentration as a function of the electrolysis time were apparently exponential, the expectation of linearity for the plot of ln[C(t)/C(0)] vs. time, shown in the inset from Fig. 6, was confirmed only for the first 30 min. of electrolysis. For longer experiment times, when the efficiency of removal was greater than 90%, a deviation from linearity occurred. The reason for that is the probable loss of current efficiency as lead is being re-moved. If we consider the decay of zinc shown in Fig. 7, linearity between ln[C(t)/C(0)] and time of electrolysis commences after 10 min. of polarization. Decay of zinc in
this interval of time is a slow process, and thereafter, it assumes the expected behavior as can be seen in the inset from Fig. 7. This is an unexpected result if we compare with the data for the removal of lead. The reason for this behav-ior is attributed to a competitive process of chemical disso-lution of the just growth zinc nuclei in the chloride medium. This effect is even more pronounced for lower values of pH.
Conclusions
Hydrodynamic voltammetry was adequate for studying the Cu(II), Pb(II) and Zn(II) reduction reaction under mass transport control. The limiting current plateaus in the re-sulting voltammograms showed the range of potential over which the metals reduction reaction is mass-transfer con-trolled.
Using these potentials, the concentration of the metal
ion containing solution was reduced from ≈50 to 0.1 mg/L
during recirculation times ranging from 20 to 40 min., depending on the RVC porosity and the flow rate. Best rates of metals removal were obtained at the higher cathode porosities and higher flow rates.
The cell design used in this study showed a good performance in the removal of metals from simulated ef-fluents.
References
1. H.A.Waldron, (Ed.), Metals in the environment. Lon-don: Academic Press, Ch 6, p.155-197, 1980.
2. Boeckx, R. Anal. Chem. 1986, 58, 274A.
3. Water Regulations Act, US Environment Protection Agency, Washington, D.C., (1989). and Brazilian
Legislation: Resolução CONAMA no. 20 (1986).
4. Alkire, R.; Ng, P.K. J. Electrochem. Soc. 1977, 124,
1220.
5. Tentorio, A.; Casolo-Ginelli, U. J. Appl. Electrochem-istry 1978, 8, 195.
6. Sioda, R.E.; Piotrowska, H. Electrochim. Acta 1980,
25, 331.
7. Simonssom, D. J.Appl. Electrochemistry 1984, 14,
595.
8. Carta, R.; Palmas, S.; Polcaro, A.M.; Tola, G. ibid 1991, 21, 793.
Table 3. Effect of the RVC cathodes porosity on the removal rate of zinc from chloride medium.
Porosity (ppi) C(0)
(mg/L)
t90% (min)
km (cm min-1)
45 59.6 40.0 0.08
60 54.4 23.0 0.13
80 54.4 16.0 0.16
100 54.1 16.0 0.16
T im e (m in )
T im e (m in )
C
(t)
/C
(0
)
ln
[C
(t
) /
C
(0
)]
1 0 2 0 3 0
0
-3
-6 1 .0
0 .9 0 .8 0 .7 0 .6 0 .5 0 .4 0 .3 0 .2 0 .1 0 .0
0 1 0 2 0 3 0 4 0
9. Pletcher, D.; White, I.; Walsh, F.C.; Millington, J.P. ibid 1991, 21, 659.
10. Pletcher, D.; White, I.; Walsh, F.C.; Millington, J.P. ibid 1991, 21, 667.
11. Wang, J.; Dewald, H.D. J.Electrochem. Soc. 1983,
130, 1814.
12. Abda, M.; Gaura, Z.; Oren, Y. J.Appl.
Electrochemis-try 1991, 21, 734.
13. Oren, Y.; Soffer, A. Electrochim. Acta 1983, 28, 1649.
14. Matlosz, M.; Newman, J. J. Electrochem. Soc. 1986,
133, 1850.
15. Langlois, S.; Nanzer, J.O.; Coeuret, F. J. Appl. Elec-trochemistry 1989, 19, 736.
16. Bockris, J.O’M.; Bhardwaj, R.C.; Tennakoon, C.L.K. Analyst 1994, 119, 781.
17. Wang, J. Electrochim. Acta 1981, 26, 1721.
18. Greef, R.; Peat, R.; Peter, L.M.; Pletcher, D. In Instru-mental Methods in Electrochemistry, Chichester: Ellis Horwood, 1990.
![Figure 6 also shows in the inset that plot of ln[C(t)/C(0)]](https://thumb-eu.123doks.com/thumbv2/123dok_br/18987857.459521/5.918.484.805.572.813/figure-shows-inset-plot-ln-c-t-c.webp)