Artigo
*e-mail: [email protected]
VALIDATION OF AN ANALYTICAL METHODOLOGY FOR THE QUANTITATIVE ANALYSIS OF PETROLEUM HYDROCARBONS IN MARINE SEDIMENT SAMPLES
Eloy Yordad Companioni Damas*, Miriam Odette Cora Medina, Ana Catalina Núñez Clemente and Miguel Ángel Díaz Díaz
Environmental Chemistry Laboratory, Petroleum Research Center, 169 Washington Road, Havana, Cuba Luis González Bravo
Center of Nuclear Technological Applications and Development, 30 Ave., Havana, Cuba Rolando Marbot Ramada
Analytical Chemistry Laboratory, Petroleum Research Center, 169 Washington Road, Havana, Cuba Rodny Montes de Oca Porto
Antidoping Laboratory, 100 Street, Havana, Cuba
Recebido em 18/2/08; aceito em 20/10/08; publicado na web em 25/3/09
This work describes a validation of an analytical procedure for the analysis of petroleum hydrocarbons in marine sediment samples. The proposed protocol is able to measure n-alkanes and polycyclic aromatic hydrocarbons (PAH) in samples at concentrations as low as 30 ng/g, with a precision better than 15% for most of analytes. The extraction efficiency of fortified sediments varied from 65.1 to 105.6% and 59.7 to 97.8%, for n-alkanes and PAH in the ranges: C16 - C32 and fluoranthene - benzo(a)pyrene, respectively. The
analytical protocol was applied to determine petroleum hydrocarbons in sediments collected from a marine coastal zone.
Keywords: validation; marine sediments; petroleum hydrocarbons.
INTRODUCTION
The analysis of oil-spill-related environmental samples is extre-mely important in view of the wide distribution of oil pollution in the environment. Petroleum pollutants cause extensive damage to marine life, human health and natural resources, and its compositional study allows the understanding of the fate and behavior of pollutants and the prediction of the potential long-term impact of spilled oils on the environment.
Petroleum contains thousands of different organic compounds. In response to the petroleum hydrocarbon determination in the marine environment, attention has focused on the development of flexible, tiered analytical approaches for compositional analysis by gas chromatography – mass spectrometry (GC-MS) and GC-flame ionization detection (FID).1-3 These analytical techniques allow the determination of individual petroleum hydrocarbons and their relative distribution patterns in a complex mixture of compounds.
The analysis of organic traces in complex matrices usually involves several steps. Basically, an extraction step is followed by an extensive clean-up and fractionation of the extract, and finally the instrumental separation of the analytes are achieved by chro-matography techniques. Mechanical shaking or stirring, soxhlet and ultrasonic extraction, are the most commonly used methods for extracting petroleum pollutants from marine sediments and other solid environmental materials.4,5 For the pre-separation or fractionation of crude oil numerous procedures have been reported in the literature. These procedures include high-performance liquid chromatography separation,6,7 supercritical fluid chromatography separation,8,9 the classical adsorption chromatography on various adsorbents, including silica gel,10 alumina,11 silica-alumina combinations,12,13 florisil,14 and solid phase extraction (SPE).15
This paper focus on the validation of an analytical methodology
for the determination of petroleum hydrocarbons in marine sediment samples. Studied analytes include n-alkanes and polycyclic aromatic hydrocarbons (PAH). The validated method was used on real samples to characterize the chemical composition of oil residues, and the analyses of “source-specific marker” compounds.
EXPERIMENTAL Reagents and chemical
Dichloromethane, n-hexane, toluene and ciclohexane, were HPLC-grade and purchased from Merck, (Darmstadt, Germany). Anhydrous sodium sulfate was from Sharlau, (Barcelona, Spain) and was cleaned by baking at 400 oC for 4 h before the use. Aluminium oxide and silica were from Merck (Darmstadt, Germany), activated at 240 oC for 4 h and then desactivated with 2 and 5% of Milli-Q water, respectively. Copper powder was activated with 5% hydrochloric acid for 30 s, then cleaned with Milli-Q water and finally with acetone, and were used during the extraction in order to remove the sulfur.
Individual PAH were used as standards (naphthalene – Nap, acenaphthene – Ace, fluorene –Flu, dibenzothiophene – Dbt, an-thracene – Ant, phenanthrene –Phe, fluoranthene – Flt, pyrene – Pyr, chrysene – Chr, benzo(a)anthacene – BaAnt, benzo(a)pyrene – BaPyr). The n-alkanes used as standards were n-tetradecene (C14), n-pentadecene (C15), n-hexadecene (C16), n-octadecene (C18), n-nonadecene (C19), n-eicosane (C20), n-docosane (C22), n-tricosane (C23), n-tetracosane (C24), n-pentacosane (C25), n-hexacosane (C26), n-octacosane (C28), n-dotriacontane(C32). These standards were pur-chased from Fluka (Steinheim, Switzerland).
Sample collection and pretreatment
March, 2006. Sediments were stored in pre-cleaned aluminium boxes, and were kept at -20 oC until laboratory analysis. Before extraction sediments were defrosted, dried (45 oC) overnight, and passed through a sieve (2000 µm) to remove gravel and detritus.
Spiking procedure
The analytical protocol was validated using spiked samples. For this purpose, sediment collected at a coastal uncontaminated area was used. This marine sediment contained biogenic n-alkanes and not included PAH. Immediately prior to the extraction, individual samples were spiked with n-alkanes and PAH standard mixtures using increasing concentration for each analyte over a range between 33 and 200 ng/g, and then extracted and subjected to the clean-up process. Spiked and non-spiked samples were compared systematically.
Soxhlet extractions
Dried sediment samples (30 g) were Soxhlet-extracted with 150 mL of dichloromethane for a period of 16 h. Activated powder copper (5 g) was added to the extraction balloons for elemental sulphur re-moval. The extract were dried in a column containing glass wool and 2 g of Na2SO4, and concentrated on a Kuderna Danish to a volume of approximately 2 mL. The extraction solvent was exchanged into ciclohexane and the further volume reduction was achieved with a gentle stream of ultra pure nitrogen until 0.5 mL.
Clean-up and fractionation of the extracts
The aim of the clean-up step is to remove other unwanted co-extracted materials like biogenic macromolecules, lipids and pigments which may interfere in the final determination and quantification of the compounds of interest. The separation of the groups of analytes into appropriate fractions for analysis is achieved also.
The chromatography columns used have an effective height of 55 cm and 1 cm of internal diameter. This column was packed at the bottom with cotton wool and then filled with 7 g of alumina over 7 g of silica gel and 1 cm of sodium sulphate was added at the top of the column. Prior to the addition of the extract, the column was conditioned with 15 mL of n-hexane. The extract (500 µL) is then transferred to the top of the column. The first fraction (aliphatic compounds) is eluted with 20 mL of n-hexane. The second fraction (aromatic hydrocarbons) is eluted with 20 mL of dichloromethane-hexane (50:50, v/v). The collected extracts were concentrated under a stream of nitrogen to the pre-injection volume (50 µL).
Instrumentation and apparatus
The gas chromatographic analysis was performed with a Konik HR 4000B GC instrument, equipped with a flame ionization detec-tor (FID) and a splitless injecdetec-tor (Barcelona, Spain). Samples were separated in a DB-1 fused silica capillary column (30 m, 0.25 mm i.d., 0.25 µm film thickness, Tecknocroma, Spain). Hydrogen was the carrier gas (1 mL/min). For the aliphatic fraction analysis, the oven temperature was programmed as follow: 60 oC held for 2 min, then increased at 6 oC/min to 300 oC, and held for 20 min. For PAH analysis the oven temperature program was: 80 ºC held for 5 min, then increased at 6 oC/min to 300 oC, and held for 20 oC. Injector and detector temperature were 300 oC. The injection volume was 1 µL and the injection was in the splitless mode, keeping the split valve closed for 1 min. GC-FID technique was used for the identification
and quantification of the aliphatic and aromatic hydrocarbons in samples. Compound identification was based on GC retention times of authentic standards, injected and analyzed under the same con-ditions as samples.
The gas chromatography-mass spectrometry (GC/MS) analysis was performed using a Hewlett Packard 6890 equipped with a 5973 MSD (Palo Alto, CA, USA). The capillary column used was coated with DB-1 (12 m, 0.20 mm i.d., 0.33 µm film thickness, HP Ultra II, USA) with helium as carrier gas. The injector and detector were held at 280 and 300 ºC, respectively. The ionization was carried out in the electron impact mode (70 eV). The electron multiplier voltage and automatic gain control target were set at 290 Pand 230 oC, respectively. The MS operated in a total ion current (TIC) mode, and the mass range scanned was from 50 to 550 amu. The column was held at 60 oC for 2 min, increased to 290 ºC at a rate of 3 oC/min, and held for 10 min. This technique was used for the identification of biogenic unknown peaks and petroleum bioma-rkers in selected samples. Compounds identification was based on individual mass spectra.
Blank
A procedure blank was analyzed periodically for each batch of 10 samples. It was prepared using the entire analytical procedure as well as the same reagents and solvents as for the samples. The purpose of the analytical blank is to check the absence of contamination by interfering compounds, which cause quantification mistakes.
RESULTS AND DISCUSSION
Calibration and linearity of the instrumental response
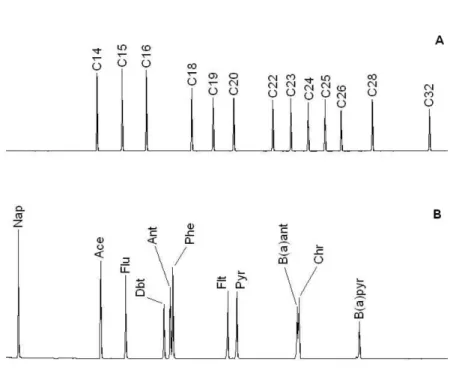
Calibration curves were constructed with the external standard multipoint calibration for each n-alkane and PAH. Quantification of the analyzed compounds was performed in the linear range of the calibration curves. PAH not well resolved under the capillary chromatography conditions (anthracene and phenanthrene, benzo(a) antracene and chrysene) (Figure 1S) were quantified in pairs. The concentration ranges was appropriate to the levels usually found in environmental samples.
For the quantification of the total aliphatic and aromatic hydro-carbon fractions, calibration curves conformed by standard mixtures were established. In this method of calculation, all standard elut-ing between C14 and C32 were assumed to be a mixture of various normal-chain hydrocarbons, branched-chain hydrocarbons, and cyclic hydrocarbons. In the case of aromatic compounds, all standards eluting between naphthalene and benzo(a)pyrene were assumed to be a mixture of different alkylated and non-alkylated aromatics, composed by 2 – 5 aromatic rings, and cycloalkane-aromatic hybrid structures. In these graphs, X is defined as the sum of the individual hydrocarbons amounts, and Y as the sum of the peak areas of indi-vidual hydrocarbons.
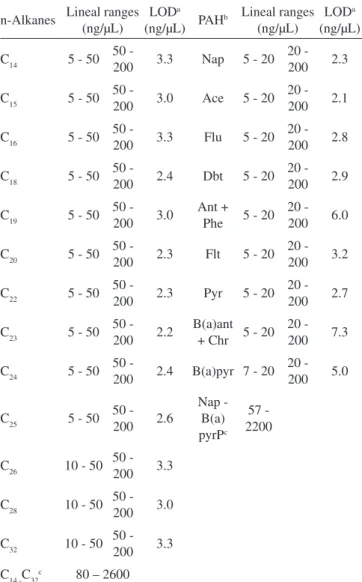
From the regression analysis of the peak areas versus injected concentrations, curves plotted from five points were achieved with the linearity ranges: 5-50 and 50-200 ng/µL for n-alkanes, and 5-20 and 20-200 ng/µL for PAH (Table 1). F-test at a 0.05 significance level was used to check the fit of experimental data to the linear model. For some compounds the lineal ranges begin at higher concentration values. Regression coefficients were higher than 0.99 for all analytes.
Extraction
Recoveries were calculated from the increase in concentration between the non-spiked and spiked samples, and provided an es-timation of the accuracy of the whole procedure. For each spiked level, the extraction and clean-up procedure were performed over 4 replicates. The recoveries of the added compounds at the 116 ng/g spiked level are shown in Figure 1. Lower recoveries values corres-pond to the n-alkanes: C14 and C15, and the PAH: naphthalene and acenaphthene. These compounds are volatile and then partially lost during the evaporation of the solvent extract in the nitrogen stream. Recoveries that varied from 65.1 to 105.6% and 59.7 to 97.8% were obtained for the n-alkanes ranged between C16 and C32 and PAH between fluoranthene and benzo(a)pyrene, respectively.
The precision of the analytical protocol was expressed as relative standard deviations (RSD, %), and varied from 3.4 to 13.3% and
8.6 to 12.3% for n-alkanes and PAH in the elution ranges between C16 – C32 and fluorene – benzo(a)pyrene, respectively. The volatile analytes C14 and naphthalene showed higher RSD values (37.4 and 24.3%, respectively), which could be explained due to their more significant losses during the multi-step process of spiking, extraction and evaporation.
The precision and extraction efficiency obtained with this method were comparable to results which have been published using soxhlet extraction for determining PAH in marine sediment.16 The good re-he good re-producibility of the extraction and pre-separation steps, indicates that the protocol is suitable for the determination of n-alkanes and PAH in marine sediments, at a concentration interval bellow 200 ng/g.
Limit of detection and limit of quantification
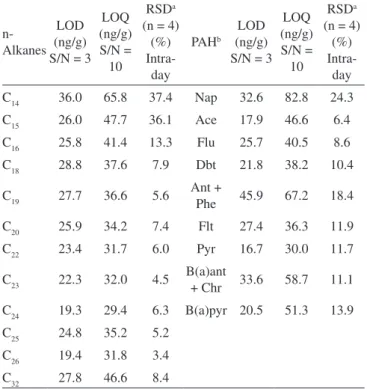
Limit of detection (LOD) and limit of quantification (LOQ) are the minimum amount of target analyte that produce a chromatogra-phic peak with a signal/noise ratio (S/N) of 3 and 10, respectively. The base line peak-to-peak noise (N) was measured on the chroma-togram of a sample blank processed by the analytical method for a specified interval of time before and after the analyte retention time. LOD and LOQ were calculated by progressively decreasing the analyte concentration in the spiked sample, such that GC-FID signals were clearly discerned at the final lowest concentration with S/N of 3 and 10, respectively. The results obtained are sum-marized in Table 2. LOD values ranged from 19.3 to 36.0 ng/g for n-alkanes, and from 16.7 to 45.9 ng/g for PAH. LOQ were ranged from 31.7 to 65.8 ng/g and 30.0 to 82.8 ng/g for n-alkanes and PAH, respectively. Higher values correspond to analytes more affected for evaporation losses.
Table 1. Linear ranges and limits of detection obtained from the GC-FID analysis of standard solutions
n-Alkanes Lineal ranges (ng/µL)
LODa
(ng/µL) PAH
b Lineal ranges (ng/µL)
LODa (ng/µL)
C14 5 - 50 50 -
200 3.3 Nap 5 - 20
20 -
200 2.3
C15 5 - 50 50 -
200 3.0 Ace 5 - 20
20 -
200 2.1
C16 5 - 50 50 -
200 3.3 Flu 5 - 20
20 -
200 2.8
C18 5 - 50 50 -
200 2.4 Dbt 5 - 20
20 -
200 2.9
C19 5 - 50 50 -
200 3.0
Ant + Phe 5 - 20
20 -
200 6.0
C20 5 - 50 50 -
200 2.3 Flt 5 - 20
20 -
200 3.2
C22 5 - 50 50 -
200 2.3 Pyr 5 - 20
20 -
200 2.7
C23 5 - 50 50 -
200 2.2
B(a)ant + Chr 5 - 20
20 -
200 7.3
C24 5 - 50 50 -
200 2.4 B(a)pyr 7 - 20
20 -
200 5.0
C25 5 - 50 50 -
200 2.6 Nap - B(a) pyrPc 57 - 2200
C26 10 - 50 50 -
200 3.3
C28 10 - 50 50 -
200 3.0
C32 10 - 50 50 -
200 3.3
C14 -C32c 80 – 2600
aExperimentally determined limit of detection (S/N, 3:1); 1µL in-jected. b Polycyclic Aromatic Hydrocarbons: Nap: naphthalene, Ace: acenaphthene, Flu: fluorene, Dbt: dibenzothiophene, Ant: anthracene, Phe: phenanthrene, Flt: fluoranthene, Pyr: pyrene, B(a)ant: benzo(a) anthracene, Chr: chrysene, B(a)pyr: benzo(a)pyrene. c Ranges of compounds included in the standard mixtures for the quantification of the total aliphatic and aromatic hydrocarbons. Each standard ranged in concentration levels between 5 and 200 ng/µL.
Uncertainty estimation from the validation data
Measurement uncertainty is a parameter associated with the result of a measurement, which characterizes the dispersion of the values that could reasonably be attributed to the measurand.17 The uncertainty estimation was made according to a procedure proposed in the literature.18,19 The precision and recovery studies undertaken for the validation, were planned and executed in such a way that provide the data required to produce an estimated of the measurement uncertainty. The concentration range covered by the recovery study was used. Table 3 shows the basic equations used for the uncertainty estimation.
In the case of spiked compounds which were as native congeners in the sediments, the uncertainty in the recovery u(R-) was deter-mined by the Equation 1. Otherwise, if the standards were added to blank sediments then the Equation 2 were used. The uncertainty in the concentration of the spike added to the samples (u(Cspike(i)) was determined taking into account all recognised effects operating on this concentration values. The uncertainty in the concentration of the native analyte u(Cnative) was estimated as the standard deviation of the concentration of these compounds.
For each spiked level, the combined uncertainty (uc) was calculated from the standard deviation of the analyte concen-tration (S
Cobs) and u(R
-) using the Equation 4. Therefore, graphs constructed for the uc took account of the concentrations in sediments studied by the analytical protocol, as is illustrated in Figure 2.The expanded uncertainty (U) was calculated affecting the uc by a coverage factor (k) according to the Equation 6. This parameter describes an interval which is expected to include a large fraction of the distribution of values reasonably attributable to the measurand.20
Table 2. Validation parameters for n-alkanes and PAH analysis
n- Alkanes
LOD (ng/g) S/N = 3
LOQ (ng/g) S/N = 10
RSDa (n = 4)
(%) Intra-day
PAHb LOD (ng/g) S/N = 3
LOQ (ng/g) S/N = 10
RSDa (n = 4)
(%) Intra-day
C14 36.0 65.8 37.4 Nap 32.6 82.8 24.3
C15 26.0 47.7 36.1 Ace 17.9 46.6 6.4
C16 25.8 41.4 13.3 Flu 25.7 40.5 8.6
C18 28.8 37.6 7.9 Dbt 21.8 38.2 10.4
C19 27.7 36.6 5.6 Ant +
Phe 45.9 67.2 18.4
C20 25.9 34.2 7.4 Flt 27.4 36.3 11.9
C22 23.4 31.7 6.0 Pyr 16.7 30.0 11.7
C23 22.3 32.0 4.5 B(a)ant
+ Chr 33.6 58.7 11.1
C24 19.3 29.4 6.3 B(a)pyr 20.5 51.3 13.9
C25 24.8 35.2 5.2
C26 19.4 31.8 3.4
C32 27.8 46.6 8.4
a Relative Standard Deviations determined at the 116 ng/g spiked level. b Polycyclic Aromatic Hydrocarbons: Nap: naphthalene, Ace: acenaphthene, Flu: fluorene, Dbt: dibenzothiophene, Ant: anthracene, Phe: phenanthrene, Flt: fluoranthene, Pyr: pyrene, B(a)ant: benzo(a) anthracene, Chr: chrysene, B(a)pyr: benzo(a)pyrene.
Figure 2. Relationship between combined uncertainty (uc) and concentration for C16
Table 3. Summary of equations for uncertainty estimation
(1)
(2)
(3)
(4)
(5)
u(R-): uncertainty in the recovery, R- : mean recovery, Cnative: concentra-tion of the analyte in the unspiked sample, Cobs(i): concentration of the analyte observed for the spiked sample i, Cspike(i): concentration of the spike added to the sample i, u(Cnative): uncertainty in the concentration of the native analyte, uC(spike(i)): uncertainty in the concentration of the spike added to the sample i, m-obs: mean weight of the spike recovered from the samples, mspike: weight of the spike added to each sample, u(mspike): uncertainty in the amount of spiked added to each sample, S
mobs: standard deviation of the weight results observed from the spiked samples, n: number of replicates, uC: combined uncertainty, S
Cobs: standard deviation of the concentration results observed from the spiked samples, U: expanded uncertainty, k: coverage factor.
Application to real sediment samples
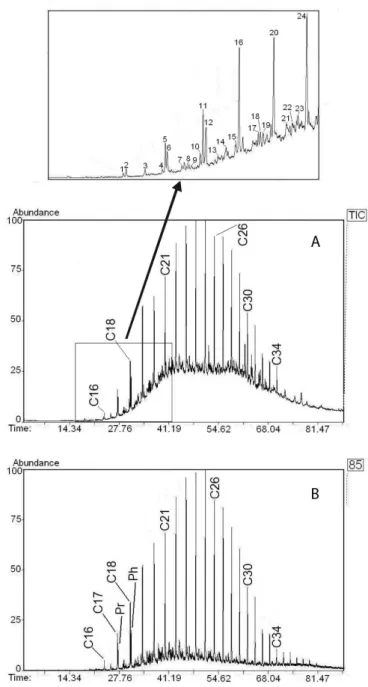
cor-respond to only a minor amount of the total aliphatic hydrocarbons. The majority of the compounds presents in this fraction are molecules that can not be resolved by capillary GC columns and are termed unresolved complex mixture (UCM). The UCM appears in the GC trace as a hump area between the solvent baseline and the curve defining the base of resolvable peaks (see Figure 3). It consists of a complex mixture of branched alicyclic hydrocarbons,21 and has a well-known linkage to biodegraded petroleum residues.13,22,23 In this case, a bimodal envelope predominated with elution ranges between C18 – C26 and C27 – C34.
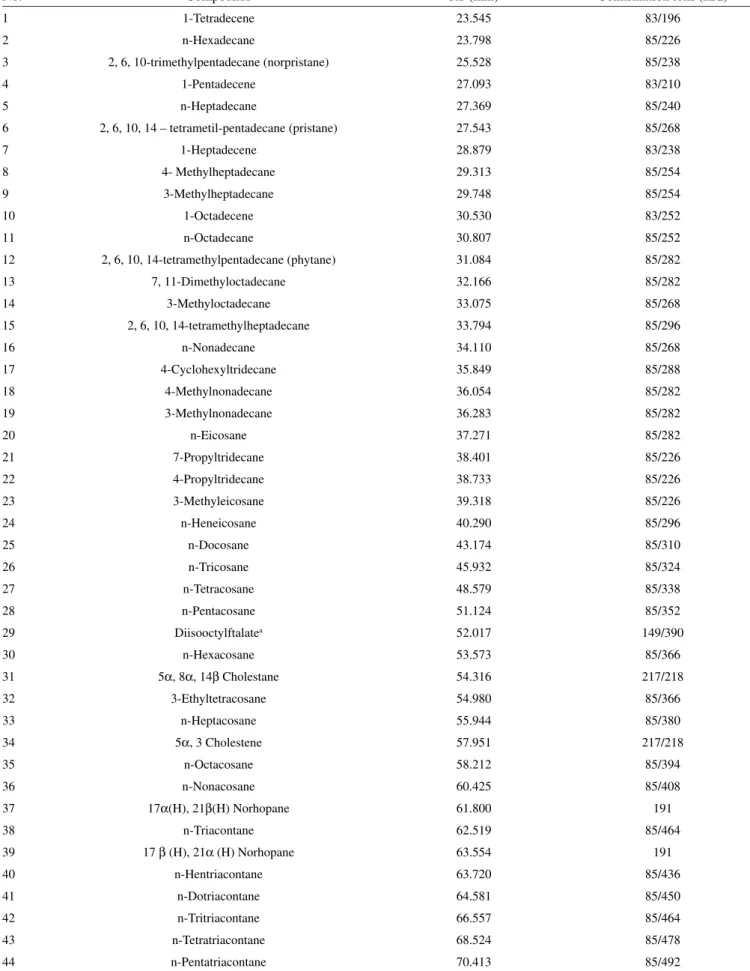
Figure 4 shows the total ion chromatogram and the m/z 85 mass fragmentogram of a representative aliphatic fraction. The significant advantage of using the m/z 85 mass fragmentogram is that it gives clean and detailed compositional information about n-alkanes and isoprenoid constituents, with minimum interference from other aliphatic hydrocarbons. The isoprenoid hydrocarbons, pristane (2, 6, 10, 14 – tetramethylpentadecane) and phytane (2, 6, 10, 14 – te-tramethylhexadecane) specified in the fragmentogram (Figure 4B), are geologic biomarkers used as indication of petroleum inputs, and are derived from the diagenetic transformation of phytol and other isoprenoidyl natural products.21 The resolution of C
17/pristane and C18/phytane is clearly shown in the selected section of the total ion chromatogram.
GC-MS-TIC method was able to identify more than 40 different aliphatic hydrocarbons (Table 1S) including n-alkanes, branched alkanes and alkenes. Biogenic alkenes have been widely found in sediments and algae,25,26 and are associated to the production of marine biogenic material in the aquatic environment. Detected hopanes and steranes constitute a further indication of the presence of fossil fuel hydrocarbons in this marine environment, as already suggested by the existence of UCM and the biomarkers pristane and phytane. The hopane homologue with the thermodynamically more stable 17α(H), 21β(H) configuration was also identified, which constitute one of the most recalcitrant organic pollutants from petrogenic sources found in the environment.10,27
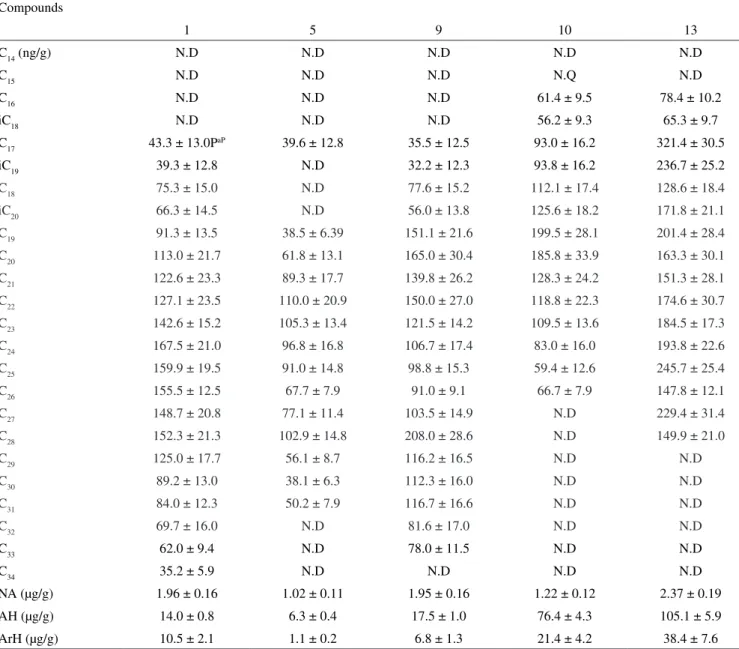
The lower molecular weight n-alkanes were absent in the analyzed marine sediments. (Quantitative results obtained from the analysis of representative sediment samples are shown inTable 2S). The probable reason is that the low molecular weight compounds are more readily volatilized to the atmosphere, whereas the higher molecular weight constituents can be expected to partition on to the particulate phase and undergo sedimentation. On the other hand, volatile analytes can reduce its concentration to non-detected levels due to additional losses during the evaporation process. To measure the total n-alkane content in samples each n-alkane concentration has been considered. Total
n-alkanes varied in the range between 0.28 ± 0.07 and 2.37 ± 0.19 ng/g and the total aliphatic hydrocarbon concentrations varied from 3.1 ± 0.2 to 105.1 ± 5.9 µg/g. Sample 13 showed the prevalence of the n-C17 alkane which is indicative of the input of marine-derived hydrocarbons.28
The chromatographic profiles of aromatic fractions appear as an envelope with no resolved peaks (Figure 2S) which is typical of highly weathered aromatic fractions.29 Under this highly weathered conditions the 2 – 3 aromatic ring compounds were lost, and the remaining constituents were in such concentration that the GC-FID and the full scan analyses were inadequate for a detailed evaluation. For this reason, the determination of individual polyaromatic com-pounds would require a more sensitive and discriminating technique. In this case, the aromatic fractions were quantified as total aromatic hydrocarbons and were ranged from 1.1 ± 0.2 to 38.4 ± 7.6 µg/g.
Figure 3. GC-FID chromatogram of an aliphatic hydrocarbon fraction
ex-tracted from a marine sediment sample
CONCLUSIONS
An analytical method has been validated for the analysis of hydrocarbons in marine sediment samples. Hydrocarbon extracts were measured by GC-FID and GC-MS-TIC after clean-up and separation process. The proposed protocol is able to measure n-alkanes and PAH in sediment samples at concentration as low as 30 ng/g. The precision of the method was better than 15% for most of analytes. The n-alkanes distribution in several collected samples, showed differences which contributed to the origin of the organic inputs and the weathered process. More than 40 aliphatic hydrocarbons were identified by GC-MS-TIC, including phytoplanktonic-derived constituents and petroleum biomarkers. This procedure provides information about the distribution and behaviour of petroleum pollutants in the marine environment.
SUPPLEMENTARY MATERIAL
Available in http://quimicanova.sbq.org.br. Figure 1S. Separation of n-alkanes (A) and PAH (B) obtained from the GC-FID analysis of standard solutions. See Instrumentation and Apparatus for chro-matographic conditions. Nap: naphthalene, Ace: acenaphthene, Flu: fluorene, Dbt: dibenzothiophene, Ant: anthracene, Phe: phenan-threne, Flt: fluoranthene, Pyr: pyrene, B(a)ant: benzo(a)anthracene, Chr: chrysene, B(a)pyr: benzo(a)pyrene. Figure 2S. Characteristic gas chromatogram of aromatic hydrocarbon fractions extracted from collected marine sediments. Table 1S. Aliphatic compounds identified in the total ion chromatogram displayed in Figure 4A. Table 2S. Concentrations of hydrocarbons determined in represen-tative marine sediment samples.
REFERENCES
1. Ramos, L.; Vreuls, J. J.; Brinkman, U. A. Th.; J. Chromatogr., A 2000, 891, 275.
2. Wang, Z.; Li, K.; Fingas, M. F.; Sigouin, L.; Ménard, L.; J. Chromatogr., A 2002, 971, 173.
3. Basheer, C.; Obbard, J. P.; Lee, H. K.; J. Chromatogr., A 2005, 1068, 221.
4. Mzoughi, N. ; Hellal, F.; Dachraoui, M.; Villeneuve, J.-P.; Cattini, C.; de Mora, S. J.; El Abed, A. C.; R. Geoscience 2002, 334, 893. 5. Song, Y. F.; Jing, X.; Fleischmann, S.; Wilke, B. –M.; Chemosphere
2002, 48, 993.
6. Lucke, R. B.; Later, D. W.; Wright, C. W.; Chess, E. K.; Weimer, W. C.; Anal. Chem. 1985, 57, 633.
7. Witt, G.; Trost, E.; Chemosphere 1999, 38, 1603. 8. Campbell, R. M.; Lee, M. L.; Anal. Chem. 1986, 58, 2247.
9. Nishioka, M.; Whiting, D. G.; Campbell, R. M.; Lee, M. L.; Anal. Chem.
1986, 58, 2251.
10. Zakaria, M. P.; Horinouchi, A.; Tsutsumi, S.; Takada, H.; Tanabe, S.; Ismail, A.; Environ. Sci. Technol. 2000, 34, 1189.
11. Burns, K. A.; Codi, S.; Pratt, C.; Duke, N. C.; Org. Geochem. 1999, 30, 1273.
12. Hostettler, F. D.; Pereira, W. E.; Kvenvolden, K. A.; van Genn, A.; Luoma, S. N.; Fuller, C. C.; Anima, R.; Mar. Chem. 1999, 64, 115. 13. Grossi, V.; Massias, D.; Stora, G.; Bertrand, J. – C.; Chemosphere 2002,
48, 947.
14. El Nemr, A.; Abd-Allah, A. M. A.; Chemosphere 2003, 52, 1711. 15. Theobald, N.; Anal. Chim. Acta 1988, 204, 135.
16. Jaouen-Madoulet, A.; Abarnou, A.; Le Guellec, A. -M.; Loizeau, V.; Leboulenger, F.; J. Chromatogr., A 2000, 886, 153.
17. Quantifying Uncertainty in Analytical Measurement; EURACHEM/ CITAC Guide, 2nd ed., 2000.
18. Barwick, V. J.; Ellinson, S. L. R.; The Analyst 1999, 124, 981. 19. Barwick, V. J.; Ellinson, S. R. L.; Protocol for uncertainty evaluation from
validation data; VAM Project 3.2.1. Development and harmonisation of measurement uncertainty principles. Part D. 2000.
20. ISO/TS 21748: 2004 - ISO 3534 – 1 Statistics. Vocabulary and Symbols. Part 1: Probability and general statistical terms. 1st ed., Geneva, 1993.
21. Peters, K. E.; Walters, C. C.; Moldowan, J. M.; Biomarkers and Isotopes in the Environment and Human History, The Biomarker Guide, Vol. I, 2nd ed., Cambridge University Press: New York, 2005.
22. Wang, Z.; Fingas, M.; J. Chromatogr., A 1995, 712, 312.
23. Wang, Z.; Fingas, M.; Blenkinsopp, S.; Sergy, G.; Landriault, M.; Sigouin, L.; Foght, J.; Semple, K.; Westlake, D. W. S.; J. Chromatogr., A 1998a, 809, 89.
24. Wang, Z.; Fingas, M.; Blenkinsopp, S.; Sergy, G.; Landriault, M.; Sigouin, L.; Lambert, P.; Environ. Sci. Technol. 1998b, 32, 2222. 25. Rowland, S. J.; Yon, D. A.; Lewis, C. A.; Maxwell, J. R.; Org. Geochem.
1985, 8, 207.
26. Belt, S. T.; Massé, G.; Allard, W. D.; Robert, J-M.; Rowland, S. J.; Org. Geochem. 2001, 32, 1169.
27. Schwarzbauer, J.; Littke, R.; Weigelt, V.; Org. Geochem. 2000, 31, 1713.
28. Blumer, M.; Guillard, R. R. L.; Chase, T.; Mar. Biol. 1971, 8, 183. 29. Charrié-Duhaut, A.; Lemoine, S.; Adam, P.; Connan, J.; Albrecht, P.;
Material Suplementar
*e-mail: [email protected]
VALIDATION OF AN ANALYTICAL METHODOLOGY FOR THE QUANTITATIVE ANALYSIS OF PETROLEUM HYDROCARBONS IN MARINE SEDIMENT SAMPLES
Eloy Yordad Companioni Damas*, Miriam Odette Cora Medina, Ana Catalina Núñez Clemente and Miguel Ángel Díaz Díaz
Environmental Chemistry Laboratory, Petroleum Research Center, 169 Washington Road, Havana, Cuba Luis González Bravo
Center of Nuclear Technological Applications and Development, 30 Ave., Havana, Cuba Rolando Marbot Ramada
Analytical Chemistry Laboratory, Petroleum Research Center, 169 Washington Road, Havana, Cuba Rodny Montes de Oca Porto
Antidoping Laboratory, 100 Street, Havana, Cuba
Figure 2S. Characteristic gas chromatogram of aromatic hydrocarbon fractions extracted from collected marine sediments
Table 1S. Aliphatic compounds identified in the total ion chromatogram displayed in Figure 4A
No. Compounds RT (min) Confirmation ions (m/z)
1 1-Tetradecene 23.545 83/196
2 n-Hexadecane 23.798 85/226
3 2, 6, 10-trimethylpentadecane (norpristane) 25.528 85/238
4 1-Pentadecene 27.093 83/210
5 n-Heptadecane 27.369 85/240
6 2, 6, 10, 14 – tetrametil-pentadecane (pristane) 27.543 85/268
7 1-Heptadecene 28.879 83/238
8 4- Methylheptadecane 29.313 85/254
9 3-Methylheptadecane 29.748 85/254
10 1-Octadecene 30.530 83/252
11 n-Octadecane 30.807 85/252
12 2, 6, 10, 14-tetramethylpentadecane (phytane) 31.084 85/282
13 7, 11-Dimethyloctadecane 32.166 85/282
14 3-Methyloctadecane 33.075 85/268
15 2, 6, 10, 14-tetramethylheptadecane 33.794 85/296
16 n-Nonadecane 34.110 85/268
17 4-Cyclohexyltridecane 35.849 85/288
18 4-Methylnonadecane 36.054 85/282
19 3-Methylnonadecane 36.283 85/282
20 n-Eicosane 37.271 85/282
21 7-Propyltridecane 38.401 85/226
22 4-Propyltridecane 38.733 85/226
23 3-Methyleicosane 39.318 85/226
24 n-Heneicosane 40.290 85/296
25 n-Docosane 43.174 85/310
26 n-Tricosane 45.932 85/324
27 n-Tetracosane 48.579 85/338
28 n-Pentacosane 51.124 85/352
29 Diisooctylftalatea 52.017 149/390
30 n-Hexacosane 53.573 85/366
31 5α, 8α, 14β Cholestane 54.316 217/218
32 3-Ethyltetracosane 54.980 85/366
33 n-Heptacosane 55.944 85/380
34 5α, 3 Cholestene 57.951 217/218
35 n-Octacosane 58.212 85/394
36 n-Nonacosane 60.425 85/408
37 17α(H), 21β(H) Norhopane 61.800 191
38 n-Triacontane 62.519 85/464
39 17β (H), 21α (H) Norhopane 63.554 191
40 n-Hentriacontane 63.720 85/436
41 n-Dotriacontane 64.581 85/450
42 n-Tritriacontane 66.557 85/464
43 n-Tetratriacontane 68.524 85/478
44 n-Pentatriacontane 70.413 85/492
Table 2S. Concentrations of hydrocarbons determined in representative marine sediment samples
Compounds
1 5 9 10 13
C14 (ng/g) N.D N.D N.D N.D N.D
C15 N.D N.D N.D N.Q N.D
C16 N.D N.D N.D 61.4 ± 9.5 78.4 ± 10.2
iC18 N.D N.D N.D 56.2 ± 9.3 65.3 ± 9.7
C17 43.3 ± 13.0PaP 39.6 ± 12.8 35.5 ± 12.5 93.0 ± 16.2 321.4 ± 30.5
iC19 39.3 ± 12.8 N.D 32.2 ± 12.3 93.8 ± 16.2 236.7 ± 25.2
C18 75.3 ± 15.0 N.D 77.6 ± 15.2 112.1 ± 17.4 128.6 ± 18.4
iC20 66.3 ± 14.5 N.D 56.0 ± 13.8 125.6 ± 18.2 171.8 ± 21.1
C19 91.3 ± 13.5 38.5 ± 6.39 151.1 ± 21.6 199.5 ± 28.1 201.4 ± 28.4
C20 113.0 ± 21.7 61.8 ± 13.1 165.0 ± 30.4 185.8 ± 33.9 163.3 ± 30.1
C21 122.6 ± 23.3 89.3 ± 17.7 139.8 ± 26.2 128.3 ± 24.2 151.3 ± 28.1
C22 127.1 ± 23.5 110.0 ± 20.9 150.0 ± 27.0 118.8 ± 22.3 174.6 ± 30.7
C23 142.6 ± 15.2 105.3 ± 13.4 121.5 ± 14.2 109.5 ± 13.6 184.5 ± 17.3
C24 167.5 ± 21.0 96.8 ± 16.8 106.7 ± 17.4 83.0 ± 16.0 193.8 ± 22.6
C25 159.9 ± 19.5 91.0 ± 14.8 98.8 ± 15.3 59.4 ± 12.6 245.7 ± 25.4
C26 155.5 ± 12.5 67.7 ± 7.9 91.0 ± 9.1 66.7 ± 7.9 147.8 ± 12.1
C27 148.7 ± 20.8 77.1 ± 11.4 103.5 ± 14.9 N.D 229.4 ± 31.4
C28 152.3 ± 21.3 102.9 ± 14.8 208.0 ± 28.6 N.D 149.9 ± 21.0
C29 125.0 ± 17.7 56.1 ± 8.7 116.2 ± 16.5 N.D N.D
C30 89.2 ± 13.0 38.1 ± 6.3 112.3 ± 16.0 N.D N.D
C31 84.0 ± 12.3 50.2 ± 7.9 116.7 ± 16.6 N.D N.D
C32 69.7 ± 16.0 N.D 81.6 ± 17.0 N.D N.D
C33 62.0 ± 9.4 N.D 78.0 ± 11.5 N.D N.D
C34 35.2 ± 5.9 N.D N.D N.D N.D
NA (µg/g) 1.96 ± 0.16 1.02 ± 0.11 1.95 ± 0.16 1.22 ± 0.12 2.37 ± 0.19
AH (µg/g) 14.0 ± 0.8 6.3 ± 0.4 17.5 ± 1.0 76.4 ± 4.3 105.1 ± 5.9
ArH (µg/g) 10.5 ± 2.1 1.1 ± 0.2 6.8 ± 1.3 21.4 ± 4.2 38.4 ± 7.6