AMTD
7, 3253–3299, 2014CARIBIC: comparison between aerosol samples and
OPC
B. G. Martinsson et al.
Title Page
Abstract Introduction
Conclusions References
Tables Figures
◭ ◮
◭ ◮
Back Close
Full Screen / Esc
Printer-friendly Version Interactive Discussion
Discussion
P
a
per
|
D
iscussion
P
a
per
|
Discussion
P
a
per
|
Discuss
ion
P
a
per
|
Atmos. Meas. Tech. Discuss., 7, 3253–3299, 2014 www.atmos-meas-tech-discuss.net/7/3253/2014/ doi:10.5194/amtd-7-3253-2014
© Author(s) 2014. CC Attribution 3.0 License.
Atmospheric Measurement
Techniques
Open Access
Discussions
This discussion paper is/has been under review for the journal Atmospheric Measurement Techniques (AMT). Please refer to the corresponding final paper in AMT if available.
Comparison between CARIBIC aerosol
samples analysed by accelerator-based
methods and optical particle counter
measurements
B. G. Martinsson1, J. Friberg1, S. M. Andersson1, A. Weigelt2,*, M. Hermann2, D. Assmann2, J. Voigtländer2, C. A. M. Brenninkmeijer3, P. J. F. van Velthoven4, and A. Zahn5
1
Division of Nuclear Physics, Lund University, Sweden
2
Leibniz Institute for Tropospheric Research, Leipzig, Germany
3
Division of Atmospheric Chemistry, Max Planck Institute for Chemistry, Mainz, Germany
4
Royal Netherlands Meteorological Institute (KNMI), De Bilt, the Netherlands
5
Institute of Meteorology and Climate Research, Forschungszentrum Karlsruhe, Karlsruhe, Germany
*
AMTD
7, 3253–3299, 2014CARIBIC: comparison between aerosol samples and
OPC
B. G. Martinsson et al.
Title Page
Abstract Introduction
Conclusions References
Tables Figures
◭ ◮
◭ ◮
Back Close
Full Screen / Esc
Printer-friendly Version Interactive Discussion
Discussion
P
a
per
|
D
iscussion
P
a
per
|
Discussion
P
a
per
|
Discuss
ion
P
a
per
|
Received: 5 February 2014 – Accepted: 13 March 2014 – Published: 1 April 2014
Correspondence to: B. G. Martinsson ([email protected])
AMTD
7, 3253–3299, 2014CARIBIC: comparison between aerosol samples and
OPC
B. G. Martinsson et al.
Title Page
Abstract Introduction
Conclusions References
Tables Figures
◭ ◮
◭ ◮
Back Close
Full Screen / Esc
Printer-friendly Version Interactive Discussion
Discussion
P
a
per
|
D
iscussion
P
a
per
|
Discussion
P
a
per
|
Discuss
ion
P
a
per
|
Abstract
Inter-comparison of results from two kinds of aerosol systems in the CARIBIC (Civil Aircraft for the Regular Investigation of the atmosphere Based on an Instrument Con-tainer) passenger aircraft based observatory, operating during intercontinental flights at 9–12 km altitude, is presented. Aerosol from the lowermost stratosphere (LMS), the
5
extra-tropical upper troposphere (UT) and the tropical mid troposphere (MT) were in-vestigated. Aerosol particle volume concentration measured with an optical particle counter (OPC) is compared with analytical results of the sum of masses of all major and several minor constituents from aerosol samples collected with an impactor. Analy-ses were undertaken with accelerator-based methods particle-induced X-ray emission
10
(PIXE) and particle elastic scattering analysis (PESA). Data from 48 flights during one year are used, leading to a total of 106 individual comparisons. The ratios of the particle volume from the OPC and the total mass from the analyses were in 84 % within a rela-tively narrow interval. Data points outside this interval are connected with inlet-related effects in clouds, large variability in aerosol composition, particle size distribution
ef-15
fects and some cases of non-ideal sampling. Overall, the comparison of these two CARIBIC measurements based on vastly different methods show good agreement, implying that the chemical and size information can be combined in studies of the MT/UT/LMS aerosol.
1 Introduction
20
The particles of the atmospheric aerosol have a broad spectrum of sources, where the anthropogenic contribution often can be difficult to quantify due to influences from natural sources at background conditions (Andreae and Rosenfeld, 2008). Despite be-ing trace constituents of the atmosphere, particles are of considerable concern, such as adverse health effects and premature deaths (Pope III and Dockery, 2006) and
cli-25
AMTD
7, 3253–3299, 2014CARIBIC: comparison between aerosol samples and
OPC
B. G. Martinsson et al.
Title Page
Abstract Introduction
Conclusions References
Tables Figures
◭ ◮
◭ ◮
Back Close
Full Screen / Esc
Printer-friendly Version Interactive Discussion
Discussion
P
a
per
|
D
iscussion
P
a
per
|
Discussion
P
a
per
|
Discuss
ion
P
a
per
|
atmospheric particles can act as to mask the climate impact of greenhouse gases (Schwartz et al., 2010).
In this study the aerosol at 9–12 km altitude is investigated, thus dealing with the up-per troposphere (UT) and the lowermost stratosphere (LMS) in the extratropics and the middle troposphere (MT) in the tropics. The vast majority of all studies of atmospheric
5
aerosol concerns surface conditions. Aircraft measurements and remote sensing from the surface (Mattis et al., 2010) or from satellites, such as the NASA satellite CALIPSO (Vernier et al., 2011), are used to study the aerosol at higher altitudes. Besides infor-mation on scattered intensity for a given wavelength, multi-wavelength measurements combined with assumptions on particle composition and shape has been used to
esti-10
mate particle size distribution in the 0.1 to above 1 µm diameter range (Bauman et al., 2003). Smaller particles cannot be detected by remote sensing, and therefore also most of the aerosol dynamics cannot be studied. In addition, aerosol chemical informa-tion is normally not available by remote sensing except in very special circumstances (Rinsland et al., 1994). Remote sensing thus needs to be complemented by in situ
15
observations of particle size distributions and composition in order to study sources and processes forming the aerosol. Research aircraft and balloons have been used for in situ studies of particle formation (de Reus et al., 1998), particle size distributions (Deshler et al., 2003) and particle chemical composition (Huebert et al., 2004). Based on the use of in-service passenger aircraft, long-term aerosol observations have been
20
undertaken from the CARIBIC platform for the years 1997–2002 and 2005 to present (Brenninkmeijer et al., 1999, 2007) concerning particle chemical composition (Martins-son et al., 2001) and particle number concentrations (Hermann et al., 2003).
Aerosol particles in the 9–12 km altitude region contain a significant fraction of sul-furous aerosol (Dibb et al., 2000; Xu et al., 2001; Martinsson et al., 2001, 2005; Kojima
25
AMTD
7, 3253–3299, 2014CARIBIC: comparison between aerosol samples and
OPC
B. G. Martinsson et al.
Title Page
Abstract Introduction
Conclusions References
Tables Figures
◭ ◮
◭ ◮
Back Close
Full Screen / Esc
Printer-friendly Version Interactive Discussion
Discussion
P
a
per
|
D
iscussion
P
a
per
|
Discussion
P
a
per
|
Discuss
ion
P
a
per
|
are observed (Papaspiropoulos et al., 2002), which on rare events can have a strong influence on aerosol particle concentration (Eguchi et al., 2009; Dirksen et al., 2009; Fromm et al., 2010). Particles from explosive volcanism have strong effects on the stud-ied region at times, affecting the climate (Ammann et al., 2003; Solomon et al., 2011), stratospheric ozone (McCormick et al., 1995) and aviation (Gislason et al., 2011). The
5
aerosol particles in volcanic clouds contain besides the ash component (Schumann et al., 2011; Andersson et al., 2013) large sulphurous and carbonaceous components (Martinsson et al., 2009; Schmale et al., 2010; Carn et al., 2011).
The size distribution of the aerosol in the lowermost stratosphere is also strongly influenced by volcanism (Bauman et al., 2003). Hervig and Deshler (2002) compared
10
balloon-borne optical particle counter (OPC) measurements with satellite-based mea-surements of extinction for several wavelengths from SAGE II and HALOE and found good agreement during periods of strong volcanic influence, whereas the OPC regis-tered considerably higher particle surface area than the satellites during periods with little volcanic influence.
15
The study presented here deals with two very different CARIBIC aerosol measure-ments. Particle volume is obtained by integrating the size distributions obtained from an OPC. Subsequently these results are compared with the aerosol mass from samples that were analysed with PIXE (particle-induced X-ray emission) and PESA (particle elastic scattering analysis) for concentrations of all major and several minor
chemi-20
cal elements. Together these different measurements can deepen our understanding of the atmospheric aerosol by this combination of chemical and physical information. However, to reach that goal an assessment of the degree of agreement between the two measurements is needed. Therefore this paper is devoted to the comparison of the total particle volume concentration obtained from the CARIBIC OPC and the total
25
AMTD
7, 3253–3299, 2014CARIBIC: comparison between aerosol samples and
OPC
B. G. Martinsson et al.
Title Page
Abstract Introduction
Conclusions References
Tables Figures
◭ ◮
◭ ◮
Back Close
Full Screen / Esc
Printer-friendly Version Interactive Discussion
Discussion
P
a
per
|
D
iscussion
P
a
per
|
Discussion
P
a
per
|
Discuss
ion
P
a
per
|
2 Methods
The measurements presented here were undertaken from the CARIBIC observatory (Brenninkmeijer et al., 2007; www.caribic-atmospheric.com/) where a large number of trace gases are measured and aerosol particles are characterized with respect to size distribution and composition during monthly sets of usually four intercontinental
5
flights at 9–12 km altitude. The CARIBIC system comprises an instrumented container that is connected to a multiple probe inlet system for trace gases and aerosol that is permanently mounted on the belly of a Lufthansa Airbus A340-600. Concentrations of CO, O3, NO/NOy, VOCs, gaseous and condensed water are determined, and air
samples collected are analysed for greenhouse gases, hydro and halo carbons
(Bren-10
ninkmeijer et al., 2007; Schuck et al., 2009; Baker et al., 2010; Oram et al.; 2012). Aerosol particle number concentration measurements down to a diameter of 4 nm are undertaken with three condensation particle counters (CPC, TSI model 7610; Her-mann et al., 2003), and for the particle size distribution in the diameter range∼130– ∼1000 nm a 16-channel OPC (RION, KS-93) is used (Rauthe-Schöch et al., 2012).
15
Furthermore, aerosol samples are collected for subsequent analysis with respect to all major and several minor constituents (Martinsson et al., 2001; Nguyen et al., 2006; Nguyen and Martinsson, 2007). Details of the inlet system are described by Bren-ninkmeijer et al. (2007). The efficiency of the aerosol inlet is estimated to be 60 % for 5 µm diameter particles (Rauthe-Schöch et al., 2012). Based on modelling and
previ-20
ous experience the efficiency of the inlet is estimated to exceed 90 % for particles in the size range 0.01–1 µm diameter.
This comparison of the CARIBIC OPC and the analytical results obtained from the aerosol sampler span one year from April 2011 to March 2012. The measurements were undertaken during flights from Frankfurt in Germany to northern South
Amer-25
AMTD
7, 3253–3299, 2014CARIBIC: comparison between aerosol samples and
OPC
B. G. Martinsson et al.
Title Page
Abstract Introduction
Conclusions References
Tables Figures
◭ ◮
◭ ◮
Back Close
Full Screen / Esc
Printer-friendly Version Interactive Discussion
Discussion
P
a
per
|
D
iscussion
P
a
per
|
Discussion
P
a
per
|
Discuss
ion
P
a
per
|
collected in clouds the average air temperature was below 230 K, implying that the clouds were dominated of ice particles (Koop et al., 2000; Rosenfeld and Woodley, 2000). The meteorological modelling along the CARIBIC flight paths indicates that each sample affected by clouds encountered hydrometeors that in most cases consisted to 100 % of ice, the lowest fraction of ice being 99 % (http://www.knmi.nl/samenw/
5
campaign_support/CARIBIC/). This is consistent with measured temperatures.
The aerosol sampling requires the longest sampling time of the two methods, thereby determining the amount of data available. For the investigated period of one year, 153 aerosol samples are available. This number available for comparison is lower by con-straints that, of course, OPC data should be available and that uncertainties in
to-10
tal mass due to detection limit should be within±5 % (described below). In addition, clouds were found to seriously affect the comparison. Therefore also measurements of gaseous and total water concentrations should be available for identification of sam-ples collected in cloudy conditions. These requirements together reduce the number of samples available for the comparison to 106. The OPC – aerosol sampler
intercompar-15
ison primarily deals with the integrated particle volume concentration obtained from the OPC (CV) and the total aerosol mass concentration obtained as the sum of all major and several minor constituents of the aerosol samples (Cm).
2.1 Aerosol sampling and analysis
CARIBIC aerosol samples are collected by impaction on a 0.2 µm polyimide film. The
20
sampling unit contains14 channels that were sequentially activated. The typical sam-pling time for each sequential sample is 100 min. The collection efficiency of the sam-pler is 97 %±4 % for particles with aerodynamic diameter larger than 0.2 µm, and the 50 % cut-offdiameter is 0.08 µm (Nguyen et al., 2006).
A cyclone separator placed up-stream of the sampler limits the upper particle size
25
AMTD
7, 3253–3299, 2014CARIBIC: comparison between aerosol samples and
OPC
B. G. Martinsson et al.
Title Page
Abstract Introduction
Conclusions References
Tables Figures
◭ ◮
◭ ◮
Back Close
Full Screen / Esc
Printer-friendly Version Interactive Discussion
Discussion
P
a
per
|
D
iscussion
P
a
per
|
Discussion
P
a
per
|
Discuss
ion
P
a
per
|
cyclone is used exclusively for the aerosol sampler, implying that the OPC, to be de-scribed below, does not have the same definition of the upper size limit.
The collected samples were analysed for elemental composition by ion beam anal-ysis (IBA). For sulphur (S) and elements with larger atomic number particle-induced X-ray emission (PIXE) is used (Johansson and Campbell, 1988) Hydrogen (H), carbon
5
(C), nitrogen (N) and oxygen (O) are analysed by particle elastic scattering analysis (PESA). The analytical setup has been optimised with respect to sampling substrate and analytical parameters for PIXE (Papaspiropoulos et al., 1999) and PESA (Nguyen and Martinsson, 2007). During the time period of this study the detection efficiencies (i.e. the fraction of the samples where the element was detected) for H, C, N, O and S
10
were 100 %, 96 %, 82 %, 95 % and 100 %. Minor constituents were detected less fre-quently, like for instance potassium (K) 41 %, iron (Fe) 44 % and nickel (Ni) 30 %. The accuracy of the analyses is estimated to 10 % (Papaspiropoulos et al., 2002; Nguyen and Martinsson, 2007).
The total aerosol mass concentration (in ng m−3 STP; standard temperature and
15
pressure) was obtained as the sum of all elemental mass concentrations. An element that was not detected in a sample was represented by the half of its minimum detec-tion limit (MDL) which was added to the sum of the elements. When more than 5 % of that sum was from undetected elements (represented by half the MDL) the mea-surement was discarded, implying that the total mass concentration given has a±5 %
20
uncertainty due to elemental concentrations below the MDL. This requirement implied that only samples with detection of all the five major elements, H, C, N, O and S, were selected for this analysis. Uncertainties slightly larger than 5 % could appear for samples with a significant crustal component because some of the crustal elements, most notable silicon, are not analysed with adequate detection limits. This could lead
25
AMTD
7, 3253–3299, 2014CARIBIC: comparison between aerosol samples and
OPC
B. G. Martinsson et al.
Title Page
Abstract Introduction
Conclusions References
Tables Figures
◭ ◮
◭ ◮
Back Close
Full Screen / Esc
Printer-friendly Version Interactive Discussion
Discussion
P
a
per
|
D
iscussion
P
a
per
|
Discussion
P
a
per
|
Discuss
ion
P
a
per
|
Combining the uncertainties of the sampling efficiency (4 % and 3 %), elemental analysis (10 %) and effects from the minimum detection limit (5 %) the combined uncer-tainty of the mass concentration obtained from sampling and analysis becomes 12 %.
The aerosol sampler has demonstrated excellent properties in calibration procedures (Nguyen et al., 2006). Calibration results were obtained using liquid aerosol consisting
5
of dioctyl serbacate (DOS) with traces of uranine. The performance of impactors are, however, sensitive to particle material as well as the amount of mass deposited. Solid particles can bounce off the sampling substrate, and in that way be lost. Overloaded impactor substrates could suffer blow-off, where a sizable fraction of a solid or semi-solid deposit is blown away from the impaction zone. Impactors overloaded with liquid
10
particles may wet the surface of the sampling substrate, causing a drift of deposited material away from the impaction region. Mass deposited away from this region might be outside the area where the analytical beam impinges on the sample. That mass will not interact with the beam thus causing too low measured concentrations.
In order to study the influence from the distorting effects on the aerosol samples
15
of this study, all the 106 samples were photographed using a Canon EOS 550D with a EFS 15–85 mm lens. A photodiode placed behind the sample was used for illumi-nation. The images were systematically evaluated based on the appearance of the deposit. Evidence of bounce-offcould be found for one group of samples. Liquid sam-ples wetting the surface outside the impaction region could also be observed, whereas
20
no signs of large features at the outer part of the sample indicative of blow-off were obtained from any of the samples. Each of the four orifices of the impactor nozzle should produce a deposit, thus causing a square pattern of four deposits with a dis-tance of 0.9 mm to the centre of the sampling substrate. The samples were classified in four basic groups. The first group, type 1, contains samples with no deviation from
25
AMTD
7, 3253–3299, 2014CARIBIC: comparison between aerosol samples and
OPC
B. G. Martinsson et al.
Title Page
Abstract Introduction
Conclusions References
Tables Figures
◭ ◮
◭ ◮
Back Close
Full Screen / Esc
Printer-friendly Version Interactive Discussion
Discussion
P
a
per
|
D
iscussion
P
a
per
|
Discussion
P
a
per
|
Discuss
ion
P
a
per
|
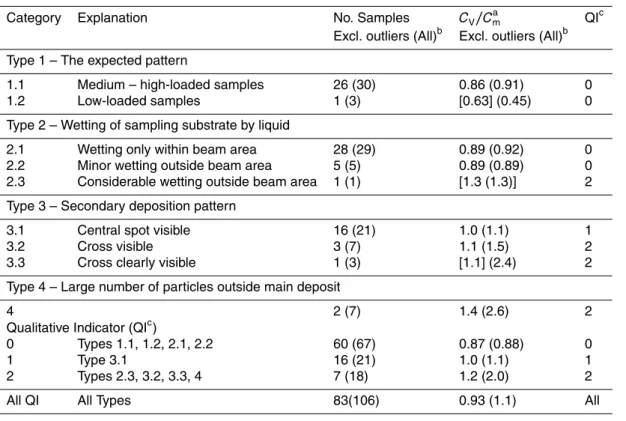
Fig. 1b). The type 2 samples are subdivided according (2.1) wetting only inside the analytical beam area, (2.2) minor wetting outside the beam area and (2.3) consider-able wetting outside the beam area. When the impactor jet meets the sampling surface the air flows out over the surface in all directions. Because of the fact that the present impactor contains four jets this outflow causes an interaction between the jets, causing
5
secondary deposition of bounce-off-particles in between the ordinary deposition area. This is manifested by a deposition spot in the centre (Fig. 1c). In some cases a cross can be discerned, marking the outflow path of air from the central area. These type 3 samples were subdivided into three categories: (3.1) central spot discerned, (3.2) cross discerned and (3.3) cross clearly visible, in expected order of increasing severity of the
10
bounce-offproblem observed. Several images reveal tiny spots outside the central de-position area. This could be caused by imperfection of the polyimide film or it could be single particles that have bounced. A few samples have a large number of tiny spots outside the regular deposition area. When the number of spots over the 16 mm diame-ter polyimide film exceeded 15, the samples were classified as type 4. Otherwise they
15
were classified according to the appearance of central deposit. An example of these type 4 samples is shown in Fig. 1d.
The different deposition types were summarized by a qualitative indicator (QI) ex-pressing qualitatively the problem with losses for each sample based on the deposition pattern. QI=0 are the samples where no significant losses are expected. The
de-20
posit types with QI=0 are 1.1, 1.2, 2.1 and 2.2. Samples indicating discernible losses (QI=1) comprises only type 3.1 samples. Sample deposits indicating more serious losses (QI=2) includes deposit types 2.3, 3.2, 3.3 and 4. Classification in these main and sub categories will be used in the evaluation of the comparison between the sam-pler and OPC.
25
AMTD
7, 3253–3299, 2014CARIBIC: comparison between aerosol samples and
OPC
B. G. Martinsson et al.
Title Page
Abstract Introduction
Conclusions References
Tables Figures
◭ ◮
◭ ◮
Back Close
Full Screen / Esc
Printer-friendly Version Interactive Discussion
Discussion
P
a
per
|
D
iscussion
P
a
per
|
Discussion
P
a
per
|
Discuss
ion
P
a
per
|
beam (1 mm diameter). This small-beam analysis is based on three irradiations, one over the aerosol deposit and two blank irradiations outside the main deposit area of the impactor at 4 mm distance from the deposit centre at opposite sides (Nguyen and Martinsson, 2007). These two internal blank measurements can be utilized to obtain an estimate of aerosol deposit outside the 5.5 mm diameter beam of the quantitative
5
PIXE analysis. They should represent an area from the outer bound of the large beam to an outer bound where half of this doughnut area is inside 4 mm radius. A circle with 4 mm radius has approximately twice the area of the beam in the slightly tilted sample plane (23◦). Adding the same surface area outside 4 mm radius, the blank spots can be seen as to represent an area twice the size of the large beam, between diameters
10
5.5 and 9.5 mm. The estimated mass deposited is the areal density of an element (in ng cm−2) multiplied with the surface area. To estimate non-ideal deposition outside the primary impactor deposition area the ratio between the mass deposited between 5.5 and 9.5 mm diameter (mudet) and the mass detected in the quantitative analysis within
5.5 mm diameter (mdet) is formed. This ratio can only be formed for elements detected
15
with PIXE because of the strong signal of H, C, N and O from the polyimide sampling substrate. The major aerosol constituent sulphur is detected with PIXE, and will there-fore serve as the element used for estimation of deposition outside the main deposition area of the impactor. From Fig. 1c it is clear that secondary deposition is inhomoge-neous in the vicinity of the impactor jets. It is not clear to what degree the secondary
20
deposition pattern reaches outside the irradiated area of the sample. Therefore the mudet/mdetratios should be treated with some caution, especially for sample types 3.2
and 3.3. Samples with QI=0, i.e. samples showing no visible imperfections in the de-position pattern, havemudet/mdetratios narrowly distributed around 0.03 indicating that
3 % of the aerosol deposit was outside the 5.5 mm ion beam used in the quantitative
25
PIXE analysis. All samples were therefore corrected by that percentage to account for regular deposition outside the analysed area.
AMTD
7, 3253–3299, 2014CARIBIC: comparison between aerosol samples and
OPC
B. G. Martinsson et al.
Title Page
Abstract Introduction
Conclusions References
Tables Figures
◭ ◮
◭ ◮
Back Close
Full Screen / Esc
Printer-friendly Version Interactive Discussion
Discussion
P
a
per
|
D
iscussion
P
a
per
|
Discussion
P
a
per
|
Discuss
ion
P
a
per
|
at room temperature (Martinsson, 1987; Deiters and Randzio, 2007). The main aerosol components observed in the analysed UT/LMS samples over the years are sulphurous and carbonaceous components, but sometimes also a significant crustal component can be observed. The sulphate compounds common in the atmosphere are not lost during analysis when particles, like in this study, are deposited onto a thin substrate,
5
unless an external heating source is used (Martinsson and Hansson, 1988; Mentes et al., 2000). The occasional crustal component is also expected to remain in the sample during analysis. The atmospheric carbonaceous aerosol component contains a broad range of vapour pressures. Therefore a definition of what is analysed is of need (Martinsson, 1987). In this case the IBA analytical definition most likely deviates
10
from that during the OPC measurements, implying that the amount of carbonaceous aerosol determined by IBA could be smaller than the amount present during the OPC measurements.
2.2 Optical particle counter
For CARIBIC, a KS-93 OPC (RION CO., Ltd., Japan) was modified and applied for the
15
first time onboard aircraft. The KS-93 has a diode laser with 830 nm wavelength, a lower detection limit of about 120 nm particle diameter, a robust synthetic quartz optical cell and is relatively small in size (135 mm×280 mm×150 mm), which makes it all well suited for airborne atmospheric research. The modified OPC is mounted together with the flow control system and the data acquisition in a 19′′rack unit. For data analysis
20
the signals of the three OPC internal amplifiers are recorded with a real-time data acquisition system (PXI, National Instruments, USA) with 3 µs resolution. As the signal of one particle has an average duration of about 60 to 90 µs, each pulse is resolved with 20 to 30 data points. This data acquisition allows a free choice of the sampling time and number of channels. For the present analysis particle pulse heights were sorted into 16
25
channels and averaged over 300 s. For CARIBIC, the KS-93 signal output is improved by applying particle free sheath air (0.135 L min−1) around the aerosol sampling air
AMTD
7, 3253–3299, 2014CARIBIC: comparison between aerosol samples and
OPC
B. G. Martinsson et al.
Title Page
Abstract Introduction
Conclusions References
Tables Figures
◭ ◮
◭ ◮
Back Close
Full Screen / Esc
Printer-friendly Version Interactive Discussion
Discussion
P
a
per
|
D
iscussion
P
a
per
|
Discussion
P
a
per
|
Discuss
ion
P
a
per
|
larger than about 130 nm (optical diameter). The largest particle diameter which can be size-resolved is between 1.0 and 1.3 µm and depends on the particle refractive index and the respective calibration curve. However, as can be seen in Fig. 8, most of the volume distributions in the UT/LMS have their maximum in the particle size range between 300 and 600 nm. Hence the analysis in this study does not strongly
5
depend on the OPC upper particle diameter limit. For the present analysis a theoretical response function based on spherical particles and the Mie theory was used (van de Hulst, 1981; Bohren and Huffman, 1983). This curve was related to the signal output by calibrating the OPC with latex and ammonium sulfate particles in the laboratory. Note that the OPC also counts particles larger than the upper size limit, but cannot
10
determine their exact size. These particles are assigned to the largest particle size channel, which is therefore biased and not used in the analysis here. Uncertainties of the OPC data evaluation originate mainly from the “unknown”, hence to be estimated particle refractive index, and the accuracy of the sampling air flow. They amount to ∼10 % in particle size and∼19 % for the particle number concentration. Due to the
15
cubed dependence of the particle volume on diameter the combined uncertainty of CV becomes 50 %. For CARIBIC, the refractive index was calculated using literature
values of the UT particle chemical composition (44 % H2SO4, 44 %, (NH4)2SO4, 10 %
organic carbon and 2 % soot) and a mixing rule to 1.479–0.0143i. This refractive index was applied for the whole OPC size range. Additional information of the OPC unit is
20
given in Rauthe-Schöch et al. (2012).
2.3 Additional methods
Besides the data from the OPC and the aerosol sampler, measurements of water are used to identify measurements that were influenced by clouds. The CARIBIC inlet sys-tem houses a forward-facing inlet tube for total water (H2Otot; being the sum of cloud
25
AMTD
7, 3253–3299, 2014CARIBIC: comparison between aerosol samples and
OPC
B. G. Martinsson et al.
Title Page
Abstract Introduction
Conclusions References
Tables Figures
◭ ◮
◭ ◮
Back Close
Full Screen / Esc
Printer-friendly Version Interactive Discussion
Discussion
P
a
per
|
D
iscussion
P
a
per
|
Discussion
P
a
per
|
Discuss
ion
P
a
per
|
10–180 s) and a two-channel photoaccustic laser spectrometer (PAS) detecting H2Otot and H2Ogas (time resolution: ∼5 s). The PAS data are calibrated post-flight using
the FPH data showing a total uncertainty of approximately 0.5 K (verified by regular laboratory-based cross-checks to high precision FHP instrument MWB LX-373). The calibrated PAS data have a precision of 2 % or 0.5 ppmv (whichever is higher).
5
We use the dynamical tropopause to differentiate between tropospheric and strato-spheric air. The potential vorticity (PV) along the flight track was obtained from archived European Centre for Medium-range Weather Forecast (ECMWF) analyses with a reso-lution of 1◦×1◦in the horizontal and at 91 vertical hybrid sigma-pressure model levels. The PV was interpolated linearly in longitude, latitude, log pressure and time to the
10
position of the aircraft. Based on PV, air masses were classified as tropospheric for average PV<1.5 PVU (potential vorticity units; 1 PVU=10−6K m2K g−1s−1), and as belonging to the tropopause region for 1.5 <PV<3 PVU. The samples taken in the LMS are subdivided in three groups of varying depth into the LMS, 3–5 PVU, 5–7 PVU and measurements taken in air masses with PV>7 PVU.
15
3 Results and discussion
The primary measure used in the comparison between the OPC and the aerosol sam-ples is the ratio of the OPC particle volume concentration (CV) to the total mass
con-centration (Cm) obtained as the sum of the elemental concentrations from PIXE and PESA analysis of the aerosol samples. Figure 2 shows the one year data used to
20
evaluate the relative performance of the two methods that are based on completely different physical principles. A large fraction of the measurements (85 %) have CV/Cm
ratios from 0.55 to 1.55 cm3g−1. Out of the 106 samples 14 were found to haveC
V/Cm
ratios larger than the upper limit of this range and three were below the lower limit. The causes contributing to these 17 outlyers will be investigated next.
AMTD
7, 3253–3299, 2014CARIBIC: comparison between aerosol samples and
OPC
B. G. Martinsson et al.
Title Page
Abstract Introduction
Conclusions References
Tables Figures
◭ ◮
◭ ◮
Back Close
Full Screen / Esc
Printer-friendly Version Interactive Discussion
Discussion
P
a
per
|
D
iscussion
P
a
per
|
Discussion
P
a
per
|
Discuss
ion
P
a
per
|
3.1 Examination of outlying data points
To shed light on the causes of outlyingCV/Cm ratios, the measurement situation,
el-emental composition features, size distribution and aerosol sample deposit patterns will be scrutinized. First the special case of sampling in clouds will be studied. Based on the CARIBIC measurements of gaseous and total water mixing ratios, intercepted
5
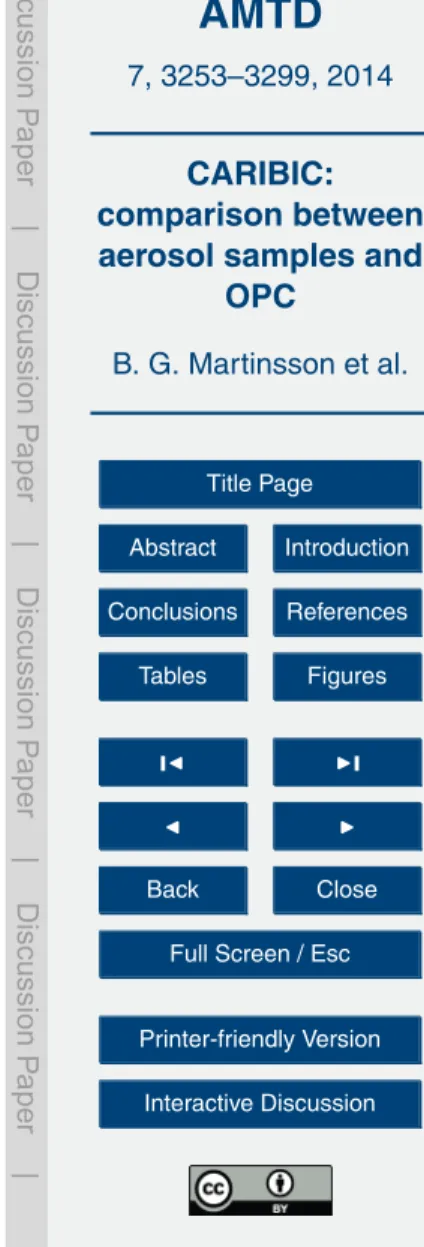
clouds are detected (Brenninkmeijer et al., 2007). Figure 3a shows theCV/Cmratio
re-lated to the cloud ice concentration. Approximately half of the samples were obtained without any contact with clouds. The degree of cloud contact of the other samples varies strongly (note the logarithmic scale). When the cloud ice concentration is high, several measurements show highCV/Cm ratio. The aerosol inlet is designed to collect
10
particles of a few micrometre in diameter or smaller. When the inlet approaches par-ticles at a cruise speed of 230 m s−1, large particles that hit the leading edge of the shroud or, less likely the inlet cone itself, can disintegrate adding artifactual particles to the sampling airstream (Korolev et al., 2011). Because the leading edges and rim of the CARIBIC inlet have a surface-coating of nickel, we evaluated the connection
be-15
tween nickel elemental concentration and cloud ice concentrations. Figure 3b demon-strates a strong correlation for cloud ice concentration above 5 ppmv with aerosol sam-ple nickel mass fractions larger than 0.05 %, indeed showing that, besides break-up of ice particles, the inlet contributes nickel when measuring inside clouds. This group of twelve samples will be further investigated, starting with photographic images of the
20
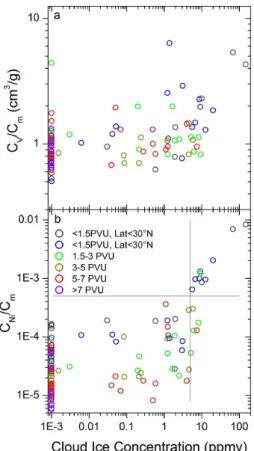
aerosol samples to inspect the deposition patterns of the samples.
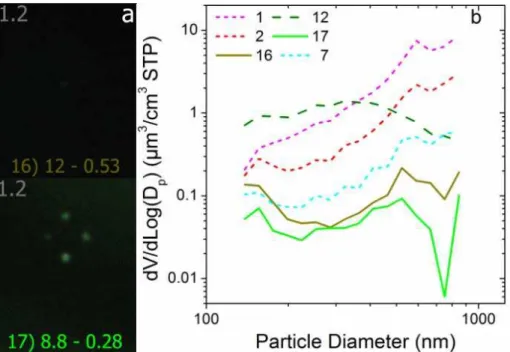
Out of this group of ten instances four occurred in the tropics, five in the extra-tropical UT and one in the tropopause region. Figure 4a contains indeed a very incoherent message on the connection between deposition pattern and cloud influence orCV/Cm
ratio. Four of the samples show clear signs of losses based non-ideal deposition
pat-25
AMTD
7, 3253–3299, 2014CARIBIC: comparison between aerosol samples and
OPC
B. G. Martinsson et al.
Title Page
Abstract Introduction
Conclusions References
Tables Figures
◭ ◮
◭ ◮
Back Close
Full Screen / Esc
Printer-friendly Version Interactive Discussion
Discussion
P
a
per
|
D
iscussion
P
a
per
|
Discussion
P
a
per
|
Discuss
ion
P
a
per
|
the two highestCV/Cm ratios. The type 4 samples are, as will be shown later, rather
unusual, suggesting that the artefact particles generated at the inlet have a high proba-bility for bounce-offand become spread over the surface. The volume size distributions of Fig. 4b are typical of artifactual particles due to particle break-up in clouds and do not appear in the absence of clouds. High values of theCV/Cmratio (Fig. 4c) are
con-5
nected with high concentrations of large particles. It is also clear that there is a strong correlation between nickel in the aerosol samples and cloud ice concentration (Fig. 3b) likely originating in collisions between ice particles and materials of the walls of the inlet (Murphy et al., 2004). However, the amount of nickel collected in the sampler is much less than the signal registered in the OPC channels for large particles.
Bounce-10
offcould cause reduced collection efficiency of these newly formed, solid particles in the aerosol sampler. Another difficulty arises from the fact that the OPC measurements are based on the assumption of a sulphate-dominated aerosol, thus causing large siz-ing uncertainties for nickel particles due to the use of inadequate refractive index in the data evaluation. Additionally, nickel has a large density (8.9 g cm−3) implying that the
15
cyclone in front of the sampler catches particles approximately a factor of 3 smaller in terms of geometrical diameter compared to 2 µm aerodynamic diameter cut-off. Hence it is likely that a large fraction of the particles registered by the OPC is outside the range of the sampler, thus further adding to the uncertainties. It is clear that the large diameter channels of the CARIBIC OPC are severely affected by clouds, as are the
20
CARIBIC nickel concentration measurements from the aerosol samples.
Measurements where the crustal component is significant were identified from the iron concentration and its relative concentration to potassium, calcium and titanium. Six samples have a relative iron concentration (CFe/Cm) larger than 0.3 %, corresponding
to a crustal fraction (Ccrust/Cm) of approximately 6 % according to average crust
com-25
position (Weaver and Tarney, 1984). The deposition patterns of crust-containing ples (Fig. 5a and, for sample No. 1, Fig. 4a) all show signs of losses. Five of the sam-ples have QI=2 and the remaining sample QI=1. TheCV/Cm ratio is connected with
AMTD
7, 3253–3299, 2014CARIBIC: comparison between aerosol samples and
OPC
B. G. Martinsson et al.
Title Page
Abstract Introduction
Conclusions References
Tables Figures
◭ ◮
◭ ◮
Back Close
Full Screen / Esc
Printer-friendly Version Interactive Discussion
Discussion
P
a
per
|
D
iscussion
P
a
per
|
Discussion
P
a
per
|
Discuss
ion
P
a
per
|
distributions of measurements with a strong crustal component are shown in Fig. 5b. The size distribution of the cloud-affected measurement (No. 1) differs markedly from the other crust-influenced measurements with high concentrations of the largest parti-cles artificially produced in the inlet. Yet, all but sample No. 12 show high concentration in the OPC channel for the largest particles. Crustal particles usually are larger than
5
sulphurous/carbonaceous particles indicating that the crustal particles mainly appear in the OPC channels for the largest particle sizes. Crustal particles differ significantly from the sulphate OPC calibration substance in refractive index as well as in particle shape, implying that the uncertainty of the OPC sizing of the crustal particles is large. The density of crustal particles is comparatively high, usually around 2.7 g cm−3. This
10
increases the probability that particles in the upper cannels of the OPC are outside the upper aerodynamic limit of the aerosol sampler. The balance of these circumstances indicates that a mismatch in particle size range of the OPC and the aerosol sampler contributes to the highCV/Cm ratios as well as non-ideal collection of crustal particles
demonstrated by the deposition patterns.
15
The ratio of carbon (C) to sulphur (S) mass concentration varies more than a fac-tor of 100 between the samples in this study. Such variability in composition will of course affect the refractive index of the particles. Here samples with mass concentra-tion ratio C/S>5 will be examined. The mass of sulphate aerosol composed H2SO4–
(NH4)2SO4 can be estimated to be 4 times the mass of S, implying that the
carbona-20
ceous component in these samples most likely is larger than the sulphurous fraction. Six of the 106 samples in this study had C/S mass concentration ratios larger than 5. Three of these samples were affected by clouds and one contained crust, which strongly affect the results of the comparison between the OPC and the sampler. The remaining two samples (Fig. 6a) show rather faint deposition patterns, the deposit of
25
AMTD
7, 3253–3299, 2014CARIBIC: comparison between aerosol samples and
OPC
B. G. Martinsson et al.
Title Page
Abstract Introduction
Conclusions References
Tables Figures
◭ ◮
◭ ◮
Back Close
Full Screen / Esc
Printer-friendly Version Interactive Discussion
Discussion
P
a
per
|
D
iscussion
P
a
per
|
Discussion
P
a
per
|
Discuss
ion
P
a
per
|
the OPC while collected by the sampler having a much lower cut-off. This could be the cause of lowCV/Cmratios. Also deviations of the actual optical properties from the
re-fractive index assumed in the size attribution could be significant for these carbon-rich particles, e.g. underestimation of the soot fraction would lead to underestimation ofCV.
After the examination of the influence from clouds, crust and C/S composition 11
5
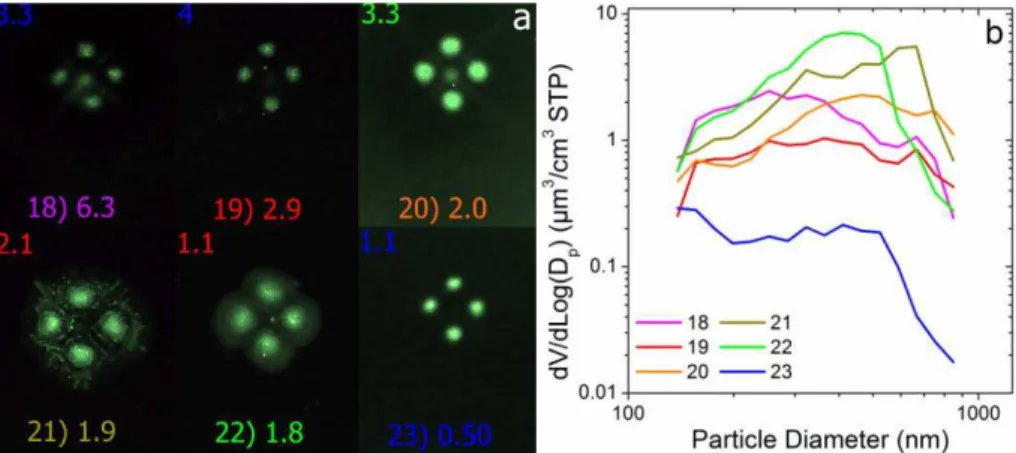
of the 17 outliers with respect toCV/Cm ratio have been identified. The remaining six
outliers are shown in Fig. 7. It is clear that the sampling failed to produce quantitative collection for samples 18–20 (Fig. 7a). The remaining measurements (No. 21, 22 and 23) show good sampling characteristics. The size distribution of sample 23, (Fig. 7b) indicates that a significant fraction of the particle volume can be found on particles
10
smaller than the lowest size channel of the OPC, thus causing a lowCV/Cmratio. The
other two measurements (21 and 22) were taken in the LMS and display unusually large particles. This point will be discussed further in the next section.
3.2 Problems connected with the size distributions
To further evaluate the relation between the measurements with the OPC and the
15
aerosol sampler, the size distributions will be examined. Difference in size range between the OPC (measuring 130–900 nm optical diameter) and the sampler (80– 2000 nm aerodynamical diameter) could cause mismatch between the measurements, as discussed above. Assuming that the OPC measurements approximately resem-ble the geometrical diameter the measurements would have the same upper size
20
limit for particles of density of 5 g cm−3
. A lower density, usually true for atmospheric aerosol particles, would move the upper OPC limit downwards in aerodynamical size. In Fig. 8 particle volume size distributions are shown for all measurements not shown in Sect. 3.1 arranged according to the measurement region, i.e. UT, MT and LMS. It is clear that almost all measurements indicate that the particle volume outside the upper
25
AMTD
7, 3253–3299, 2014CARIBIC: comparison between aerosol samples and
OPC
B. G. Martinsson et al.
Title Page
Abstract Introduction
Conclusions References
Tables Figures
◭ ◮
◭ ◮
Back Close
Full Screen / Esc
Printer-friendly Version Interactive Discussion
Discussion
P
a
per
|
D
iscussion
P
a
per
|
Discussion
P
a
per
|
Discuss
ion
P
a
per
|
The lower limits in particle size of the OPC and the impactor coincide at a particle density of approximately 0.4 g cm−3. This low value implies that size distributions with large volume in the channel for the smallest particles might be underrepresented in terms of total particle volume from the OPC. Some size distributions show high con-centrations in the two smallest particle channels without having a dominant mode of
5
larger particles. These distributions could be expected to be most affected in theCV/Cm
ratio by particle volume outside the lower OPC measurement limit. In the tropics three measurements were taken in the fresh volcanic cloud from the eruption of Nyamur-gira (DR Congo) in November 2011 with particle volume (and mass) concentrations similar to those deep into the LMS, see measurements 26, 27 and 28 in Fig. 8a (red
10
vertical scale). These measurements together with 29 and 32 have CV/Cm ratios of
0.69, 0.79, 0.80, 0.90 and 1.3 cm3g−1. The low CV/Cm ratios together with the size
distributions of the measurements in the fresh volcanic cloud thus indicate some par-ticle volume outside the OPC measurement range. All the measurements from the extratropical UT (Fig. 8b) have size distributions that indicate particle volume outside
15
the lower size limit. However, the size distributions alone cannot explain variability in theCV/Cm ratio of 0.77–1.4 cm
3
g−1, for example distributions 34 and 38 (the
small-est and largsmall-estCV/Cm ratio in this group) are similar both in terms of the distribution
of small particles and relative particle volume for large particles. Measurements from the tropopause region (Fig. 8c) in some cases, in particular measurements 40, 43, 45
20
and 51, show significant concentration in the two lowest OPC channels without a dom-inant mode of larger particles. The respective CV/Cm ratios are 0.83, 0.89, 1.0 and
1.2 cm3g−1. All the measurement numbers are arranged in order of increasingCV/Cm
ratio in each of Fig. 8a–f. Presence of particles outside the lower size limit thus cannot explain the variability in theCV/Cm ratio for measurements in the tropopause region.
25
AMTD
7, 3253–3299, 2014CARIBIC: comparison between aerosol samples and
OPC
B. G. Martinsson et al.
Title Page
Abstract Introduction
Conclusions References
Tables Figures
◭ ◮
◭ ◮
Back Close
Full Screen / Esc
Printer-friendly Version Interactive Discussion
Discussion
P
a
per
|
D
iscussion
P
a
per
|
Discussion
P
a
per
|
Discuss
ion
P
a
per
|
although it is not a major factor behind the variability of theCV/Cmratio. Measurements
taken in the LMS do not indicate this problem.
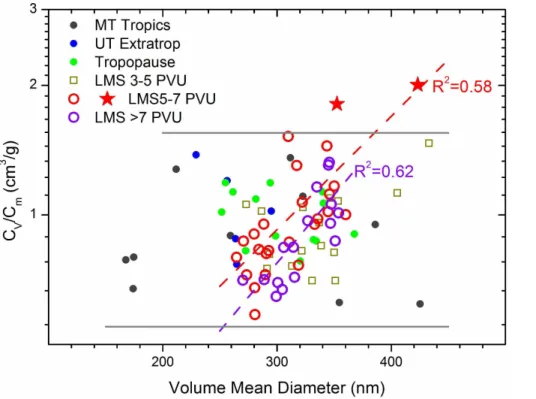
In addition to investigating the conditions at the lower and upper size limit of the OPC, patterns associated with the volume mean diameter (VMD) will be examined. Figure 9 shows theCV/Cmratio related to the VMD. There is no clear correlation between these
5
parameters for the tropospheric and tropopause region measurements. For measure-ments taken in the LMS weak correlation is found in the PV range 3–5 PVU, whereas the 5–7 PVU and PV>7 PVU ranges show a clear correlation, i.e. when VMD increases from 270 to 360 nm (where most of these measurements are found) theCV/Cm ratio
in the LMS increases from 0.7 to 1.2 cm3g−1. Two of the measurements (red stars) in 10
Fig. 9 are the two outliers (measurements 21 and 22 in Fig. 7) where no reason for the deviation could be found. Figure 9 indicates that the VMD is important for the observed deviation. As already pointed out LMS size distributions show no sign of problems with the lower or upper size limits of the OPC measurements. However, the OPC re-sponse to particle size needs to be considered. Besides dependence on composition
15
(refractive index) and particle shape, the calibration curve for a given composition is complicated. The range 0.7–1.2 cm3g−1inCV/Cm ratio corresponds to approximately
± 25 % around the central value. If for the present, we disregard problems with the aerosol sampling and analysis this would indicate 26 % particle volume measurement uncertainty, corresponding to a range of a modest 8 % in terms of particle diameter for
20
particles deep into the LMS.
3.3 Problems in aerosol sampling and analysis
It is clear that problems in the aerosol sampling were responsible for some of the out-liers with respect to theCV/Cmratio. The aerosol sampler collection efficiency shows
excellent characteristics for liquid particles (Nguyen et al., 2006) and the errors from the
25
AMTD
7, 3253–3299, 2014CARIBIC: comparison between aerosol samples and
OPC
B. G. Martinsson et al.
Title Page
Abstract Introduction
Conclusions References
Tables Figures
◭ ◮
◭ ◮
Back Close
Full Screen / Esc
Printer-friendly Version Interactive Discussion
Discussion
P
a
per
|
D
iscussion
P
a
per
|
Discussion
P
a
per
|
Discuss
ion
P
a
per
|
(i.e. Figs. 4–7) will be investigated with respect to deposition pattern to find out to what degree the sampling suffered from losses.
Figure 10 shows the aerosol deposits of the samples taken in the tropical middle tro-posphere, the extratropical upper troposphere and the tropopause region. Ten tropical samples do not belong to the categories of outliers that were presented in Sect. 3.1.
5
The aerosol sampling in the tropics usually worked well with seven QI=0 (i.e. deposit types 1.1, 1.2, 2.1 and 2.2) samples and three samples with QI=1 (deposit type 3.1), whereas none of the samples showed indications of severe losses (QI=2; deposit types 2.3, 3.2, 3.3 and 4). Only five samples in Fig. 10 were taken in the extratropi-cal UT. Three showed no signs of losses, one indicated minor losses and one major
10
losses. Out of the 13 samples taken in the tropopause region, six showed no signs of losses, six minor losses and one sample indicated major losses. Overall, of the 28 samples from these three sampling regions 57 %, 36 % and 7 % had QIs 0, 1 and 2, respectively.
The stratospheric samples are displayed in Fig. 11. Deposits with filaments
wet-15
ting the surface of the polyimide film become more common in the stratosphere. Out of the 16 samples from the lowest stratospheric level, 3< PV<5 PVU (Fig. 11), 12 show no signs of losses (QI=0), three show minor losses and one indicates signifi-cant losses (QI=2). Deeper into the stratosphere, the PV range 5–7 PVU, 23 samples are available. 17 are of QI=0, three of QI=1 and three of QI=2. Further up in the
20
stratosphere, PV>7 PVU, 15 out of 16 have QI=0 and the only sample with QI=2 show wetting of the sampling substrate that is deemed to cause significant losses (type 2.3). Together the samples from the three stratospheric sampling levels have QI values of 0, 1 and 2 in 80 %, 11 % and 9 % of the cases. Thus the fraction of the samples with major sampling problems is similar in the troposphere/tropopause and stratosphere,
25
whereas a larger fraction of the stratospheric samples showed no signs of reduced collection efficiency.
AMTD
7, 3253–3299, 2014CARIBIC: comparison between aerosol samples and
OPC
B. G. Martinsson et al.
Title Page
Abstract Introduction
Conclusions References
Tables Figures
◭ ◮
◭ ◮
Back Close
Full Screen / Esc
Printer-friendly Version Interactive Discussion
Discussion
P
a
per
|
D
iscussion
P
a
per
|
Discussion
P
a
per
|
Discuss
ion
P
a
per
|
indicate losses in the sampling (QI=0), 21 indicates minor losses (QI=1) and 18 more severe losses (QI=2). 83 samples do not belong to the outlier categories clouds, crust, large carbonaceous fraction or the outlier samples presented in Fig. 7. Out of these 83 samples 72 % show no signs of losses (QI=0) and 8 % have deposition patterns indicating major losses (QI=2). It is clear thatCV/Cm shows a dependence
5
on QI which is stronger when all samples are considered in comparison with when the four outlier categories are excluded see Table 1. The averageCV/Cm of the latter samples belonging with QI=0 is 0.87 cm3g−1. The average of all the 83 samples is
0.93 cm3g−1, implying that the 23 samples with QI=1 and QI=2 increase the average CV/Cm by 6 %.
10
It is clear the deposition pattern based on qualitative classification of the samples in part can explain variability in the CV/Cm ratio. Thereto we will briefly compare these
results with measurements outside the regular 5.5 mm diameter proton beam used for quantitative analysis as explained in Sect. 2.1. Figure 12a shows the ratio of es-timated, undetected sulfur mass outside the beam area of 5.5 mm diameter and the
15
mass detected within the beam area,mudet/mdet, in relation to particulate S
concentra-tion. Small, filled symbols indicate that particulate S was not detected in the two blank spots. These samples are represented by half the detection limit. It can be seen that particulate S could not be detected in the blank spots for samples with QI=0 when the concentration was less than 100 ng m−3 STP. This is also true for most of the QI=1 20
samples (type 3.1), whereas most of the QI=2 samples show detection with high mudet/mdetratio in that concentration range. For samples with particulate S
concentra-tion higher than 100 ng m−3STP them
udet/mdetis low with a few exceptions. When
re-latingmudet/mdetto theCV/Cmratio for the samples where particulate S was detected
in the blank spots a high degree of consistency can be found (Fig. 12b).mudet/mdetis
25
in all but one case low when theCV/Cmratio is low, and the deposit types are to a high
AMTD
7, 3253–3299, 2014CARIBIC: comparison between aerosol samples and
OPC
B. G. Martinsson et al.
Title Page
Abstract Introduction
Conclusions References
Tables Figures
◭ ◮
◭ ◮
Back Close
Full Screen / Esc
Printer-friendly Version Interactive Discussion
Discussion
P
a
per
|
D
iscussion
P
a
per
|
Discussion
P
a
per
|
Discuss
ion
P
a
per
|
Themudet/mdetratio also provides an internal measure on the quality of a sample with
respect to non-ideal effects in sampling with impactors. 3.4 Relation between OPC and IBA measurements
The 83 measurements that did not belong to the outlier categories were all in the CV/Cm range of 0.55–1.55 cm
3
g−1. To avoid bias from the outlier categories they are
5
removed to form the data set used to further investigate the relation between the par-ticle volume from the OPC and the mass from the sampling and analysis. Figure 13 shows CV related to Cm. It is obvious that these measurements correlate well over
approximately a factor of 50 inCmandCV ranges. The relative spread in the data
(log-arithmic scale) is essentially independent of the concentration, implying causes other
10
than statistical for the variability within the 0.55–1.55 cm3g−1 CV/Cm range. By
com-puting the geometric average (for consistency not the arithmetic average) of the ratio between Cm and CV an estimate of the density of the aerosol particles is obtained.
This apparent particle density becomes 1.08 g cm−3. It is clear that non-ideal
sam-pling affected some of the measurements. Removing these measurements result in
15
the density 1.15 g cm−3. The main components of the UT/LMS aerosol are sulphurous and carbonaceous aerosol. Occasionally the aerosol also contains a significant crustal fraction. The density of pure sulphuric acid is 1.84 g cm−3, which could be somewhat lowered by mixing with water. Other possible forms of sulphate are ammonium bisul-phate and ammonium sulbisul-phate with densities of 1.78 and 1.77 g cm−3, respectively. 20
The C/S elemental concentration ratio varies between 0.3 and 30 in the samples of this study. The carbonaceous fraction is to a large degree organic (Friberg et al., 2014). Probably the organic component acts as to lower the density of the particles, but likely not down to 1.15 g cm−3. Previous measurements at remote location (Saarikoski et al., 2005; Kannosto et al., 2008) and an urban location (Hu et al., 2012) estimate the
den-25
AMTD
7, 3253–3299, 2014CARIBIC: comparison between aerosol samples and
OPC
B. G. Martinsson et al.
Title Page
Abstract Introduction
Conclusions References
Tables Figures
◭ ◮
◭ ◮
Back Close
Full Screen / Esc
Printer-friendly Version Interactive Discussion
Discussion
P
a
per
|
D
iscussion
P
a
per
|
Discussion
P
a
per
|
Discuss
ion
P
a
per
|
density of 1.15 g cm−3from this study is 30 % lower, thus calling for a discussion of the patterns behind this apparent density.
The measurements with the OPC and the elemental analyses of the samples are undertaken at approximately the same temperature. However, the analyses are under-taken in high vacuum, which can induce losses of organic material from the samples
5
(Sect. 2.1). The composition and therefore the volatility of the organic fraction of the aerosol are not known. Therefore the losses during analysis cannot be estimated di-rectly. The average carbon-to-sulphate mass ratio in samples of this study is 0.37, the ratio being higher in the troposphere (0.75) than in the stratosphere (0.26). To increase the apparent density to a value of 1.5 g cm−3by increasing the carbon concentration in
10
an attempt to reach more plausible value, the carbon concentrations need to be mul-tiplied by 7.2. This would increase the carbon-to-sulphate mass ratio average over all samples to 0.8, and for stratospheric samples carbon amount would be approximately twice the sulphur mass concentration, which is not in line with studies based on another analytical method (Murphy et al., 2006, 2007). In addition, studies of volcanic aerosol
15
based on CARIBIC aerosol samples (Martinsson et al., 2009) agree well with studies based on other methods (Schmale et al., 2010; Carn et al., 2011) in the relation be-tween the carbonaceous and sulphurous fractions of the aerosol. The increase of the carbonaceous fraction to reach 1.5 g cm−3 density would bring our volcanic measure-ments into disagreement with the mentioned other studies.
20
Losses of organic material would thus only explain part of the difference to previous observations at other locations. The uncertainties of the mass from the aerosol sam-ples disregarding evaporative losses, is estimated to 12 %. The combined uncertainty in the number concentration and particle size combine to 50 % uncertainty in the par-ticle volume determinations from the OPC. Taking the combined uncertainties of the
25
AMTD
7, 3253–3299, 2014CARIBIC: comparison between aerosol samples and
OPC
B. G. Martinsson et al.
Title Page
Abstract Introduction
Conclusions References
Tables Figures
◭ ◮
◭ ◮
Back Close
Full Screen / Esc
Printer-friendly Version Interactive Discussion
Discussion
P
a
per
|
D
iscussion
P
a
per
|
Discussion
P
a
per
|
Discuss
ion
P
a
per
|
4 Conclusions
Two aerosol measurement methods aboard the CARIBIC platform for studies of the upper troposphere (UT) and the lowermost stratosphere (LMS) were compared. The particle volume concentration (CV) obtained from the CARIBIC optical particle counter
(OPC) and total mass concentrations (Cm) obtained from aerosol samples analysed for
5
all major and several minor constituents by ion beam analysis were compared by form-ing the ratio of the two measurements (CV/Cm). 89 of the 106 measurements
inves-tigated have aCV/Cm ratio confined to a rather narrow interval of 0.55–1.55 cm 3
g−1. Problems in the aerosol sampling were identified by photographic images of the depo-sition pattern, where secondary deposits indicate non-ideal sampling characteristics.
10
Out of the 17 measurements outside the usual CV/Cm range of 0.55–1.55 cm 3
g−1, eight were connected with ice particles forming artificial particles in the inlet severely affecting total particle volume collected by the OPC and, in most cases, the aerosol deposition pattern of the samples. Three of the outliers were caused by non-ideal sam-pling of crustal particles and to some degree by problems with refractive index of the
15
OPC and mismatch of the size ranges of the two measurements. Two of the measure-ments that were dominated by carbonaceous aerosol were below the usual CV/Cm
range because part of the size distribution was below the lower size limit of the OPC, and, probably due to a mismatch of the refractive index of the actual particles and that used in the OPC calibration. Of the remaining six measurements three showed poor
20
sampling efficiency and the fourth mismatch in size range. The remaining two sam-ples could be associated with the complicated relation between particle size and OPC signal, which was manifested by a correlation between particle volume mean diameter and theCV/Cmratio.
84 % of the measurements haveCV/Cmratios within the range of 0.55–1.55 cm 3
g−1.
25
AMTD
7, 3253–3299, 2014CARIBIC: comparison between aerosol samples and
OPC
B. G. Martinsson et al.
Title Page
Abstract Introduction
Conclusions References
Tables Figures
◭ ◮
◭ ◮
Back Close
Full Screen / Esc
Printer-friendly Version Interactive Discussion
Discussion
P
a
per
|
D
iscussion
P
a
per
|
Discussion
P
a
per
|
Discuss
ion
P
a
per
|
estimated to 1.15 g cm−3 after removal of 6 % bias from non-ideal sampling effects of the impactor. This apparent particle density is lower than previous estimates by 30 %. The combined uncertainties of the two methods, however, accommodate this diff er-ence.
Visual inspection and classification of the samples aerosol deposits was found to be
5
an efficient mean to identify samples were non-ideal sampling appeared, which was corroborated by the CV/Cm ratio. The analytical methodology utilizing blank spots of
the sample provided further insights to the problem of non-ideal impactor sampling. This method can be applied routinely with a minimal effort, thus providing the mean to significantly reduce problems, however moderate in this study, from impactor sampling
10
imperfections.
In conclusion, two methods based on widely different principles were inter-compared over a range of a factor of 50 in atmospheric aerosol concentration. The composition expressed as the ratio between the two main aerosol components in the aerosol par-ticles, carbon and sulphur, varied over a range of a factor 100 thus further illustrating
15
the variable condition in the UT/LMS. Except for a few outliers that could be connected with ice clouds, crust, size range mismatch or non-ideal sampling, a strong correla-tion between the two methods indicate that in most cases the CARIBIC aerosol sam-pling/analysis and OPC produce consistent and reliable results. This implies that the CARIBIC measurements with the OPC and the aerosol sampler can be combined to
20
further understand the physical and chemical nature of the upper tropospheric and lowermost stratospheric aerosol.
Acknowledgements. We especially acknowledge C. Koeppel, D. S. Scharffe, S. Weber and
all other members of the CARIBIC project. Lufthansa and Lufthansa Technik are gratefully acknowledged for enabling this scientific experiment. Financial support from the Swedish
Re-25
AMTD
7, 3253–3299, 2014CARIBIC: comparison between aerosol samples and
OPC
B. G. Martinsson et al.
Title Page
Abstract Introduction
Conclusions References
Tables Figures
◭ ◮
◭ ◮
Back Close
Full Screen / Esc
Printer-friendly Version Interactive Discussion
Discussion
P
a
per
|
D
iscussion
P
a
per
|
Discussion
P
a
per
|
Discuss
ion
P
a
per
|
References
Ammann, C. M., Meehl, G. A., Washington, W. M., and Zender, C. S.: A monthly and latitudinally varying volcanic forcing dataset in simulations of 20th century climate, Geophys. Res. Lett., 30, 1657, doi:10.1029/2003GL016875, 2003.
Andersson, S. M., Martinsson, B. G., Friberg, J., Brenninkmeijer, C. A. M., Rauthe-Schöch, A.,
5
Hermann, M., van Velthoven, P. F. J., and Zahn, A.: Composition and evolution of volcanic aerosol from eruptions of Kasatochi, Sarychev and Eyjafjallajökull in 2008–2010 based on CARIBIC observations, Atmos. Chem. Phys., 13, 1781–1796, doi:10.5194/acp-13-1781-2013, 2013.
Andreae, M. O. and Rosenfeld, D.: Aerosol-cloud-precipitation interactions, Part 1. The nature
10
and sources of cloud-active aerosols, Earth-Sci. Rev., 89, 13–41, 2008.
Baker, A. K., Slemr, F., and Brenninkmeijer, C. A. M.: Analysis of non-methane hydrocarbons in air samples collected aboard the CARIBIC passenger aircraft, Atmos. Meas. Tech., 3, 311–321, doi:10.5194/amt-3-311-2010, 2010.
Bauman, J. J., Russell, P. B., Geller, M. A., and Patrick, H.: A stratospheric aerosol
climatol-15
ogy from SAGE II and CLAES measurements: 2. Results and comparisons, 1984–1999, J. Geophys. Res., 108, 4383, doi:10.1029/2002JD002993, 2003.
Bohren, C. F. and Huffman, D. R.: Absorption and Scattering of Light by Small Particles, 1st edn., John Wiley & Sons, New York, 530 pp., 1983.
Brenninkmeijer, C. A. M., Crutzen, P. J., Fischer, H., Gusten, H., Hans, W., Heinrich, G.,
20
Heintzenberg, J., Hermann, M., Immelmann, T., Kersting, D., Maiss, M., Nolle, M., Pitschei-der, A., Pohlkamp, H., Scharffe, D., Specht, K., and Wiedensohler, A.: CARIBIC civil aircraft for global measurement of trace gases and aerosols in the tropopause region, J. Atmos. Ocean. Technol., 16, 1373–1383, 1999.
Brenninkmeijer, C. A. M., Crutzen, P., Boumard, F., Dauer, T., Dix, B., Ebinghaus, R., Filippi, D.,
25
Fischer, H., Franke, H., Frieβ, U., Heintzenberg, J., Helleis, F., Hermann, M., Kock, H. H., Koeppel, C., Lelieveld, J., Leuenberger, M., Martinsson, B. G., Miemczyk, S., Moret, H. P., Nguyen, H. N., Nyfeler, P., Oram, D., O’Sullivan, D., Penkett, S., Platt, U., Pupek, M., Ra-monet, M., Randa, B., Reichelt, M., Rhee, T. S., Rohwer, J., Rosenfeld, K., Scharffe, D., Schlager, H., Schumann, U., Slemr, F., Sprung, D., Stock, P., Thaler, R., Valentino, F.,
30