Adv. Sci. Res., 3, 23–26, 2009 www.adv-sci-res.net/3/23/2009/
©Author(s) 2009. This work is distributed under the Creative Commons Attribution 3.0 License.
Advances in
Science and
Research
8th
EMS
Annual
Meeting
and
7th
Eur
opean
Confer
ence
on
Applied
Climatolo
gy
2008
Data quality control and homogenization of air
temperature and precipitation series in the area of the
Czech Republic in the period 1961–2007
P. ˇStˇep´anek, P. Zahradn´ıˇcek, and P. Skal´ak
Czech Hydrometeorological Institute, Regional Office Brno, Czech Republic
Received: 26 January 2009 – Revised: 17 February 2009 – Accepted: 27 February 2009 – Published: 7 April 2009
Abstract. Quality control and homogenization has to be undertaken prior to any data analysis in order to eliminate any erroneous values and non climatic biases in time series. In this work we describe and then apply our own approach to data quality control, combining several methods: (i) by applying limits derived from interquartile ranges (ii) by analyzing difference series between candidate and neighbouring stations and (iii) by comparing the series values tested with “expected” values – technical series created by means of statistical methods for spatial data (e.g. IDW, kriging).
Because of the presence of noise in series, statistical homogeneity tests render results with some degree of uncertainty. In this work, the use of various statistical tests and reference series made it possible to increase considerably the number of homogeneity test results for each series and thus to assess homogeneity more reliably. Inhomogeneities were corrected on a daily scale.
These methodological approaches are demonstrated by use of the daily data of air temperature and precipitation measured in the area of the Czech Republic. Series were processed by means of developed ProClimDB and AnClim software (http://www.climahom.eu).
1 Introduction
In recent years considerable attention has been devoted to the analysis of daily data. Prior to analysis, the need to homog-enize data and check their quality arises (Brandsma, 2000; Vincent et al., 2002; Wijngaard et al., 2003; Petrovic, 2004; Della-Marta, 2006; and others). Several kinds of problem have to be taken into consideration in the course of data pro-cessing. These involve selection of a proper method for ho-mogenization with regard to the data used, i.e. fulfilling all the conditions necessary to applying selected tests of rela-tive homogeneity (e.g. normal distribution), creation of ref-erence series (defining selection criteria), adjustment of inho-mogeneities revealed, completion of missing values, and oth-ers. To date, no widely accepted homogenization approach has appeared that could be generalized and applied to a wider range of meteorological elements and different climatic re-gions. However, such approaches are needed. The creation
Correspondence to:P. ˇStˇep´anek ([email protected])
of a general method of homogenization is also the main goal of the ongoing COST action HOME-ES0601, planned to end in 2011.
Considering quality control, we also have to face the lack of a generally accepted methodology like in the case of ho-mogenization. Without treating outliers, homogenization and analysis may render misleading results. We therefore devoted considerable time to the methodology of detecting outliers, something that could moreover be automated to pro-cess large datasets of daily (subdaily) values.
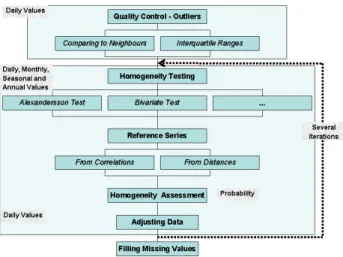
In terms of this work, processing included the following steps: detection, verification and possible correction of out-liers, creation of reference series, homogeneity testing (vari-ous homogeneity tests), determination of inhomogeneities in the light of test results and metadata, adjustment of inhomo-geneities and filling in missing values (Fig. 1).
Quality control and homogenization was performed on the daily values for all the basic meteorological elements in the area of the Czech Republic. This paper concentrates espe-cially upon air temperature (270 climatological stations with the mean minimum distance of 13.3 km) and precipitation
24 P. ˇStˇep´anek et al.: Data quality control and homogenization
Fig. 1. Scheme of quality control and homogenization process.
Figure 1.Scheme of quality control and homogenization process.
(787 stations with the mean minimum distance of 6.5 km) measuring at least 20 years in the period 1961–2007.
2 Quality control
In this work, data quality control was carried out by com-bining several methods: (i) by analyzing difference series between candidate and neighbouring stations – i.e. pairwise comparisons (ii) by applying limits derived from interquar-tile ranges (this can be applied either to individual series, i.e. absolutely or, better, to difference series between candidate and reference series, i.e. relatively) and (iii) by comparing the series values tested with “expected” values – technical series created by means of statistical methods for spatial data (e.g. IDW, kriging).
Neighbouring stations (method i) or reference series (method ii) may be selected either by means of correlations or distances (in the case of temperature the results are dif-ferent, while for precipitation the selection coincides). Cor-relation coefficients can be applied either to raw series or to series of first differences (see e.g. Peterson, 1998). In our case, for comparison with neighbour stations, up to eight of the nearest stations were selected, with significant correlation coefficients, a distance limit of 300 km and altitude difference restricted to 500 m.
A method for outlier detection that could be automated to the greatest extent was a priority, since millions of values had to be processed for each meteorological element. Such a method was finally found and successfully applied. It uti-lizes a combination of several characteristics and their lim-its based on methods mentioned above (details on the qual-ity control process may be found e.g. in the documentation for ProClimDB software, ˇStˇep´anek, 2008). No one method alone was found adequate; only a combination lead to sat-isfying results – the discovery of real outliers and suppres-sion of fault alarms. Parameters (the settings appropriate to the methods) had to be found individually for each
meteoro-logical element. Figure 2 shows example of final output for decision-making about outliers.
The number of outliers has clear annual cycle. For most of the elements (e.g. air temperature), a higher number of out-liers was detected in summer months than in winter months (connected with larger neighbour differences variations due to influence of active surface). More outliers were detected in the morning and evening measurements compared to noon (associated with steeper gradients in the former case). For precipitation there are two maxima per year, in the summer months and then in January and December (in winter it is per-tinent to problems with solid precipitation measurements), while during spring and autumn a lower number of outliers was detected. The number of detected outliers also changes with time. For air temperature, the higher number of out-liers since the late 1990s coincides well with transition to automatic measurements. Our explanation is that all values coming from automated measurements (including errors) are stored straight into database while in the case of manual mea-surements observer revises read values before sending them to meteorological office. On the contrary, in the case of pre-cipitation no increase of errors after automation was encoun-tered.
3 Homogenization
Because of presence of noise in series, statistical homogene-ity tests render results with some degree of uncertainty. In this work, the use of various statistical tests and types of ref-erence series made it possible to increase considerably the number of homogeneity tests results for each series tested and thus to assess homogeneity more reliably.
The relative homogeneity tests applied were: Standard Normal Homogeneity Test [SNHT] (Alexandersson, 1986, 1995); the Maronna and Yohai bivariate test (Potter, 1981); and the Easterling and Peterson test (Easterling and Peter-son, 1995). Reference series were calculated as weighted average from the five nearest stations (measuring within the same period as candidate series), with statistically significant correlations, a distance limit of 300 km and an altitude dif-ference limit of 500 m. The power for weights (inverse dis-tance) for temperature was taken as 1, for precipitation as 3. Neighbouring station values were standardized to aver-age and standard deviation of candidate station. Detection of inhomogeneities was performed for series divided to a maxi-mum duration of 40 years, with the overlap for two consecu-tive periods of 10 years (due to requirements of SNHT to test only one shift). The tests were applied on monthly as well as seasonal and annual averages (sums in case of precipitation). The main criterion for determining a year of inhomogene-ity was the probabilinhomogene-ity of detection of a given year, i.e. the ratio between the count of detections for a given year from all test results for a given station (using type of reference series, range of tests applied, monthly, seasonal and annual
P. ˇStˇep´anek et al.: Data quality control and homogenization 25
ě
Fig. 2. Example of ProClimDB software output for outlier values evaluation with auxiliary
Figure 2.Example of ProClimDB software output for outlier values evaluation with auxiliary characteristics for quality control evaluation.
-6.0 -5.0 -4.0 -3.0 -2.0 -1.0 0.0 1.0 2.0 3.0 4.0 5.0 6.0 0. 0 01 0. 0 55 0. 1 10 0. 1 64 0. 2 18 0. 2 73 0. 3 27 0. 3 82 0. 4 36 0. 4 90 0. 5 45 0. 5 99 0. 6 53 0. 7 08 0. 7 62 0. 8 16 0. 8 71 0. 9 25 0. 9 79 Percentile T em per a tur e / °C Differences Smoothed -6.0 -5.0 -4.0 -3.0 -2.0 -1.0 0.0 1.0 2.0 3.0 4.0 5.0 6.0 0. 001 0. 055 0. 110 0. 164 0. 218 0. 273 0. 327 0. 382 0. 436 0. 490 0. 545 0. 599 0. 653 0. 708 0. 762 0. 816 0. 871 0. 925 0. 979 Percentile T e m per at ur e / °C Before break After break
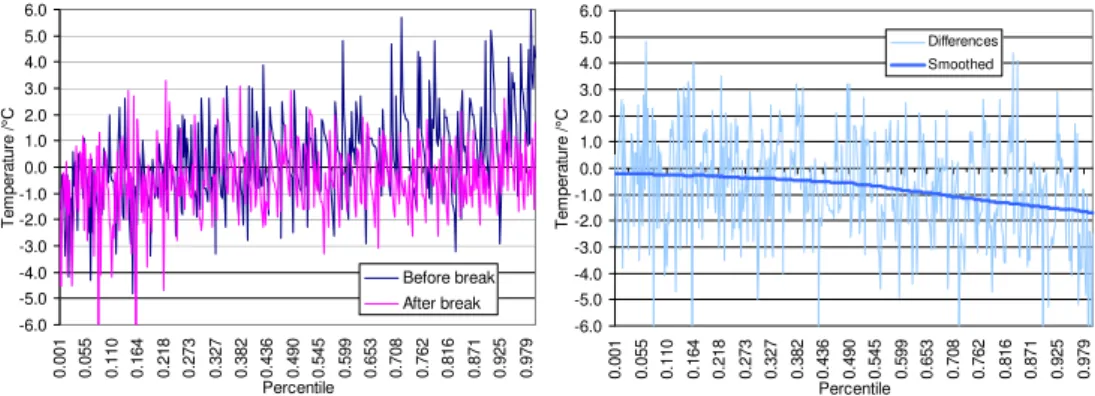
Figure 3.Deriving corrections for individual percentiles from differences between candidate and reference series before and after a break.
series) and the count of all theoretically possible detections. Further details of reference series creation and testing may be found in ˇStˇep´anek et al. (2007).
After evaluation of detected breaks and comparison with metadata, a final decision on correction of inhomogeneities was made. Data were corrected on a daily scale. Adjustment of such inhomogeneities was addressed by means of a refer-ence series calculated in a similar way as described above.
We created our own correction method, an adaptation of a method for the correction of regional climate model outputs by D´equ´e (2007), itself based on assumptions similar to those implicit in methods described by Trewin and Trevitt (1996) and Della-Marta (2006), which apply variable correction ac-cording to individual percentiles (or deciles). Our process is based on comparison of percentiles (empirical distribution) of differences (or ratios) between candidate and reference se-ries before and after a break. Percentiles are estimated from candidate series and values for differences of candidate and references series are taken from the same time (date). Each month is processed individually, but also taking into account the values of adjacent months before and after it to ensure smoother passage from one month to another. Candidate – reference differences for individual percentiles are then dif-ferenced before and after a break and smoothed by low-pass filter to obtain a final adjustment based on a given percentile
(see Fig. 3 for illustration). Values (before a break) are then adjusted in such a way that we find a value for the candidate series before a break (interpolating between two percentile values if needed) and the corresponding correction factor, which is then applied to the value to be adjusted. Special treatment is needed for outlier values at the ends of distribu-tions.
Various characteristics were analyzed before applying the adjustments: the increment of correlation coefficients be-tween candidate and reference series after adjustments; any change of standard deviation in differences before and after the change; presence of linear trends, etc. In the event of any doubt, the adjustments were not applied.
The above-mentioned steps (homogeneity testing, evalu-ation and correction of inhomogeneities detected) were per-formed in several iterations. At each iteration, more precise results were obtained. Missing values were filled in only af-ter homogenization and adjustment of inhomogeneities in the series. The reason for this was that the new values were es-timated from data not influenced by possible shifts in the se-ries. Moreover, when missing data are filled in before ho-mogenization, they may influence inhomogeneity detection in a negative way.
For monthly values of air temperature and precipitation in the area of the Czech Republic, the correlation coefficients
26 P. ˇStˇep´anek et al.: Data quality control and homogenization between candidate and reference series are very high (median
above 0.95 or 0.90 respectively, note that the precipitation station network is much denser than the climatological one). As for inhomogeneities detection itself, for air tempera-ture more breaks occur in the summer months (the influence of relocation and other artificial changes is greater resulting from influence of active surface – prevailing radiation fac-tors and increased volume of vegetation) while this occurs for precipitation in the winter months (mainly due to prob-lems associated with measurement of solid precipitation).
An annual cycle is also clearly manifested in the correc-tion of inhomogeneities. Considering the absolute values of corrections, the degrees of adjustment were higher during the summer months for air temperature. For precipitation, major corrections (ratios) were applied in winter months (reasons being the same as for number of inhomogeneities, see previ-ous paragraph). After correction, for air temperature correla-tion coefficients increased mainly in the summer months, for precipitation in the winter months.
Automation of measurements had very strong influence on the homogeneity of station time series (and even the occur-rence of outliers). Fortunately, automation was introduced successively into the station network so it was possible to detect it and make corrections without major problems.
4 Conclusions
The current work presents a methodology for outlier detec-tion and series homogenizadetec-tion for various meteorological elements in the area of the Czech Republic in the period 1961–2007.
In the outlier detection itself, errors must be sought in straight, measured data rather than merely daily averages or even monthly averages (sums), since outliers are masked to a greater or lesser extent in the latter. Errors in measure-ment tend to occur more frequently in certain parts of the year, generally in the summer months (bigger role of active surface).
A clear annual cycle also emerged in several of the char-acteristics of the inhomogeneities detected. For example, air temperature inhomogeneities occur mainly in the sum-mer months and the same holds for the amount of correc-tions applied, while in the case of precipitation more inho-mogeneities were detected in the winter months (associated with solid precipitation measurements); the corrections ap-plied were also higher in the winter months.
The data processing for this work was carried out by means of ProClimDB software for processing whole datasets (finding outliers, combining series, creating reference series, preparing data for homogeneity testing, etc.) and AnClim software for homogeneity testing (http://www.climahom.eu). Further development of the software, e.g. connection with R software, is ongoing.
Further steps in quality control and homogenization will lead to analysis of individual observation hours and also his-torical data.
Acknowledgements. The authors would like to acknowledge the financial support of the Grant Agency of the Czech Republic for
project no. 205/08/1619.
Edited by: S. Szalai
Reviewed by: two anonymous referees
References
Alexandersson, A.: A homogeneity test applied to precipitation data, J. Climatol., 6, 661–675, 1986.
Alexandersson, A.: Homogenity testing, multiple breaks and trends, in: Proc. 6th Int. Meeting on Stat. Climatology, Galway, Ireland, 439–441, 1995.
Brandsma, T.: Weather-type dependent
homogeniza-tion of daily Zwanenburg/De Bilt temperature series,
http://www.met.hu/omsz.php?almenu id=omsz&pid=
seminars&pri=6&mpx=1&sm0=0&tfi=brandsma, 2000.
Della-Marta, P. M. and Wanner, H.: A Method of Homogenizing the Extremes and Mean of Daily Temperature Measurements, J. Climate, 19, 4179–4197, 2006.
D´equ´e, M.: Frequency of precipitation and temperature extremes over France in an anthropogenic scenario: model results and sta-tistical correction according to observed values, Global Planet. Change, 57, 16–26, 2007.
Easterling, D. R. and Peterson, T. C.: A new method for detecting undocumented discontinuities in climatological time series, Int. J. Climatol., 15, 369–377, 1995.
Peterson, T. C.: Homogeneity adjustments of in situ atmospheric climate data: a review, Int. J. Climatol., 18, 1493–1517, 1998. Petrovic, P.: Detecting of inhomogeneities in time series using Real
Precision Metod, in: Fourth seminar for homogenization and quality control in climatological databases (Budapest, Hungary, 6–10 October 2003), WCDMP-No. 56., WMO, Geneva, 79–88, 2004.
Potter, K. W.: Illustration of a New Test for Detecting a Shift in Mean in Precipitation Series, Mon. Weather Rev., 109, 2040– 2045, 1981.
ˇStˇep´anek, P., ˇRezn´ıˇckov´a, L., and Br´azdil, R.: Homogenization of daily air pressure and temperature series for Brno (Czech Re-public) in the period 1848–2005, in: Proceedings of the Fifth seminar for homogenization and quality control in climatological databases (Budapest, 29 May–2 June 2006), WCDMP, WMO, Genova, CD-ROM, 2008.
ˇStˇep´anek, P.: ProClimDB – software for processing climatological
datasets, CHMI, regional office Brno, http://www.climahom.eu/
ProcData.html, 2008.
Trewin, B. C. and Trevitt, A. C. F.: The development of composite temperature records, Int. J. Climatol., 16, 1227–1242, 1996. Vincent, L. A., Zhang, X., Bonsal, B. R., and Hogg, W. D.:
Ho-mogenization of daily temperatures over Canada, J. Climate, 15, 1322–1334, 2002.
Wijngaard, J. B., Klein Tank, A. M. G., and K¨onnen, G. P.: Ho-mogenity of 20th century European daily temperature and pre-cipitation series, Int. J. Climatol., 23, 679–692, 2003.