Revista Brasileira de
Engenharia Agrícola e Ambiental
Campina Grande, PB, UAEA/UFCG – http://www.agriambi.com.br
v.19, n.10, p.920–925, 2015
Use of LST images from MODIS/AQUA sensor as an indication
of frost occurrence in RS
Débora de S. Simões
1, Denise C. Fontana
2& Matheus B. Vicari
1 DOI: http://dx.doi.org/10.1590/1807-1929/agriambi.v19n10p920-925A B S T R A C T
Although frost occurrence causes severe losses in agriculture, especially in the south of Brazil, the data of minimum air temperature (Tmin) currently available for monitoring and predicting frosts show insufficient spatial distribution. This study aimed to evaluate the MDY11A1 (LST – Land Surface Temperature) product, from the MODIS sensor on board the AQUA satellite as an estimator of frost occurrence in the southeast of the state of Rio Grande do Sul, Brazil. LST images from the nighttime overpass of the MODIS/AQUA sensor for the months of June, July and August from 2006 to 2012, and data from three conventional weather stations of the National Institute of Meteorology (INMET) were used. Consistency was observed between Tmin data measured in weather stations and LST data obtained from the MODIS sensor. According to the results, LSTs below 3 ºC recorded by the MODIS/AQUA sensor are an indication of a favorable scenario to frost occurrence.
Uso de imagens TST do sensor MODIS/AQUA
como indicativo da ocorrência de geadas no RS
R E S U M O
Apesar da ocorrência de geadas causar severas perdas à agricultura, em especial no Sul do Brasil, os dados de temperatura mínima do ar atualmente disponíveis para o monitoramento e previsão deste fenômeno apresentam distribuição espacial insuficiente. O objetivo deste trabalho foi avaliar o produto MDY11A1 (TST - Temperatura da Superfície Terrestre), do sensor MODIS a bordo do satélite AQUA como estimador da ocorrência de geadas sobre o Sudeste do Estado do Rio Grande do Sul. Utilizaram-se imagens de TST da passagem noturna do sensor MODIS/AQUA dos meses de junho, julho e agosto de 2006 a 2012 e dados de três estações meteorológicas convencionais do INMET. Verificou-se coerência entre os dados de Temperatura mínima do ar medidos em estações meteorológicas e os dados de Temperatura da superfície da terra obtidos do sensor MODIS. Resultados desta pesquisa apontam que as TSTs registradas pelo sensor MODIS/AQUA inferiores a 3 °C são indicativas de situação favorável à ocorrência de geadas.
Key words:
minimum air temperature land surface temperature remote sensing
Palavras-chave:
temperatura mínima do ar temperatura da superfície terrestre sensoriamento remoto
1 Programa de Pós-Graduação em Sensoriamento Remoto/Centro Estadual de Pesquisas em Sensoriamento Remoto e Meteorologia/Universidade Federal
do Rio Grande do Sul. Porto Alegre, RS. E-mail: [email protected] (Autora correspondente); [email protected]
2 Universidade Federal do Rio Grande do Sul. Porto Alegre, RS. E-mail: [email protected]
Introduction
Frost is an adverse meteorological phenomenon that can cause severe losses in agriculture, especially in the states of southern Brazil, because of the frequency and intensity of the events. In 2006, according to data from Emater-RS, there was a 50% shortfall in the wheat production of the state of Rio Grande do Sul. The late frosts (during the spring) in that year coincided with wheat flowering, which is the period of highest sensitivity to low temperature events, even for a winter crop (Junges et al., 2008).
The importance of the topic stimulates studies that have served as the base for actions to minimize risks in agriculture. Currently, farmers have access to information on activity planning, especially related to the zoning of climatic risk, which considers the occurrence of low temperatures as its essential criterion (Dalmago et al., 2008). Also important
is information on crop management, especially short-term warnings (48 h in advance) about the probable occurrence of frosts (Reis Júnior, 2006).
Frosts can be recorded using two criteria: visual observation of the formation of ice crystals on surfaces and inferences on frost occurrence using measurements of air temperatures. Studies have shown that air temperatures measured in the weather shelter below a threshold and that can be above 4 ºC (Sentelhas et al., 1995) are associated with the occurrence of frosts. This is a widely used criterion in climatological studies related to frost occurrence (Pezza & Ambrizzi, 2005), besides its advantage of objectivity. Despite using this objective criterion, there is still the challenge of the spatialization of information. The low number and irregular distribution of weather stations in Brazil make it difficult to obtain temperature data in a spatial scale that allows the adequate monitoring of atmospheric conditions during the occurrence of frosts. This phenomenon is widely dependent on the radiation balance of the surface and, consequently, it is associated with its heterogeneous characteristics.
Satellite images obtained in the thermal infrared band can contribute to the generation of detailed information of this phenomenon, since atmospheric conditions favorable to the loss of longwave radiation by the surface during the night, which leads to frost occurrence (Varejão-Silva, 2006), coincide with the adequate conditions for surface imaging from orbital sensors, due to the high atmospheric transmittance. Orbital images allow a much higher territorial coverage compared with the capacity of weather stations to represent surface variability, thus having advantages in agricultural monitoring (Lensky & Dayan, 2011).
As to the data of land surface temperature (LST), many studies have analyzed the quality of the available information through the comparison with air temperature data from weather stations (Gusso et al., 2007; Lopes et al., 2011). In general, the results show determination coefficients ranging from 0.63 to 0.86. The uncertainties in these studies come from the LST estimates, related not only to the quantification of surface emissivity and atmospheric interference (Gusso et al., 2007), but also to the collection of the dataset used as a reference, given the differences in nature and coverage of the measurements of some elements (François et al., 1999).
Among the possibilities of obtaining LST images, data from the MODIS (Moderate Resolution Imaging Spectroradiometer) sensor from the AQUA satellite stand out, because of the overpass time and the high processing level, which facilitate and accelerate the analyses. The MDY11A1 product has been used especially in regions with low density of weather stations in cold areas of the globe, as in the studies of Pouteau et al. (2011) and Hachem et al. (2012).
Given the importance of information on minimum temperature, the difficulties in obtaining it with adequate spatial representation and the coincidence of atmospheric condition for frost occurrence and data collection through orbital sensors, this study aimed to evaluate the quality of the MDY11A1 product from the MODIS/AQUA sensor as an indication of frost occurrence and generate a frost occurrence map for the southeast of Rio Grande do Sul, Brazil, in order to assist frost-monitoring systems.
Material and Methods
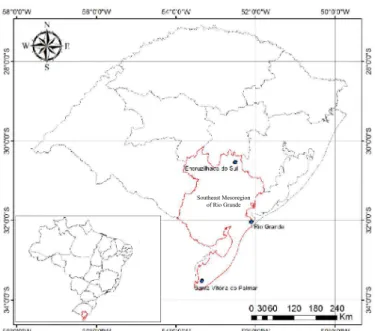
The southeast region of the state of Rio Grande do Sul (Figure 1) was chosen for having the physical characteristics that allow the observation of different conditions with respect to the risk of frost occurrence. Successive and intense high-latitude frontal systems bring abundant rainfalls to the region, followed by masses of polar air. Air temperature decreases abruptly with the entry of these masses, assuming values slightly higher than 0 ºC, and not rarely negative values, leading to the occurrence of frosts (Nimer, 1979).
The studied period comprehended the months of June, July and August of six consecutive years, from 2006 to 2012, coinciding with the trimesters studied by Müller et al. (2005). The three following sets of observations were used: minimum air temperature (Tmin) data, frost occurrence date and LST images. Initially, the quality of LST data for the studied region was evaluated and then the data were used for the determination of the frequencies of occurrence of low temperatures.
Figure 1. Study area and location of the selected weather stations
The daily data of Tmin and frost occurrence dates were collected from three conventional surface weather stations: Encruzilhada do Sul (-30° 32’; -52° 31’; 427.75 m), Rio Grande (-32° 02’; -52° 07’; 2.46 m) and Santa Vitória do Palmar (-33° 31’; -53° 21’; 24.01 m) (Figure 1). The dates of frost occurrence were used to define a subset of data referring only to Tmin of days with frost (Tmin_frost), available from 2007 on. In the text, this subset is referred to as reduced series. The meteorological data were obtained from the dataset of the National Institute of Meteorology (INMET).
The LST data came from the MDY11A1 product obtained from orbital images of the MODIS sensor on board the AQUA satellite in the nighttime overpass. This product, with 1000-m spatial resolution, provides daily LST data recovered by the split-window algorithm and emissivity (ε) obtained from the bands 31 and 32 (NASA, 2013). All the MODIS images were obtained without charge, through the Reverb | ECHO website of NASA. The images were processed using the software ArcGIS® 10, using the interactive modeling tool Model Builder, which allows the creation of computational routines that combine the ease of programming with the efficiency and flexibility of the use of its tools. The routines were developed through flowcharts relating input data, parameters related to each tool, the processing tool itself and output data.
The first steps were the extraction of LST data from the 12 subsets of data comprising the MDY11A1 product, the conversion of temperature units from Kelvin to Celsius and the outline of the limits of the study area. Then, Boolean classification was applied, i.e., each pixel was compared with a threshold value (0, 1, 2 and 3 ºC). Thus, only pixels with temperatures below these values were considered as temperatures susceptible to frost occurrence.
After that, a simple frequency count was performed and then a second classification, disregarding pixels with failures: for example, clouds. Using a technique of image overlapping, the possible frost occurrences and the total number of valid data were counted separately, generating two distinct mappings; one with the count of the total number of probable frost occurrences and another with the total number of valid data for each threshold, with or without frost. The final step consisted in calculating the ratio between the count of occurrences and the total count of valid data, generating the mapping of the relative frequency of the days with temperatures susceptible to frost occurrence.
For the comparison between Tmin and LST data, a 3 x 3 pixel window, centered in the coordinates of the weather station in study, was extracted. The LST value of this window was defined by the mean of the values of its pixels. Using the dataset obtained from the weather stations (Tmin and Tmin_frost) and the MDY11A1 (LST) product, the basic statistics of the series were calculated: number of occurrences, minimum value, maximum value, mean and standard deviation. The significances were tested through Student’s t-test and F test, both at 95% . In addition, linear regression equations were fitted between Tmin and LST through the mean square method, for each location throughout the entire period and for the total dataset. The degree of fitting of the equations was evaluated by the coefficients of correlation (R) and determination (R2).
Results and Discussion
Based on the analyzed period (winter), Tmin and LST mean values were low and showed influence from the factors latitude, altitude and continental influence in the definition of the means in the studied locations (Table 1 and Figure 2).
The lowest Tmin values in the total series were observed in Santa Vitória do Palmar (6.5 ºC), in the south of the state, followed by Encruzilhada do Sul (7.9 ºC), where the lowest latitude was compensated by the highest altitude (427 m). However, the highest Tmin mean (8.5 ºC) was observed in the weather station of Rio Grande, which shows intermediate latitude, low altitude and is closer to the ocean. As expected, mean temperatures in nights with frost (Tmin_frost) were lower than the means calculated for the total series: 1.9 °C in Encruzilhada do Sul and 2.5 °C in Santa Vitória do Palmar. No data is shown in Table 1 for the weather station of Rio Grande
Figure 2. Distribution of values of minimum air temperature (Tmin) and land surface temperature (LST) in the total series (2006 to 2012) for the locations of Encruzilhada do Sul, Rio Grande and Santa Vitória do Palmar. External lines in each dataset represent the first and third quartiles and the internal line represents the median
Diff. – Mean of the differences between Tmin and LST
Table 1. Statistics of the data of minimum air temperature (Tmin and Tmin_frost) and land surface temperature (LST) for the total series (2006 to 2012) and reduced series (days with frost) for the locations of Encruzilhada do Sul, Rio Grande (without frost occurrence in the period) and Santa Vitória do Palmar
LST LST LST
T
emperature (
in the reduced series, because frost occurrence was not visually observed from 2007 to 2012.
The pattern observed in the LST data was similar to those in Tmin and Tmin_frost, but with lower thermal amplitude between the locations. The positive value for the mean of the differences of temperatures (Diff = Tmin - LST) corresponded to the expected, due to the difference in the level of acquisition of the two datasets. Usually, the phenomenon of thermal inversion occurs during the night (Varejão-Silva, 2006), resulting in temperature close to the surface (equivalent to LST) lower than that measured in the meteorological shelter (Tmin), with thermometer at a height of 1.5 m, a tendency also observed by Ferreira et al. (2006).
Probably, the pattern observed in Rio Grande is associated with its location, surrounded by large bodies of water: Laguna dos Patos, Saco da Mangueira and the Atlantic Ocean. This increases the uncertainties, causing, on one hand, the possibility of spectral mixture in the pixel (land and water), due to the dimensions of the MODIS pixel (1000 x 1000 m) and, on the other hand, lower atmospheric transparency, due to the higher presence of water vapor in the atmosphere (Meneses & Almeida, 2012).
Standard deviation values were very close in both series, indicating that the pattern is similar in Tmin and LST, despite the greatly different obtaining methods. The probability of the F test applied to the variances showed that no significant difference was observed in the data from Encruzilhada do Sul and Santa Vitória do Palmar, only in the data from Rio Grande.
In the box diagrams (Figure 2), the data are not well distributed, with median close to the half of the boxes, which indicates a distribution close to normal. 90% of the data are above 0 ºC, indicating the occurrence of few cases of visually detectable frost. However, all the minimum values remained below 3 ºC, which shows the occurrence of frost events, as also observed by Roberti et al. (2013). LST values were lower than Tmin values, probably due to the thermal inversion, but showed lower variability. Discrepant values are present, because the variables are dependent on a complex process of energy transfer between the land surface and the atmosphere.
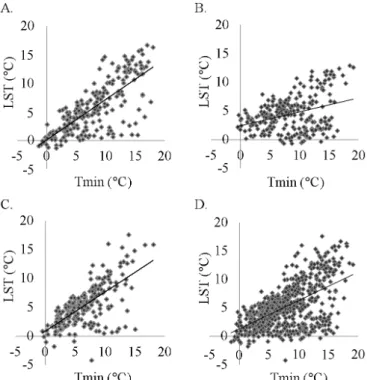
The results of the linear regression analysis for each location and for the total dataset, i.e., data from the three locations as only one series, are shown in Table 2 and Figure 3.
High dispersion was observed in the four datasets, with low R2 values, all below 0.57. These results are acceptable, because
of the attempt to explain a complex phenomenon, like the heat flow between land surface and atmosphere, through a simple linear relationship, without taking into consideration many factors that greatly interfere with this process. The weak correlation in the data of Rio Grande indicates the dependence of the two variables with respect to other factors. Studies
conducted by Mezzomo et al. (2007) showed that Rio Grande is situated in a homogeneous region, different from the other studied cities with respect to quarterly mean of Tmin. Student’s t-test indicated that LST and Tmin means showed significant statistical difference at levels usually adopted (99, 95 and 90%), because LST is expected to be similar to grass temperature (Tgrass), a variable not used in this study.
Probably, the factors that most contributed to the high dispersion of the data were the time of Tmin occurrence and the satellite overpass time in the studied region, which do not coincide. The AQUA satellite collects LST information in the studied area during the night, approximately around 01:15 a.m., local time. As to the time of occurrence of Tmin, it is known that the supply of shortwave radiation to the earth surface is interrupted after the sunset; however, the earth continues to emit longwave radiation to the atmosphere. This flow is more pronounced when atmospheric transparency is higher, i.e., absence of clouds and low humidity. The lowest value of minimum air temperature, in general, occurs just before the sunrise, which ranges from 07:00 to 07:30 a.m. in the winter months. However, according to Varejão-Silva (2006), the presence of phenomena capable of disturbing the prevailing state of the atmosphere (invasion of cold air, for instance) can change the forecast of the probable times of occurrence of extreme temperatures.
Another factor that brings uncertainties to the analyses is the difference in the height of temperature measurement. While Tmin is measured at 1.5 m above the surface, LST estimates the temperature of the surface and, consequently, is more directly associated with grass temperature (Tgrass) and the occurrence of frost. Ferreira et al. (2006), studying the difference between Tmin and Tgrass measured in eight weather stations in Rio
S Strong; W Weak; M Moderate. * Significant at 0.05%, ns Not significant
Table 2. Linear regression equations and determination coefficients (R2) obtained with the data from 2006 to 2012
Grande do Sul, reported a difference of 2.0 ºC, which is close to the value of 3 ºC, proposed by Oliveira (1997). When the analysis is performed for the total series, which contains the data of days with and without frost occurrence, the values of difference between Tmin and LST ranged from 1.2 to 3.9 ºC (Table 1). For the reduced series with only days of frost occurrence, this mean is lower, from 0.12 to 0.4 ºC, which is justified by the local meteorological condition, favorable to radiation loss by the earth surface, lower air turbulence close to the surface and higher atmospheric transparency. This favors the formation of a thicker layer of air with temperature close to that of the surface.
It should be pointed out that the quality of LST data in the present study was evaluated through a comparison with Tmin data, which are obtained at different times, different heights and come from measures with different physical natures, as previously mentioned. In addition, temperatures measured inside the meteorological shelter (Tmin) may not represent adequately air thermal conditions in the surroundings of the weather station (Varejão-Silva, 2006), unlike LST.
Even considering all the mentioned uncertainties, it is reasonable to assume that there is a consistency between measurements of Tmin in weather stations and LST from the MYD11A1 product in the studied region. The great advantage of using LST data is the spatial representation of temperature, which allows the conduction of climatological studies for the region at a level of detail much higher than the possible level using interpolated data from weather stations.
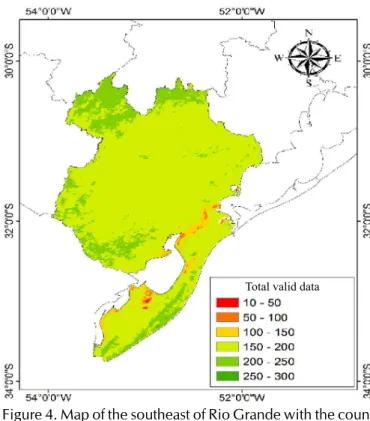
After performing the total count of the data (Figure 4), in order to spatialize the frequency of occurrence of low temperatures, the lowest counts of valid data were observed close to large ponds, possibly representing the mixture of land-water pixels and/or lower atmospheric transparency.
Figure 4. Map of the southeast of Rio Grande with the count of valid data of land surface temperature (LST) in the period of June, July and August from 2006 to 2012
Total valid data
Maps with the relative frequencies using cutting temperatures of 0, 1, 2 and 3 ºC are shown in Figure 5. These thresholds were selected because LST from the MODIS/AQUA sensor is based on the temperature measured around 01:15 a.m., local time. After that, especially in synoptic conditions typical of frosty nights, there is a sharp fall of air temperature (Varejão-Silva, 2006), which can favor the occurrence of frosts moments after the passage of the satellite. Another fact that contributed to the selection of the cutting temperatures is related to the mean LST values of the days with frost occurrence (reduced series – Table 1), 1.6 ºC in Encruzilhada do Sul and 2.4 ºC in Santa Vitória do Palmar. Therefore, it is believed that mappings generated for higher temperature thresholds tend to represent the actual situation in the region.
When the threshold of 0 ºC was used, the frequencies were very low, reaching a maximum value of 23% in a small area of the studied region. As the cutting values increased to up to 3 ºC, the frequency increased, as expected. In this case, many pixels began to meet the condition of risk of frost occurrence. The coverage area became larger and the frequency of occurrence became close to 50%, i.e., there were temperatures below this threshold in that pixel in half of the analyzed period. In general, the frequency of occurrence of low temperatures close to bodies of water (coastline and ponds) is lower, which evidences the conservative characteristics of the water. The frequencies increase in the central and west parts of the studied region, partially due to the higher altitudes. The increase of frequency in the extreme south, even in a less expressive form than in the west of the region, is also explainable, which evidences the influence of latitude on the occurrence of low temperatures.
Figure 5. Map of the southeast of Rio Grande with the count of the frequency of days with LST < 0 °C (A), LST < 1 °C (B), LST < 2 °C (C) and LST < 3 °C (D), for the period of June, July and August from 2006 to 2012
Frequency of days (%) Temperature < 0 ºC
Frequency of days (%) Temperature < 1 ºC
Frequency of days (%) Temperature < 2 ºC
Ultimately, a verification test can be performed in the information generated in the mapping by crossing the data of Figure 5 with the data in Table 1. In the reduced series, from the total Tmin data analyzed, nearly 13% in Encruzilhada do Sul and 15% in Santa Vitória do Palmar showed frost records by visual observation (Tmin_frost). In the images, the mean frequencies of LST < 3 ºC in the sample window of the respective weather stations were equal to 15 and 18%, respectively. In this context, it can be assumed that the LST < 3 ºC is an indication of frost occurrence in the region and, consequently, the MYD11A1 product can be used to spatialize this adverse phenomenon.
Conclusions
1. There is a consistency between the data of minimum air temperature measured in weather stations and the data of land surface temperature from the MODIS/AQUA sensor.
2. Land surface temperatures lower than 3 ºC, obtained from the MDY11A1 product of the MODIS/AQUA sensor, can be used to determine the occurrence of low temperatures in synoptic situations favorable to the occurrence of frosts.
Acknowledgments
To CNPq (National Council for Scientific and Technological Development), for granting the scholarship, and to INMET (National Institute of Meteorology), for providing the meteorological data used in this study.
Literature Cited
Dalmago, G. A.; Cunha, G. R. da; Tomm, G. O.; Pires, J. L. F.; Santi, A.; Pasinato, A.; Fanton, G.; Luersen, I.; Müller, F. L. D.; Müller, A. L. Zoneamento agroclimático para o cultivo de canola no Rio Grande do Sul. Revista Brasileira de Agrometeorologia, v.16, p.295-305, 2008. Ferreira, C. F.; Fontana, C. F.; Berlato, M. A. Relação entre a temperatura mínima doar medida no abrigo meteorológico e na relva no Estado do Rio Grande do Sul. Revista Brasileira de Agrometeorologia, v.14, p.53-63, 2006.
François, C.; Bosseno, R.; Vacher, J.J.; Seguin, B. Frost risk mapping derived from satellite and surface data over the Bolivian Altiplano. Agricultural and Forest Meteorology, v.95, p.113-137, 1999. http:// dx.doi.org/10.1016/S0168-1923(99)00002-7
Gusso, A.; Fontana, D. C.; Gonçalves, G. A. Mapeamento da temperatura da superfície terrestre com uso do sensor AVHRR/ NOAA. Pesquisa Agropecuária Brasileira, v.42, p.231-237, 2007. http://dx.doi.org/10.1590/S0100-204X2007000200012
Hachem, S.; Duguay, C. R.; Allard, M. Comparison of MODIS-derived land surface temperatures with ground surface and air temperature measurements in continuous permafrost terrain. The Cryosphere, v.6, p.51-69, 2012. http://dx.doi.org/10.5194/tc-6-51-2012
Junges, A. H.; Gusso, A.; Melo, R. W.; Fontana, D. C. Avaliação das perdas de rendimento de trigo na safra de 2006 por meio da análise de temperaturas mínimas do are de superfície na região do norte do Rio Grande do Sul. Revista Brasileira de Agrometeorologia, v.16, p.1-8, 2008.
Lensky, I. M.; Dayan, U. Detection of finescale climatic features from satellites and implications for agricultural planning. Bulletin of the American Meteorological Society, v.92, p.1131-1136, 2011. http:// dx.doi.org/10.1175/2011BAMS3160.1
Lopes, P. M. O.; Adami, M.; Pereira, E. B.; Moura, G. B. de A.; Moreira, M. A. Estimativa de temperaturas absolutas usando dados climáticos e orbitais sobre o território brasileiro. Revista Caatinga, v.24, p.120-127, 2011.
Meneses, P. R.; Almeida, T. de. Introdução ao processamento de imagens de sensoriamento remoto. 1.ed. Brasília: UnB/CNPq, 2012. 266p.
Mezzomo, D.; Diniz, G. B.; Silva, J. B. Análise espectral da temperatura mínima média em dois trimestres numa região homogênea do Rio Grande do Sul. Revista Brasileira de Agrometeorologia, v.15, p.121-132, 2007.
Müller, G. V.; Ambrizzi, T.; Núñez, M. N. Mean atmospheric circulation leading to generalized frosts in Central Southern South America. Theoretical and Applied Climatology, v.82, p.95-112, 2005. http:// dx.doi.org/10.1007/s00704-004-0107-y
NASA - National Aeronautics and Space Administration. https:// lpdaac.usgs.gov/dataset_discovery/modis/modis_products_table/ myd11a1. 16 Jul. 2013.
Nimer, E. Climatologia do Brasil. Rio de Janeiro: SUPREN/IBGE, 1979. 421p.
Oliveira, H. T. Climatologia das temperaturas mínimas e probabilidade de ocorrência de geada no Estado do Rio Grande do Sul. Porto Alegre: PPG Fitotecnia/UFRGS, 1997. 81p. Dissertação Mestrado Pezza, A. B.; Ambrizzi, T. Dynamical conditions and synoptic tracks
associated with different types of cold surge over tropical South America. International Journal of Climatology, v.25, p.215-241, 2005. http://dx.doi.org/10.1002/joc.1080
Pouteau, R.; Rambal, S.; Ratte, J. P.; Gogé, F.; Joffre, R.; Winkel, T. Downscaling MODIS-derived maps using GIS and boosted regression trees: The case of frost occurrence over the arid Andean highlands of Bolivia. Remote Sensing of Environment, v. 115, Issue 1, p.117-129, 2011. http://dx.doi.org/10.1016/j.rse.2010.08.011 Reis Júnior, D. S. Aplicações da meteorologia na economia. Boletim da
Sociedade Brasileira de Meteorologia, v.30, p.18-20, 2006. Roberti, D. R.; Avila, D. C. de; Fagundes, L. A.; Zimmermann, H. R.
Comportamento do fluxo de energia em eventos de geada. Revista Ciência e Natura, Edição Especial, p.193-195, 2013.
Sentelhas, P. C.; Ortolani, A. A.; Pezzopane, J. R. M. Estimativa da temperatura mínima de relva e da diferença de temperatura entre o abrigo e a relva em noites de geada. Bragantia, v.54, p.437-445, 1995. http://dx.doi.org/10.1590/S0006-87051995000200023 Varejão-Silva, M. A. Meteorologia e climatologia. Recife: Versão digital