Luísa Rodrigues Palma Rato Palmeira
Licenciatura em Ciências de Engenharia Biomédica
Scenario Planning and Multicriteria Analysis in
the acquisition of a sophisticated medical
equipment:
The Case of Instituto Português de
Oncologia
Dissertação para obtenção do Grau de Mestre em Engenharia Biomédica
Orientador: Prof. Doutor Luís Velez Lapão
Instituto de Higiene em Medicina Tropical
Juri:
Presidente: Doutora Carla Maria Quintão Pereira
Arguente: Doutora Maria Isabel Azevedo Rodrigues Gomes
Scenario Planning and Multicriteria Analysis in the acquisition of a sophisticated medical equipment: The Case of Instituto Português de Oncologia
Copyright © Luísa Rodrigues Palma Rato Palmeira, Faculdade de Ciências e Tecnologia, Universidade Nova de Lisboa.
“Start by doing what’s necessary; then do what’s possible; and suddenly you are doing
the impossible”
Acknowledgements
This work represents the end of a very important and defining part of my life. I would like to first thank my advisor, Professor Luís Lapão, for giving me the opportunity to work on this project, and for all his support and guidance.
I would also like to thank Dr. Miguel Lemos, from Instituto Português de Oncologia, for allowing me to partake in this project, for his support, and for his availability and patience, which without would have made my work very difficult, if not impossible.
A special thanks to my family who always tried to support me, and encouraged me to follow my dreams. Thank you for believing in me when I did not, and for listening even
when you didn’t understand what I was talking about.
To Cláudia & Carolina, the best friends a girl can have. We have been together for half our lives, and I cannot wait to see what the future holds for us. I know that wherever we are in the world, we will always be friends, and that no one will make me laugh as hard as you. Thank you for always listening to me, even when I complain non-stop. I
promise I’ll return the favour when it’s your turn!
viii
giving a new meaning to friendship, and for becoming a second family. University was just the beginning; now let’s enjoy the rest of our lives!
To my new friends in my new Master, thank you for always encouraging me and making me laugh.
Last, but not least, I would also like to thank Professor Carmo Lança, Professor Jorge Silva and Professor João Borges. Unfortunately, it was a project that did not work, but that I hold dear, and hope to see it accomplished in the near future.
Abstract
Healthcare management is a process that is becoming more and more challenging. Due to constant changes, either economic, political, social or others, the healthcare industry suffers certain uncertainties in their services. One of the challenges is the increase in costs of medical equipment, which is also associated with a fast evolution of technology and lack of good practices of procurement. Being one of the most valuable sources for any company, technology is especially important in healthcare, since it helps to improve the diagnostic and quality of the service provided. But, with the current economic crisis, hospitals are suffering budget cuts, affecting the options available in terms of technology. Hence, the job of healthcare managers is becoming more difficult, but also increasing in importance, since a good decision in necessary to please both customer, and employer. In this work, the case of Instituto Português de Oncologia de Lisboa will be analysed, where the decision to either acquire, or not, a new computerized axial tomography is being considered. Scenario Planning and the Multicriteria Decision Analysis were the methodology implemented. It was concluded that the best option for IPO is to replace their old computerized axial tomography by a new one, with a leasing contract, instead of direct acquisition.
Resumo
A gestão hospitalar é um processo que se está a tornar cada vez mais desafiante. Devido a mudanças constantes, quer de carácter económico, político, social, ou outro, o sector da saúde sofre várias incertezas nos seus serviços. Um dos desafios deve-se ao constante aumento dos custos relacionados com equipamento médico, que estão também associados a uma rápida evolução em termos de tecnologia. Sendo um dos mais importantes recursos de uma empresa, a tecnologia é especialmente importante quando se fala do sector da saúde, já que ajuda a melhorar o diagnóstico e a qualidade do serviço proporcionado. No entanto, com a atual crise económica, os centros hospitalares estão a sofrer cortes nos seus orçamentos, afectando assim as opções disponíveis em termos de tecnologia. Pode-se dizer assim que o trabalho do gestor de saúde torna-se cada vez mais difícil, mas também cada vez mais importante, já que é crucial tomar uma boa decisão, tanto para agradar o cliente ou paciente, e a própria gestão do hospital. Nesta dissertação, o caso de estudo do Instituto Português de Oncologia vai ser analizado, para se tomar a decisão de adquirir, ou não, um novo equipamentos de tomografia axial computorizada. A análise de cenários e a análise multicritério foram as metodologias escolhidas para aplicar a este caso. Concluiu-se que o IPO deve substituir a sua TAC antiga, por uma nova em contrato de leasing, em vez de aquisição directa.
List of Contents
1. Introduction ... 1
1.1 Objectives ... 2
1.2 Dissertation Overview ... 3
2. Background ... 5
2.1 Portugal and IPO-L ... 5
2.2 X-Ray computed tomography ... 6
2.3 The methodology ... 10
3. Methods ... 13
3.1 Scenario Planning and MCDA ... 13
3.2 Scenario Planning ... 15
3.3 Multicriteria Analysis ... 18
4. Development of the Methodology ... 25
4.1 The identification of the problem ... 25
4.2 Scenario planning... 26
4.3 MCDA Evaluation ... 35
5. Results and Discussion ... 47
6. Conclusion ... 51
List of Figures
Figure 2.1: Population areas covered by IPO-L [4] ... 6
Figure 2.2: CAT Scan [6] ... 7
Figure 2.3: Evolution of CT scanners [5] ... 8
Figure 2.4: Cranial CT evolution: 1974 (left) VS 1983 (right) [11] ... 9
Figure 2.5: A dual energy scan with the SOMATOM Definition Edge, University of Eriagen Nuremberg, 2014[11] ... 9
Figure 4.1:6Trends Diagram ... 32
Figure 4.2:8Scenarios Matrix ... 34
Figure 4.3:9Choice hierarchy composition ... 39
List of Tables
Table 4.1: TC Exams performed at IPO-L ... 26
Table 4.2: Major Stakeholders of the problem ... 27
Table 4.3: Social Trends... 28
Table 4.4: Technological trends ... 29
Table 4.5: Economical trends ... 30
Table 4.6: Environmental trends ... 30
Table 4.7: Political trends ... 31
Table 4.8: Key uncertainties ... 32
Table 4.9: Criteria used in MCDA ... 35
Table 4.10: Alternatives to the problem ... 36
Table 4.11: Cost Analysis for Alternative 1... 36
Table 4.12: Cost Analysis for Alternative 2... 37
Table 4.13: Cost analysis for Alternative 3 - a) ... 37
Table 4.14: Cost analysis for Alternative 3 - b) ... 37
Table 4.15: PV of the different alternatives ... 37
Table 4.16: Technical Specifications of CAT Scanners ... 38
Table 4.17: Pairwise Comparison Table [24], [37] ... 40
Table 4.18: Scale for pairwise comparison [24] ... 40
Table 4.19: Pairwise Comparison Matrix for the criteria ... 40
Table 4.20: Normalized Scores of the Criteria ... 41
Table 4.21: Consistency Analysis of the Criteria ... 41
Table 4.22: Random Index ... 42
Table 4.23: Pairwise Comparison Matrix for the Alternatives regarding Costs ... 43
Table 4.24: Normalized Scores of the Alternatives regarding Costs ... 43
Table 4.25: Consistency Analysis of the Alternatives regarding Costs ... 43
Table 4.26: Pairwise Comparison Matrix for the Alternatives regarding Quality ... 43
Table 4.27: Normalized Scores of the Alternatives regarding Quality... 44
Table 4.28: Consistency Analysis of the Alternatives regarding Quality ... 44
Table 4.29: Pairwise Comparison Matrix for the Alternatives regarding Organizational Impact ... 44
Table 4.30: Normalized Scores of the Alternatives regarding Organizational Impact ... 45
Table 4.31: Consistency Analysis of the Alternatives regarding Organizational Impact ... 45
Table 4.32: Pairwise Comparison Matrix for the Alternatives regarding Operational Risk ... 45
Table 4.33: Normalized Scores of the Alternatives regarding Operational Risk ... 45
Table 4.34: Consistency Analysis of the Alternatives regarding Operational Risk ... 46
Table 4.35: Relation between the different Alternatives and Criteria ... 46
xviii
Acronyms and Abbreviations
IPO-L Instituto Português de Oncologia de Lisboa Francisco Gentil E.P.E. CAT Scan Computerized Axial Tomography Scan
SP Scenario Planning
MCDA Multicriteria Decision Analysis CT Computed Tomography
DMs Decision Makers
MODM Multiple Objective Decision Making MADM Multi-Attribute Decision Making
ELECTRE Elimination and Choice Translating Reality
PROMETHEE Preference Ranking Organization Method for Enrichment Evaluation AHP Analytical Hierarchy Process
PC Pairwise Comparison
TOPSIS Technique for order preference by similarity to ideal solutions PV Present Value
1.
Introduction
Healthcare management is an areathat is becoming more and more challenging. Due to constant changes in its processes, either economic, political, social, or others, the healthcare industry suffers certain uncertainties in their services.
Also, managers of healthcare institutions, like hospitals, have the difficult task of having to implement a long-term strategy, but having to focus on their short-term performance. This means that managers should have the ability to answer to opportunities of change that arise from day to day, in order to align their services with the changing environment [1].
Another challenge is that healthcare costs keep increasing due to the cost rise of medical equipment and complexity of care. This also includes their maintenance and accountability within the healthcare organization [2]. It is very difficult to keep track of all medical equipment, but it is also very important, since it is necessary for inventory
and in order to maintain it and make sure it doesn’t need repair or substitution. Since
most equipment is now mobile, and doesn’t necessarily belong to one department, it
becomes increasingly difficult to keep track of each equipment, and to understand either it is needed an upgrade or in higher number [2].
2
healthcare organizations, like hospitals, need them in order to improve their performance and quality of service provided.
Thus, besides the basic healthcare management, managers also need to take into account technology management, since it will have a large impact in their overall management.
Besides these facts, organizations need to be able to forecast new and emerging technologies. The problem is that the development of new technologies comes with an increase in cost, and with the recent economic crisis and budget cuts, healthcare organizations need more affordable options. By forecasting technology’s acquisitions according to their needs, healthcare organizations can help to reduce their long-term costs, while at the same time increasing the quality of the services they provide.
Overall, in order to work efficiently, healthcare institutions need to have the ability to analyse how the services they provide are aligned with their demand, and measure their effectiveness and results, while making an efficient use of all their resources[3].
1.1Objectives
This work is part of a pre-analysis project research in order to decide the optimal choice in the acquisition of medical technology for Instituto Português de Oncologia de Lisboa Francisco Gentil E.P.E. (IPO-L).
The case will be conducted on the possible acquisition of a Computerized Axial Tomography Scan (CAT Scan). The main objectives of this project are:
Decide if IPO-L should retain the old CAT Scan, or acquire a new one;
In case of a new acquisition, decide to:
o Either do a direct acquisition or to sign a leasing contract
order to find the best option for the healthcare institution in question.
1.2Dissertation Overview
This dissertation is organized in six main chapters, with the first one being this introduction. The remainder of this dissertation is organised as follows:
Chapter 2: Background Chapter 3: Methods
Chapter 4: Development of the Methodology Chapter 5: Results/Discussion
2.
Background
In this chapter the background information necessary to understand this work is addressed. In section 2.1, the context and background of IPO-L is discussed, followed by a small explanation of the TAC Scan in section 2.2. Sections 2.3 and 2.4 introduce the methods that will be used in this to develop this thesis.
2.1Portugal and IPO-L
Instituto Português de Oncologia de Lisboa Francisco Gentil E.P.E. is an oncologic centre located in Lisbon that was founded in 1923 by Professor Francisco Gentil. It has as a main goal to fight against cancer and oncologic diseases, by practising medicine through 3 main pillars – care, teach, and research – in order to help the oncologic patient [4].
IPO-L attends to the following regions: Lisboa e Vale do Tejo, Alentejo, Algarve, and the islands of Açores and Madeira (Figure 2.1). Overall, IPO-L serves a population of about 4 million habitants. Although the majority of the patients come from those regions, it does not mean that IPO-L won’t treat patients from other areas [4].
6
beds for patients’ admission, plus a nursing home with 178 beds for ambulatory patients and their caregivers [4].
Figure 2.1: Population areas covered by IPO-L [4]
2.2X-Ray computed tomography
CT scan, X-Ray Computed Tomography or Computerized Axial Tomography Scan (CAT scan) (Figure 2.2) is a diagnostic technique that uses x-rays in a non-invasive way. The CAT scan provides doctors with information about the structure and anatomy
Figure 2.2: CAT Scan [6]
The CT uses X-ray to obtain data from several segments of the body, which are afterwards treated in a computer and transformed in images of body sections, in a transversal plane [7]–[9]. The CT is extremely useful since different parts of the body absorb the x-rays in different ways, making it easy to observe an anomaly. For example, since bone absorbs x-rays well, and better than tissues for most levels of radiation, in the image it will appear white. On the contrary, air does not absorb well x-rays, thus lungs, for example, are dark. Other tissues, like muscle, or even blood have different absorption levels to x-rays, and normally appear in shades of grey. Thus, when a patient has a tumour or a blood clot, this area appears in a different shading that the circulating tissue, making it easy for doctors to detect it [9]. That is the case of oncologic patients.
Over the years, there has been a big evolution in the field of CT scanners (Figure 2.3).
The first CT scanner was installed in September 1971, at the Atkinson Morley’s
8
resolution [5], [10]. Until the 90’s, the detectors and thus the CT scanners were acquired in a transaxial direction, while nowadays they are done axially, with manufacturers building the detectors in rows, in order to be able to scan several slices for each rotation [5].
Figure 2.3: Evolution of CT scanners [5]
instead in reducing the dose of radiation received by patients, and the costs related with this industry [5].
Figure 2.4: Cranial CT evolution: 1974 (left) VS 1983 (right) [11]
Nowadays, CT scans are able to the acquisition in hundred milliseconds, with an image of 2048 x 2048 pixels [10], which allows doctors to obtain images with much more quality, as seen in Figure 2.5.
Figure 2.5: A dual energy scan with the SOMATOM Definition Edge, University of Eriagen Nuremberg, 2014[11]
10 2.3The methodology
According to Lacerda [12], the methodology framework of a research must not be understood as a bureaucratic act. Instead, it consists in choosing and justifying a method of research that allows:
i) To answer to the problem of research;
ii) To be evaluated by the scientific community;
iii) To point out procedures that strengthen the results of the research.
These steps should be seen as necessary procedures to assure impartiality, rigor and reliability of the results.
In this work we will use the Design Science Research methodology, which has as a main goal to study, research and investigate the artificial (phenomena created by man), and its behaviour. This way, Design Science Research consists in a rigorous process of projecting artefacts in order to solve problems, evaluate what has been estimated or what is functioning, and to communicate the obtained results [12], [13]. This methodology has been previously used in healthcare with success [14].
Every scientific methodology is defined by a group of rules and procedures, upon which research is based. The design research methodology is based on the following six steps [12], [13]:
(i) Problem identification.
The research has to demonstrate knowledge of the current state of the art and the relevance of the identified problem
(ii) Definition of the objectives for a solution.
Gather the objectives of the solution for the problem in question and acknowledge what is possible.
(iii) Design and development.
Creation of artefacts (model of evaluation) (iv) Demonstration.
(v) Evaluation.
Observe and measure how well the artefacts support the solution to the problem.
(vi) Communication.
Communication of the new knowledge obtained by the research in terms of dissertations or journal articles.
According to Herbert Simon [15], an artefact is the organization of the components of an internal environment that attain certain objectives in a determined external environment. Thus, they can be models, methods, or instances [12].
3.
Methods
3.1Scenario Planning and MCDA
Life is about choices. Every day people are faced with numerous questions and tasks that force them to make a decision. Most of these decisions imply a simple yes or no answer, or an easy choice to make. What colour should I wear today? Do I want coffee? Or tea? And so on and so on.
Sometimes it is not as simple to formulate an answer or come up with a solution to a certain problem. This is something that happens frequently in management, where there are multiple objectives or alternatives that can sometimes be contradictory. These alternatives normally have to be selected based on more than one criterion [16].
With the increase of available information, it is not strange to observe a rising number of alternatives and criteria, that the Decision Makers (DMs) need to select, sort and classify, which means that making a decision might become a complex problem, and therefore take some time and effort [17].
14
already it is felt a strong pressure for more efficient healthcare systems. Governments and healthcare providers all over the world are looking for ways to cope with booming healthcare costs, that occur at the same time of cuts in governmental budgets [18].
The assessment of healthcare interventions is a very challenging task: from the investment and authorization, to the reimbursement and prescription, all facts must be taken into consideration. The different effects, either beneficial or not, and the fact that these effects might have greater value in a certain disease, or in one where there is no treatment, are also elements to take into consideration when making the evaluation of a healthcare intervention [19].
Also, uncertainty is one of the emerging constants in the modern world. The world is growing more complex. In fact, our social systems are growing so complex that they are beginning to defy understanding. In result, our systems of problem solving also become more complex [20]. However complexity also means higher resilience.
Nowadays, there is a relentless pressure on costs in all public decision making. We have entered a world where irreversible consequences, unlimited in time and space are now possible, and where the implications of solutions being formulated may take decades to be understood [20].
Besides pressure on costs, public perception is becoming more and more important. When it comes to uncertainties and risks, acceptability depends on whether those who bear the losses also receive the benefits. When this is not the case, the situation is often considered unacceptable. As a result, possibility is often accorded the same significance as existence in a stakeholder’s view [20].
But with the changing world, responsibility has also become less clear. Questions like
“Who has to prove what? Who is responsible morally? And who is responsible for
paying the costs?” are becoming the plague of planners, making many public decisions
subjective in nature [20].
- Risk analysis;
- MCDA;
- Planning frameworks that are realistic and useful, like scenario planning;
3.2Scenario Planning
Traditional planning processes are generally deterministic in practice, and rely on a forecast of a single most likely alternative future, that is usually attached to the present. While this was an acceptable practice in the past, when change was not as rapid and the social context was not as complex, nowadays we cannot rely on that since dependence on a single forecast might translate into an adversarial decision process because there are always legitimate differences in views of an uncertain future [20].
If there is little uncertainty and the consequences of being wrong are minor, any decision making method will do. But when uncertainty is high and the consequences of being wrong are grave, then we must consider other options like scenario planning, as it is an effective tool for strategic decision making under uncertainty [20].
This method is able to capture a whole range of possibilities in rich detail if properly applied [21]. A manager can build a series of scenarios to help to compensate for the usual errors in decision making, by identifying basic trends and uncertainties [22]. By expanding their imagination to a wider range of possible futures, managers can take advantage of the unexpected opportunities that come along [14], [22].
Scenario planning is a method that imagines possible futures that can be applied to a great range of issues [22]. Developed in the latter part of the 20th century in order to deal with the uncertainty that confronts modern decision makers, scenario planning is not forecasting and does not predict the future [14], [20].
16
and modernizing the use of scenario planning for strategic planning in the early 1970s [20],[22].
As said before scenario planning is not forecasting. In fact, this method is rooted in the suggestion that all forecasts are wrong. We can say that scenarios are plausible descriptions, but not predictions, of a future that an organization should be aware of, in order to adapt their strategic development [18].
Thus, scenario planning aims to build stories for the future that can contribute to the better understanding of the external environment in which an organization is operating and to support strategic decisions and anticipate difficulties [14], [20]. If one finds the meaning of the words, it will find that “Scenario” literally means an outline or synopsis of a play [20].
A strategic decision is defined as “a decision that forces the organization to ponder its very existence, independence, mission, and main field of activity” [18]. And each
scenario is regarded as a “strategic case”[14].
In a nutshell, scenario planning tries to capture all possibilities, by stimulating decision makers to consider changes they would not consider before [22].
The uncertainties are addressed by defining different scenarios for each relevant future state of the world. One can define scenarios as: “Developed by blending data and analysis with intuition and creativity, scenario plots must ‘hang together’ like a well -crafted novel, stretch the imagination without going outside the bounds of believability, and consistently address issues that are critical to decision makers” [20].
Each scenario is described in a narrative story style, with memorable names so that DMs can understand and identify how the different possible futures could end up in if managers ignore and disregard them. The narrative should be clear and concise, to help DMs and stakeholders to understand that particular future [20].
In traditional planning processes, only one of the four futures is identified as the most likely and then all resource management options would be evaluated against it. On the contrary, scenario planning considers all the options. Rather than choosing the plan that performs best if only one future state of the world is recognized, it is the plan that performs best across all futures that is considered the best plan [20]. In traditional planning, if the future turns out different than the most likely forecast the efficacy of the management options is compromised. With scenario planning this does not happen, as the plan chosen is the one with the best overall performance against all scenarios [20].
Although scenario planning can be used to make any type of decision, this method is more valuable when applied to corporate strategic planning [22].
Schoemaker [22] believes the two more common mistakes in decision making are underprediction and overprediction of a certain change. He believes that scenario planning offers a common ground between these two possibilities, as it help us to expand the array of possibilities that we can see, while not letting us enter the world of science fiction.
18
nothing is set in stone, but not everything can be under uncertainty, or it would not be able to move forward. The challenge is to separate the components we are confident about from those that are largely uncertain [22].
The purpose of scenario planning is not to cover all possibilities, but to restrict them. No one wants to account for all the possible outcomes of each uncertainty, therefore the goal is to simplify them [22].
For that Schoemaker [22] proposes a 10-step process to develop scenarios:
1. Define the scope – The first step is to set the time frame and scope of the analysis;
2. Identify the major stakeholders – Define who will have an interest in the decision being made, and who will be affected by it;
3. Identify Basic trends – Define which trends will affect the problem (political, economic, social, technological, legal);
4. Identify key uncertainties – The uncertainties should also be divided in the categories: political, economic, social, technological, legal;
5. Construct Initial scenario themes – Build an initial scenario;
6. Check for consistency and plausibility – Check if the trends are compatible with the chosen frame, and if scenarios combine outcomes of uncertainties that go together;
7. Develop Learning scenarios –Name the scenarios;
8. Identify research needs – See if further research should be made; 9. Develop quantitative models – Analyse the scenarios again; 10.Evolve towards decision models – Build the final scenarios;
In a nutshell, the scenarios must cover a wide array of possibilities and highlight competing perspectives, while keeping focus on the interlinkages and internal logic of each future.
Multi-Criteria Decision Analysis can be useful to support the evaluation of the scenarios [20]. MCDA consists of a group of methods that work as a tool to help DMs sort problems with conflicting objectives or multiple criteria [17]. These methods use a structured and logical approaches to resolve the problem in question, by comparing different alternatives [16], [23]. In order to do this, it is necessary to weight in each criterion, and normalize/scale them, so that they can be ordered and evaluated for each alternative [24], [25].
We can say that Multiple Criteria Analysis is very useful for analysing these types of problems, due to several reasons [26].
1. We can use multiple criteria; 2. Mixed data can be used; 3. Everyone can be involved;
4. MCDA has feedback mechanisms to analyse the consistency;
Besides these factors, MCDA is especially useful because we can separate the decision elements and track down the decision-making process, making it easier to communicate and explain the decisions made.[26]
“In an uncertain world the responsible decision maker must balance judgements about uncertainties with his or her preferences for possible consequences or outcomes.” [27]. The process of MCDA can be divided in 5 steps: [27]
1. Pre-analysis – The problem is identified and the alternatives are selected;
2. Structural analysis – The problem is structured in a qualitative way, that is organized in a decision tree;
3. Uncertainty analysis – Probabilities are assigned ;
4. Utility or value analysis – Utility values are assigned to the consequences associated with paths through the tree. The decision maker must assign numbers
to consequences (such as u’ito C’i and u”jto C”j) in such a manner that he feels
that
(𝑎′𝑖𝑠 𝑝𝑟𝑒𝑓𝑒𝑟𝑟𝑒𝑑 𝑡𝑜 𝑎") ↔ (∑ 𝑝 𝑖 ′𝑢
𝑖′ 𝑚
𝑖=1
> ∑ 𝑝𝑗′′𝑢𝑗′′ 𝑛
𝑗=1
20
5. Optimization analysis – The decision maker calculates his optimal strategy;
At each tip of the tree there is a consequence C that describes the impact of that position. The decision maker is called on not only to rank the consequences at the tips of the tree but also to evaluate the strengths of his preferences and his attitudes toward risk [27].
It is likely that objectives will conflict with each other in that the improvement achievement with one objective can only be accomplished at the expense of another. An
objective generally indicates the “direction” in which we should strive to do better [27].
To be useful to the decision maker, a criterion should be both comprehensive and measurable. A criterion is comprehensive if, by knowing its level in a particular situation, the DM has a clear understanding of the extent that the associated objective is achieved. A criterion is measurable if it is reasonable to obtain a probability distribution
for each alternative and to assess the decision maker’s preferences for different possible levels of the criterion [27]. A comprehensive criterion should be relevant to the alternative under consideration. In many cases, choosing a criterion will not be difficult if the objective is clear [27].
Let’s assume a MCDA problem with m alternatives and n decision criteria [28]. The weights reflect the relative importance of each decision criterion, and these are usually normalized by making their sum equal to 1 (∑𝑛𝑗=1𝑤𝑗 = 1). Given the specific performance value 𝑎𝑗,𝑘 of each alternative k (k=1,2,…,m) in terms of each criterion j
(j=1,2,…,n), the overall performance of each alternative k can be calculated as follows [29]:
𝑃𝑘 = ∑ 𝑤𝑗𝑎𝑗,𝑘 𝑛
𝑗=1
, 𝑘 = 1,2, … , 𝑚
We assume that input can be obtained from several individuals, where each individual i
Before starting to consider approaches, it is necessary to have input from the stakeholders. This means collecting information about the problem, and the different alternatives, and criteria [26]
Multi-Criteria Decision Analysis can be divided into two groups: Multiple Objective Decision Making (MODM) and Multi-Attribute Decision Making (MADM) [16], [30]. Depending on the number of DMs, methods can be classified as single or group decision making methods [25], [30].
If there is a defined number of alternatives, then MADM is used. If on the contrary, there is an infinite number of alternatives, MODM is used. In MODM, the conflicting objectives are optimized and subjected to a group of defined constraints, by a mathematical programming model [16].
In this study, we will use MADM methods. MADM prioritizes alternatives in order to make a decision. Since each alternative is characterized by multiple attributes/criteria, these are evaluated and ordered by each method [16].
Since it first started being used in the 1950s, MADM methods have been developed by several researchers, which resulted in methodologies based on different approaches. If considering the attribute information processing, there is non-compensatory and compensatory processing models. The first ones do not allow trade-offs between attributes, meaning that a disadvantage in one attribute, cannot atone for an advantage another attribute. This means that comparisons have to be made attribute-by-attribute. Compensatory models allow trade-offs. Although these models might be more demanding in a cognitive way, they provide solutions that are closer to the optimal outcome [16].
22
reality method, and 2) PROMETHEE – the preference ranking organization method for enrichment evaluation method [16], [23]
The ELECTRE was first mentioned in 1966 by Benayoun, Roy and Sussman. The ELECTRE classify preferred alternatives and non-preferred ones by establishing outranking relationships, and using concordance and discordance indices and threshold values to analyse the outranking relations among the alternatives [16], [23], [31]. It can analyse quantitative and qualitative data [30].
PROMETHEE was developed by Brans in 1982. Although it also uses the outranking principle, PROMETHEE is easier to use and less complex. It is suited for problems with a finite number of alternatives that are to be ranked with respect to several conflicting criteria. We can classify six criteria functions: usual criterion, quasi criterion, criterion with linear preference, level criterion, criterion with linear preference and indifference area, and a Gaussian criterion[16], [23].
Other methods can also be used that have their own mathematical foundation, or are based on an utility function. This means that these methods synthesize all information into a unique parameter. Some call these the Performance Aggregation based approaches[23].
One of these methods is AHP – Analytical Hierarchy Process, proposed by Saaty in 1976. AHP converts subjective assessments of relative importance to a group of scores or weights. It is considered a quantitative comparison method, because it selects the preferred alternative by using pairwise comparisons of the alternatives based on their relative performance against each criterion. This results in an arrangement of the important components of the problem organized in a hierarchically structure, like a family tree, which makes it easier to capture the preferences of the DMs [16], [23], [26].
and can be analysed for consistency, through a consistency index, that indicates where there is a great inconsistency among the responses, making the analysis more reliable and accurate [26].
The TOPSIS – Technique for order preference by similarity to ideal solutions is also a method which has its own mathematical basis. It was developed in 1981, by Hwang and Yoon, and it is a utility-based compensatory approach, that uses distance-based to quantify and compare the preferences of the alternatives over the set of attributes. The algorithm used by TOPSIS rank the alternatives in a straightforward way, that can be pictured in a graph. This is a MADM method usually used when dealing with information on a cardinal scale [16].
These are just a few methods of MCDA. Each one has stronger and weaker factors, which include: Type of data, weights typology, threshold values, compensation degree, uncertainty and sensitivity analysis, robustness, and software support [23].
Data can be either quantitative or qualitative. If it is qualitative, the information is reduced to point scales. This is one of the advantages of MCDA methods, since it
doesn’t apply restrictions to the type of data being analysed [23].
Weights typology can be distinguished between coefficients of importance and trade-offs. If the weights are considered trade-offs, meaning that they can be accepted among the criteria, this will have implications in the aggregation procedure, since the scaling of criteria and the weights are now connected and dependent on each other, therefore when one changes, the other has to follow accordingly. If we consider the weights as importance coefficients, it means they indicate the voting power of the criterion, thus contributing to the building of the outranking relation. Importance coefficients are independent from the measurement scale of the criteria, and are representative of non-compensatory methods [23].
24
a unique value that implies full compensation among them means that a bad performance in some criteria can be offset by a good performance in others [23].
Uncertainty is usually used in two occasions: 1) when weighting the criteria, and 2) when assessing the performance of the alternatives. The sensitivity analysis helps us to distinct the treatment of uncertainty at the input and at the output stage. If using the AHP methods, we can use the inconsistency index to indirectly measure the uncertainty of the weighting of the criteria. The sensitivity analysis is applied on criteria weights at the output stage [23].
4.
Development of the Methodology
This chapter presents the methodology followed in this dissertation. Firstly, in section 4.1, the identification of the problem is presented, as well as the possible solutions. Then, in section 4.2, the scenario planning analysis is implemented, followed by the multicriteria analysis in section 4.3.
4.1The identification of the problem
Instituto Português de Oncologia de Lisboa currently holds two CAT scanners in their inventory, both of 16 slices. One of the two equipments, acquired in January 2009, will end its life span on 31st December 2016. This means that after this date the manufacturer will not be able to assure the replacement of the machine’s parts. If the hospital decides to keep this machine, then they face two scenarios:
1) the machine has no problems and there is no need for substitution of its parts, or
26
problem, and that the manufacturer no longer has the component needed to replace.
This equipment is of extreme importance to the hospital, since both machines perform over 35.000 exams a year (Table 4.1), i.e around 100 exams per day. Each exam that the hospital cannot perform in its facilities and needs to be done in another hospital has the
cost of 42,5€.
Table 4.1: TC Exams performed at IPO-L
IPO-L Quantity Variation
Exam 2015 2014 Δ (%)
TC Scan (2) 37.664,00 38.747,00 -1.083,00 -2,80
IPO-L’s decision makers now face three options:
1) Keep the old machine, with the increase risk of failure in the near future 2) Or acquire a new CAT scanner, either by:
a. Direct acquisition b. Leasing contract
If the Hospital decides to acquire a new CAT scanner, then it will be a scanner of 128 slices. The hospital chose the 128 slices scanner as the model to replace since it will provide a better quality in image, and therefore a better diagnostic, as well as producing a lower dose of radiation for the patient.
4.2Scenario planning
The first part of the analysis is based on scenario planning methodology, as to better understand the environment in which IPO-L is operating.
To understand how each scenario will play out, and who, and how it will affect, we must identify and define the major stakeholders in the situation.
According to the Agency for Healthcare Research and Quality, stakeholders are defined
as “persons or groups that have a vested interest in a clinical decision and the evidence that supports that decision” [32]. Thus, it can be said that a stakeholder is any person or party who provides, receives, manages or pays for healthcare. For this work, the stakeholders were organized in 4 main groups: Providers, Payers, Employers, and Patients, as seen in Table 4.2 [19].
Table 4.2: Major Stakeholders of the problem
Providers
Includes doctors, nurses, etc. Their main focus in the accuracy of the diagnostic, in order to recommend an appropriate therapy, which can then result in the optimal health result. They want to do the best examination with the most accurate and advanced treatment possible. For them, this should always be the case, even
if the patient’s care provider does not cover the treatment payment.
Payers
Focus on cost-effectiveness. For them it is necessary to have a clear and accurate diagnostic, with the minimum amount of tests and treatments. Can be insurers, health care institutions and policymakers.
Employers
Their main goal is to minimize costs and optimize the service of employees and machines. They want to keep their costs at the minimum value possible, and for patients to only seek them when care is needed. They also want for patients to follow their instructions, in order to recover quickly and reduce the possibility of a relapse in the future. Patients should make the effort to reduce the risk of health problems – no smoking, no fast food, exercise regularly.
Patients
Want skilled workforce, associated with compassion, clear communication, and prompt service. They want a wide offer of solutions, and want the employer or their care provider (insurance) to fund the majority, or the totality, of the treatment.
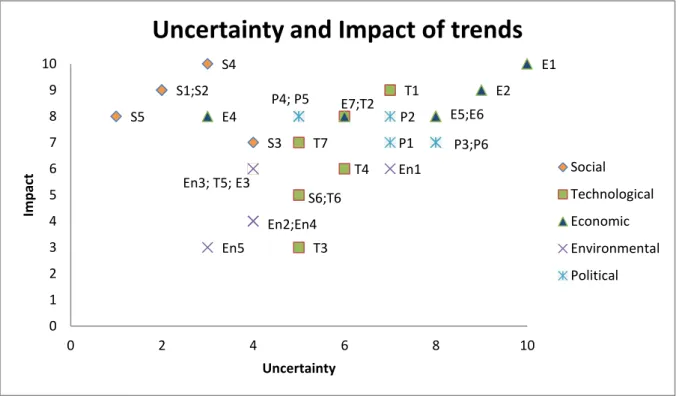
It is important to acknowledge that uncertainty is present in any firm’s life and that manager’s make a huge effort to minimize the risks associated to it. In order to gain an
28
highest impact and the highest uncertainty in terms of direction and speed of evolution were selected.
The STEEP analysis is done by focusing on the driving forces or trends, which are the fundamental sources of future change. The trends can be divided into 5 groups: Social, Technological, Economic, Environmental, and Political. By identifying these trends, it is possible to enhance the ability to imagine future scenarios and understanding future events. We can also classify their impact to IPO-L in terms of positive or negative, depending if they bring opportunities or challenges, respectively.
Social trends (Table 4.3) can affect the demand for a company’s product, and how the company operates.
Table 4.3: Social Trends
Social
Trend Description Impact
𝑺𝟏– Ageing population
An ageing population has greater needs for medical treatment, meaning the long term prospects for healthcare facilities are good. More demand for services for the aged.
Positive
𝑺𝟐 – Age distribution
Being an expert hospital in oncology, means that the hospital must have a business model that will suit the young, the adults and the ageing population. Caring for everyone regardless of age is an initiative that will give the hospital a positive image and improve business.
Positive
𝑺𝟑– Health
Consciousness
Everyone wants to stay healthy and have a reasonable standard of living.
Positive
𝑺𝟒– Cancer
The hospitals will have more customers subscribing for medical care. In this case customer retention will also be high since oncologic patients are obliged to do several check-ups.
Positive
𝑺𝟓– Connectivity &
Internet
Internet is now a major part of people’s lives,
and the way in which business operate. This means that the hospital has new ways to keep in touch with patients, and thus improving their communication.
Positive
𝑺𝟔– Patient awareness,
changing expectations
More pressure on customer service, increased need for education and more price transparency
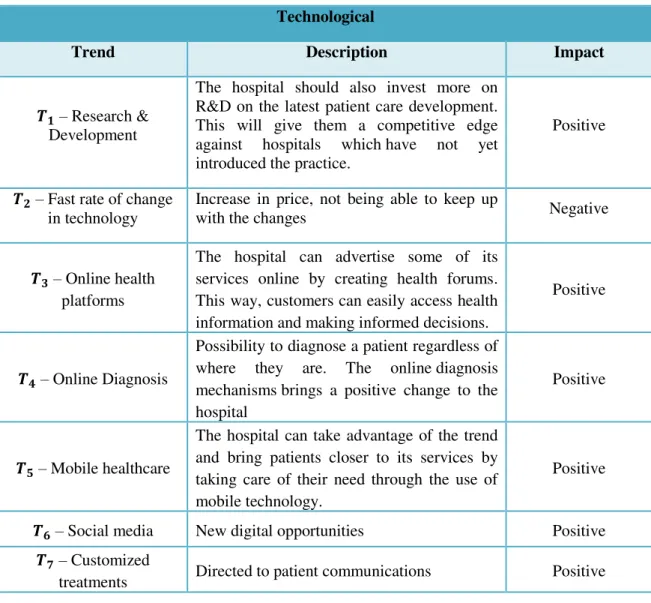
Technological trends (Table 4.4) do not necessarily involve technical equipment, and can be new approaches to problems and new ways of thinking. They can determine barriers to entry, and affect the efficiency, costs and quality.
Table 4.4: Technological trends
Technological
Trend Description Impact
𝑻𝟏– Research &
Development
The hospital should also invest more on R&D on the latest patient care development. This will give them a competitive edge against hospitals which have not yet introduced the practice.
Positive
𝑻𝟐– Fast rate of change
in technology
Increase in price, not being able to keep up
with the changes Negative
𝑻𝟑– Online health
platforms
The hospital can advertise some of its services online by creating health forums. This way, customers can easily access health information and making informed decisions.
Positive
𝑻𝟒– Online Diagnosis
Possibility to diagnose a patient regardless of where they are. The online diagnosis mechanisms brings a positive change to the hospital
Positive
𝑻𝟓– Mobile healthcare
The hospital can take advantage of the trend and bring patients closer to its services by taking care of their need through the use of mobile technology.
Positive
𝑻𝟔– Social media New digital opportunities Positive
𝑻𝟕– Customized
treatments Directed to patient communications Positive
30
Table 4.5: Economical trends
Economical
Trends Description Impact
𝐸𝟏 –Economic growth Industry highly dependent of the economic growth Positive and Negative
𝐸2–Rates Healthcare is highly correlated with rates Positive and Negative
𝐸3–Outpatient Services
Working with community providers to increase referrals, adding new services. Expanding existing treatment areas.
Positive
𝐸4–Ageing Health
infrastructure
Low level of investment results in systems in desperate need for modernization to overcome the challenges that have arisen over the years.
Negative
𝐸5–Responsive to
economic change
Changes in economy may result in the
changes in staff. Negative 𝐸6–Global economic
crisis
Reluctance of consumers to spend on
healthcare Negative 𝐸7–Reduction in
individual disposable income
Increased pressure on pricing, however the market it likely to grow due to aging population
Negative
Table 4.6: Environmental trends
Environmental
Trends Description Impact
𝐸𝑛1–Green Industry
The use of technology, equipment and resources that are friendly to the environment will reduce the impacts of global warming.
Positive
𝐸𝑛2–Sustainability
The long term use of green technology on medical resources will lead to sustainability of resources.
Positive
𝐸𝑛3–Waste
management Disposal of wastes is a sensitive issue. Negative 𝐸𝑛4–Growing
environmental agenda Identify opportunities to market Positive 𝐸𝑛5–Management for
Carbon storage
The hospital must recognise the benefits of using green technology to reduce carbon footprints and minimize waste.
Political trends (Table 4.7) can affect the performance and the options open to the organisation. They represent the degree to which a government intervenes.
Table 4.7: Political trends
Political
Trends Description Impact
𝑃1–Cyber Terrorism Medical databases hold sensitive data of patients. Negative
𝑃2–Government
Regulations
The government’s policy has allowed private
health care industry to play an important role in health.
Negative
𝑃3–Public Health
Decline The public healthcare has been reported to be
in decline. Positive 𝑃4–Local Taxation and
finance
The government heavily imposes taxes on hospitals and this has a negative effect on the overall revenue of the hospital.
Negative
𝑃5–Growing political
focus and pressure on healthcare
More pressure on pricing Negative
𝑃6–Harmonization of
healthcare across Europe
Reference pricing, exposing prices across borders
Positive & Negative
32
Figure 4.1:6Trends Diagram
This way identify key uncertainties that will affect the issue at hand can be identified. The uncertainties are also divided in the six categories: political, economic, social, technological, legal and industry.
Table 4.8: Key uncertainties
Uncertainties
Social
S4 – Cancer: There will be a probable increase in the population affected by this disease, but medical breakthroughs might also mean a cure for cancer.
Technological
T1 – Research & Development Associated can create an even bigger impact on the healthcare industry. From drugs, machines, genetic manipulation, etc
T2 – Fast rate of change in technology
Economical
E1 – Economic Growth
The biggest uncertainties and the ones that can cause a bigger impact in the industry.
E2 – Rates
E5 – Responsive to economic change
S1;S2 S3 S4 S5 S6;T6 T1 E7;T2 T3 T4 T7 E1 E2
En3; T5; E3
E4 E5;E6
En1 En2;En4 En5 P1 P2 P4; P5 P3;P6 0 1 2 3 4 5 6 7 8 9 10
0 2 4 6 8 10
Im
p
ac
t
Uncertainty
Uncertainty and Impact of trends
Social
Technological
Economic
Environmental
E6 – Global economic crisis
Environmental
En1 – Green industry Can transform the way the world uses technology.
Political
P2 – Government Regulations Regulations are firmly in place, and there is no way around them. But with the change in government, so can come the change in legislation.
P6 – Harmonization of healthcare across Europe
A big uncertainty in the near future. With the immigration crisis, plus the economic recession, it could cause a big impact in the healthcare industry.
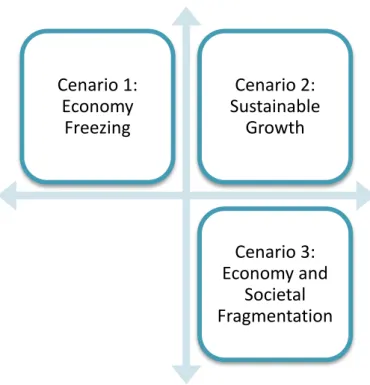
The initial scenario themes are now ready to be constructed, since the trends and the uncertainties are defined. The top two uncertainties will be selected and crossed, in order to create a graph with the different scenarios.
34
Figure 4.3:7Scenarios Matrix
Scenario 1 – Economy Freezing
Characterized by a continuing mild recession, associated with an increase in medical costs. The population keeps getting older, and a rise in chronic illnesses is observed. Hospitals and clinics have lack of personnel, as management is more focused on costs and life cycle, leading to an increase in outsourcing.
Scenario 2 – Sustainable Growth
Economic boom does not mean a decrease in health care costs. On the contrary, these increase and are associated with repeated medical breakthroughs, including the cure for cancer, and improvement in genetic modification. Although with an ageing population, the concern about healthy lifestyle increases. Hospitals are more efficient, and adapt a patient oriented business model, which includes healthcare home delivery.
Scenario 3 – Economy and Societal Fragmentation
The aggravation of the economic crisis translates into a bigger economic recession, which leads to a bigger income differential and the disruption of the classes. The government starts to exert more control on healthcare provision. There is a drain of
Cenario 1: Economy
Freezing
Cenario 2: Sustainable
Growth
Cenario 3: Economy and
doctors and personnel, causing low efficiency, low level of innovation, and an aggregation of healthcare providers.
4.3MCDA Evaluation
In order to better understand the structure of the MCDA analysis, and evaluate the problem at hand, first some notation must be defined.
The different alternatives will be given by:
𝐴𝑖 − 𝐴𝑙𝑡𝑒𝑟𝑛𝑎𝑡𝑖𝑣𝑒 𝑖 𝑡𝑜 𝑡ℎ𝑒 𝑝𝑟𝑜𝑏𝑙𝑒𝑚
𝑖 = 1, … , 𝑁
𝑁 − 𝑛𝑢𝑚𝑏𝑒𝑟 𝑜𝑓 𝑎𝑙𝑡𝑒𝑟𝑛𝑎𝑡𝑖𝑣𝑒𝑠 𝑡𝑜 𝑡ℎ𝑒 𝑝𝑟𝑜𝑏𝑙𝑒𝑚
While the criteria will be set as:
𝐶𝑗− 𝐶𝑟𝑖𝑡𝑒𝑟𝑖𝑜𝑛 𝑗 𝑡𝑜 𝑒𝑣𝑎𝑙𝑢𝑎𝑡𝑒
𝑗 = 1, … , 𝑀
𝑀 − 𝑛𝑢𝑚𝑏𝑒𝑟 𝑜𝑓 𝑐𝑟𝑖𝑡𝑒𝑟𝑖𝑎 𝑎𝑣𝑎𝑖𝑙𝑎𝑏𝑙𝑒
Since the problem definition was already defined in the previous sections, the first step in the MCDA analysis is the explanation of the criteria, as seen in Table 4.9. In the case of IPO-L, the criteria are mainly related with economic factors, since the goal of the hospital is to keep providing a quality service, but by minimizing their costs and optimizing the use of the machine. The investment cost, the maintenance and operational cost will all be grouped in the same criterion.
Table 4.9: Criteria used in MCDA
Criteria Description
C1– Costs
Includes investment, maintenance cost, and operational cost
C2– Quality
Evaluates the operational capacity of the equipment, its efficacy and quality of diagnostic C3– Organizational impact Human resources, …
C4– Operational Risk
36
The different alternatives to the problem are explained in Table 4.10:
Table 4.10: Alternatives to the problem
Alternative Description
𝐴1– Keep the old machine Keep the old machine. Finish paying the amortization until
2018, as well as a maintenance contract. 𝐴2– Direct acquisition of a new
machine
Replacement of the old machine by one of 128 slices. Direct acquisition with 2 years of warranty, and a contract of maintenance.
𝐴3 – Leasing contract for a new
machine
Replacement of the old machine by one of 128 slices. Leasing contract with everything included.
2 options: a) monthly rent for 60 months b) monthly rent for 84 months
In order to be able to compare the criterion that represents the costs of the different alternatives, the present value (PV) of the each one was calculated (Table 4.11-4.15), since we can only compare cash flows at the same point in time. The formula for the present value is given by:
𝑃𝑉(𝐴𝑖) =𝐶𝑟 (1 − (𝑖 1 + 𝑟)1 𝑛
)
Where 𝐶𝑖 is the yearly cash flow to pay, 𝑟 is the discount rate (in this case 3,25% - value provided by the management team at IPO-L), and 𝑛 is the number of periods.
Table 4.11: Cost Analysis for Alternative 1
2017 2018 2019 2020 2021
Initial Investment 0 € 0 € 0 € 0 € 0 €
Maintenance +
Operational Costs 70.000 € 70.000 € 70.000 € 70.000 € 70.000 €
Amortizations 38.496 € 38.496 € 0 € 0 € 0 €
Send to exterior * * * * *
PV 391.698,86 €
Table 4.12: Cost Analysis for Alternative 2
2017 2018 2019 2020 2021
Initial Investment 349.000 € 0 € 0 € 0 € 0 €
Maintenance +
Operational Costs 115.000 € 70.000 € 70.000 € 70.000 € 70.000 €
Amortizations 0 € 0 € 0 € 0 € 0 €
PV 699.902,00 €
Table 4.13: Cost analysis for Alternative 3 - a)
2017 2018 2019 2020 2021
Initial Investment 0 € 0 € 0 € 0 € 0 €
Maintenance +
Operational Costs 0 € 0 € 0 € 0 € 0 €
Amortizations 85.900,32 € 85.900,32 € 85.900,32 € 85.900,32 € 85.900,32 €
PV 390.605,86 €
Table 4.14: Cost analysis for Alternative 3 - b)
2017 2018 2019 2020 2021 2022 2023
Initial
Investment 0 € 0 € 0 € 0 € 0 € 0 € 0 €
Maintenance
+ Op. Costs 0 € 0 € 0 € 0 € 0 € 0 € 0 €
Amortizations 63.314,76 € 63.314,76 € 63.314,76 € 63.314,76 € 63.314,76 € 63.314,76 € 63.314,76 €
PV 390.778,69 €
The Present Values for the different alternatives can be compared in the following table:
Table 4.15: PV of the different alternatives
𝑷𝑽(𝑨𝟏) 391.699 €
𝑷𝑽(𝑨𝟐) 699.902 €
𝑷𝑽(𝑨𝟑𝒂) 390.606 €
38
From table 4.15, it can be concluded that Alternative 2 is the less desirable concerning the criterion of cost, since it has the highest present value, and thus it means a higher cost for the hospital.
Regarding the criterion of Quality, we can compare the technical specifications for both machines that are being considered:
Table 4.16: Technical Specifications of CAT Scanners
Since Alternative 1 has the technical specification of a Siemens SOMATOM Sensation 16, and Alternatives 2, 3a), and 3b) have similar technical specifications of a CAT of 128 slices described in Table 4.16, it can be concluded that Alternatives 2, 3 a) and 3b) are equally preferred when compared to one another, and more preferred when compared to Alternative 1.
Regarding the criterion of Organizational Impact, the impact of the different alternatives is relatively similar. This happens since the alternatives will not demand changes or
Siemens SOMATOM Sensation 16 [33][34]
CAT 128 Slices[35]
Detector Ultra Fast Ceramic with
adaptive array detector
Ultra Fast Ceramic (UFC)
Number of acquired slices 16 128
Rotation time Up to 1.5 s Up to 0.3 s
Temporal resolution - Up to 150 ms
Generator power 60 kW 80, 100 kW
kV steps 80, 100, 120, 140 kV 70, 80, 100, 120, 140 kV
Isotropic resolution - 0.33 mm
Cross-plane resolution - 0.33 mm
Max. pitch - Up to 1.5; up to 192 mm/s
coverage
Table Load Up to 200 Kg Up to 307 kg
Gantry opening 70 cm 78 cm
Dose - Reduce radiation dose up to
60%
Features
z-Sharp technology, STRATON x-ray tube, CARE
Dose4D, High speed volume scanning, Proprietary z-UHR
technolgy[36]
FAST CARE technology and Single Source Dual Energy ,z-Sharp technology, STRATON
sacrifices in the organizational structure of the hospital. This will probably also be the criterion that will have less weight in the overall evaluation of the criteria.
Regarding Operational Risk, although no official numbers are provided, it is known that the risk of Alternative 1 is much higher than any other Alternative, as it was explained above. Thus, it can be concluded that this will be the least desirable Alternative regarding this criterion. While Alternative 2 has a much smaller risk, since it will be protected by a two-year warranty and a maintenance contract with spare parts guaranteed, Alternatives 3a) and 3b) carry no risk, since everything is covered in the leasing contract. Therefore, both alternatives are the preferred ones regarding this criterion.
For this case, the Analytic Hierarchy Process method will be used. As previously said, this method is based on 𝑛 × 𝑛 matrix, where the lines and columns are the n criteria evaluated for the case.
After defining the alternatives and the criteria, an hierarchy tree can be built, based on
De Lima’s study [17], as seen in Figure 4.4.
Figure 4.4:8Choice hierarchy composition Goal: Select the best choice for IPO
Costs Organizational impact
Risk Quality
40
As to compare the different criteria for the different alternatives to the problem, the criteria must be in the same gauge, thus they must be normalized. In order to that, there must be created a scale for comparison. Since the AHP method is being applied, the pairwise comparison scale will be used, as seen in Table 4.17 and Table 4.18:
Table 4.17: Pairwise Comparison Table [24], [37]
How important is A relative to B? Preference Index Assigned
Equally important 1 Moderately more important 3 Strongly more important 5 Very strongly more important 7 Extremely more important 9
Table 4.18: Scale for pairwise comparison [24]
1/9 1/7 1/5 1/3 1 3 5 7 9
Extremely Very
Strongly Strongly Moderately Equal Moderately Strongly
Very
Strongly Extremely Less Important/Preferred More important/Preferred
Now, the pairwise comparison matrix (Table 4.19) can be built based on the preference and importance of the criteria:
Cost is “extremely more important” than organizational impact (9), “very strongly more important” than quality, and “moderately to strongly” more
important than operational risk.
Operational Risk is “strongly” more important than quality, and “strongly to very strongly” more important than organizational impact.
Qualityis “moderately” more important than organizational impact.
Table 4.19: Pairwise Comparison Matrix for the criteria
Costs Quality Organizational
Impact Operational Risk Sum
Costs 1 7 9 4 21,00
Quality 1/7 1 3 1/5 4,34
Organizational
Operational
Risk 1/4 5 6 1 12,25
Sum 1,50 13,33 19,00 5,37
The next step is to transform the pairwise comparisons matrix into a set of normalized scores that represent the relative importance of each weight of each criterion. The normalization is done by completing the following steps:
1) Sum the numbers in each column of Table 4.19, and
2) Divide each entry by the previous sum and sum each row (Table 4.20) 3) Calculate the average value of each row (Table 4.21)
Table 4.20: Normalized Scores of the Criteria
Costs Quality Organizational
Impact
Operational
Risk Sum
Costs 0,66 0,53 0,47 0,75 2,41
Quality 0,09 0,08 0,16 0,04 0,37
Organizational
Impact 0,07 0,03 0,05 0,03 0,18
Operational Risk 0,17 0,38 0,32 0,19 1,04
The average value for each criterion corresponds to their normalized weight. The criterion with the highest average score is the most important one, in this case the cost, followed by the operational risk.
Table 4.21: Consistency Analysis of the Criteria
Average Score Consistency
Measure CI CR
Costs 0,60 4,48
0,13 0,14
Quality 0,09 4,01
Organizational
Impact 0,05 4,09
Operational
Risk 0,26 4,38
42
consistency measure can the found through Excel by using the function =MMULT(), which is basically a function that multiplies matrixes.
The consistency index is given by the following equation [38]:
𝐶𝐼 =𝜆𝑚𝑎𝑥𝑛 − 1− 𝑛
Where 𝜆𝑚𝑎𝑥 is the sum product of the average score values with the sum of each column, and n the number of criteria.
The consistency ratio tells the decision maker how consistent he has been when making the pairwise comparisons. In practice this value should be 0,1 or below to be considered acceptable. The CR is given by [38]:
𝐶𝑅 =𝑅𝐼𝐶𝐼
RI is a random index, which can be found in Table 4.22 [38]:
Table 4.22: Random Index
n 1 2 3 4 5 6 7 8 9 10
RI 0 0 0,58 0,9 1,12 1,24 1,32 1,41 1,45 1,49
Once the scores for the criteria have been found, the focus turns to the level 2 of the hierarchy tree (Figure 4.4), where each alternative must be evaluated regarding each criterion.
The same methodology applied above is used for the following calculations, in which each alternative is ranked for each criterion. Thus, four matrixes will be developed (Table 4.23, 4.26, 4.29), one regarding each criterion, where each alternative will be pairwise compared against every other alternative relative to the same criterion.
![Figure 2.1: Population areas covered by IPO-L [4]](https://thumb-eu.123doks.com/thumbv2/123dok_br/16542084.736780/26.892.307.558.192.554/figure-population-areas-covered-ipo-l.webp)
![Figure 2.2: CAT Scan [6]](https://thumb-eu.123doks.com/thumbv2/123dok_br/16542084.736780/27.892.239.657.103.420/figure-cat-scan.webp)
![Figure 2.3: Evolution of CT scanners [5]](https://thumb-eu.123doks.com/thumbv2/123dok_br/16542084.736780/28.892.128.761.257.895/figure-evolution-of-ct-scanners.webp)
![Figure 2.4: Cranial CT evolution: 1974 (left) VS 1983 (right) [11]](https://thumb-eu.123doks.com/thumbv2/123dok_br/16542084.736780/29.892.167.729.196.609/figure-cranial-ct-evolution-left-vs-right.webp)