ISSN: 1553-345X
©2014 Science Publication
doi:10.3844/ajessp.2014.260.276 Published Online 10 (3) 2014 (http://www.thescipub.com/ajes.toc)
Corresponding Author: Shamshiry,E., Institute for Environment and Development (LESTARI), Universiti Kebangsaan Malaysia (UKM), Bangi, Selangor, Malaysia
INVESTIGATING THE STANDARD PROCESS OF
INCINERATION IN LANGKAWI ISLAND, MALAYSIA
Shamshiry, E., M. Bin Mokhtar and A.M. Abdulai
Institute for Environment and Development (LESTARI), Universiti Kebangsaan Malaysia (UKM), Bangi, Selangor, Malaysia
Received 2014-01-22; Revised 2014-04-09; Accepted 2014-05-02
ABSTRACT
Development activities and increasing urbanization have direct impact on solid waste generation, especially in municipalities of the developing countries, which poses a major challenge to the authorities. Many various technologies and strategies can be used in the field of garbage procedures. Incineration is a well-organized approach and tool to decrease the volume of waste and insist for additional landfill area. One of the important benefits of using the incineration is its ability to decrease a significant amount of waste combustibles by 80 to 95%. Controlling air pollution in the process of using the incineration poses a challenge for solid waste disposal. The data utilized in this article include personal interview of the experts handling the incineration process in Langkawi and personal observation. Secondary data obtained from the Ministry of Housing and Local Government was used to investigate the external air pollution from using the incinerator in Langkawi. The results showed, through the analysis of raw data with SPSS IBM 19 and Pearson correlation analysis and identify cluster of dendrogram generated by UPGMA, an external pollution minimum (p<0.05) between sampling sites inside the incinerator. The reasons for the difference are related to untimely and inappropriate opening of the combustion chamber door, exorbitance blowing and improper use of the installed air pollution control devices. The proper treatment of solid waste is very crucial, especially in Langkawi Island which is a tourist destination. The use of incinerator can enhance solid waste treatment, but only when the standard operating procedure is observed. Without properly observing the procedure, the use of an incinerator can cause more environmental and personal health issues like air pollution and the releasing of hazardous waste and clinical waste s into the landfill. These are some of the reasons that motivated this study to investigate the use of incineration in Langkawi Island.
Keywords: Incinerator, Air Pollution, Langkawi Island, Waste Management
1. INTRODUCTION
It is a fact that the environment has been affected by solid waste generated at homes, workplaces and industrial setups (Adzimah and Anthony, 2009). Whenever new machinery is compared with the traditional way of Solid Waste (SW) management, the new one appears to be better in terms of its ability to reduce the volume of solid waste. By that way, high environmental standard will be ensured, thereby
protecting the ecosystem including the safety of human beings. With the growing quantity of SW and the scarcity of land, related costs to landfill are increasing, especially in the urban areas and islands. Thus, this is the reason for the need to use advanced techniques in waste management and the use incinerator is one of them. Incinerator has the potential to use the energy generated or produced from SW.
with simple disposal components that have the ability to decrease volumes of waste, improve hygiene in the surrounding area and enhance waste-to-energy units through comprehensive procedures and the control of emission systems Christensen (2010). Therefore, incinerator unit modifies toxic waste into residues and produces fly ash and gas as its products. Emissions from the incinerator and the acid flue gases it produced for the duration of combustion display a contamination source that should be controlled (Bodenan and Deniard, 2003) because of the high toxic nature of these gases. Some of the important benefits that associated with the use incineration include: Improve waste transfer with less emissions, reduce the weight of waste which has effectively no ability to produce methane when disposed in landfills, and the ash produced in incinerator process has mainly inorganic material which is in a stable form and can be recycled to make money. Thus, incineration may be considered as a landfill pretreatment (Smith et al., 2001).
The main motivation behind the incineration technology is to generate useable energy while reducing the waste amount, thus making its use as a waste disposal method much more attractive. Recovering energy from the combustible waste is an important source of energy if it is used sustainably. From the viewpoint of energy, incineration introduces an environmentally friendly option to burn fossil fuels. Therefore, the incineration provides a significant source to reduction a great deal of solid waste volume and weight. When waste enters the landfill, it is expensive. It requires more funds for landfill construction and once the landfill is established there is the need for a principal, who will monitor and maintain the landfill in the long term. Furthermore, there are other expenses associated with landfills such as the reduction of land value in the surrounding areas, due to the offensive odor confronting the residents.
The by-products of incineration are bottom ash, while almost 4% of inputs are fly ash and significant ash quantities have financial and practical value. Ash affects verification, which ensures that heavy metals are not leachable substances during transportation into the landfill sites. If the combustion procedure is implemented capably, residual organic material in the residue of the ash would be reduced to small quantity. Consequently, the ash cannot change to natural leachate or gas when it is discarded inside landfill site (Smith et al., 2001). The emissions from an
incinerator from the combustion of waste are an important negative factor due to their pollution effects on the air quality and the climate that impact both humans and plant life. Also, particulate emissions are a toxic by-product of materials combustion. For example, facilities of the Waste To Energy (WTE) generated 81 mercury tones in the US in 1989 (Themelis et al., 2002).
Huge quantities of extra strong matters such as mercury are emissions that have quiet harmful impacts on health of residents in the area. While the threat to human health is obvious from the emissions of incineration, the larger and more widespread effect of such emissions on plant life in particular and the environment in general is very significant, which must be seriously considered. Green House Gas (GHG) emissions such as CO2 and N2O are among the
principal contributors to climate change from incineration. Gas emissions from incinerator and related risks may be decreased by employing standard emission, efficient controls and enhanced organization practices. Also, adequate maintenance of the incinerator is necessary (Batterman, 2004a). Consideration should be given to decrease such emissions. One option is to reduce the content of recyclable materials in the stream of incinerated waste (Fig. 1).
Autoclaving with shredding and compression is a technically and economically practicable alternative to incineration (Batterman, 2004b). The technology is established as the technology efficient and it has been enhanced by using the shredding device for the process. It will reach the same decrease size as incineration with no adverse effect such as hazardous emissions.
1.1. Building and using of Incinerators
Fig. 1. A and B Combustion of solid waste in Langkawi Island by resident (April 2010) Table 1. Types of pollutants associated with municipal waste incinerators and their control
Types of pollutants Controlling pollutants
Light hydrocarbon waste Incineration and recycle can be useful if this materials be without Cl (Chlorinated will be because of a gradual pressure pipe)
Sulfur compounds A method of auricular, for washing Hydroxide sodium. This is usually done before the process of burning waste
Mix of Nitric acid and hydrofluoric acid Neutralization with limestone in calcium nitrate and calcium fluoride in the mud, the result is an auricular
Monoxide carbon Amount of that is less than coal in comparison
Odors due to the anaerobic reaction Chlorine to the pool, where the aromatic compounds are oxidized and control bacteria. Fabric filters can remove 90% of their organic materials output Hydrogen chloride and florid hydrogen Using added calcium compounds, they can be controlled. Advanced scrubbers
acid-gas can control more than 90% of these compounds
Dioxide sulfur Advanced scrubbers acid-gas can control more than 60% of these compounds Metals existing in the chimney gases Bags filter can absorb 90 percent of them
Fly ash Separation and removal of materials from waste that contain high levels of lead and cadmium, will reduce the toxic of fly ash
Source: Takdastan et al. (2005)
In addition; the fundamentals of a Good Combustion Practice (GCP) must be observed to manage dioxin and furan discharges (Brna and Kilgroe, 1989; Batterman, 2004b).
The appropriate site selection is an important issue. In the construction of incinerator units in an area, care should be taken to site them at a safe distance from the locations that are sensitive to pollution. According to the region's topography, the incinerator plant must be maintained in such a way that there will not be wide dissemination of outputs and such outputs are not suspended in the air. Chimney height should be appropriate to provide for proper dilution of gases and the output particles before their precipitation in the earth's surface.
1.2. Installing Air Pollution Control Equipment to
Reduce Emissions and Particles
To control air pollution caused by emissions of particulate matter and gases, different instruments
should be used. Table 1 shows pollutant types in municipal waste incinerators and pollution control. The main components of air pollution control from incinerators can be named as wet scrubbed, dried scrubbed, sedimentation reservoir, bag filters, dry sorbent injection, deposition of the electrostatic, silkons and after burner. Each of the air pollution control equipments has specified removal efficiency to remove air pollutants. One of the pollutants types is sulfur compounds that the method uses before the process of burning waste. Table 2 show important issues for designing of small scale incinerator and recommend by UNDP and EPA.
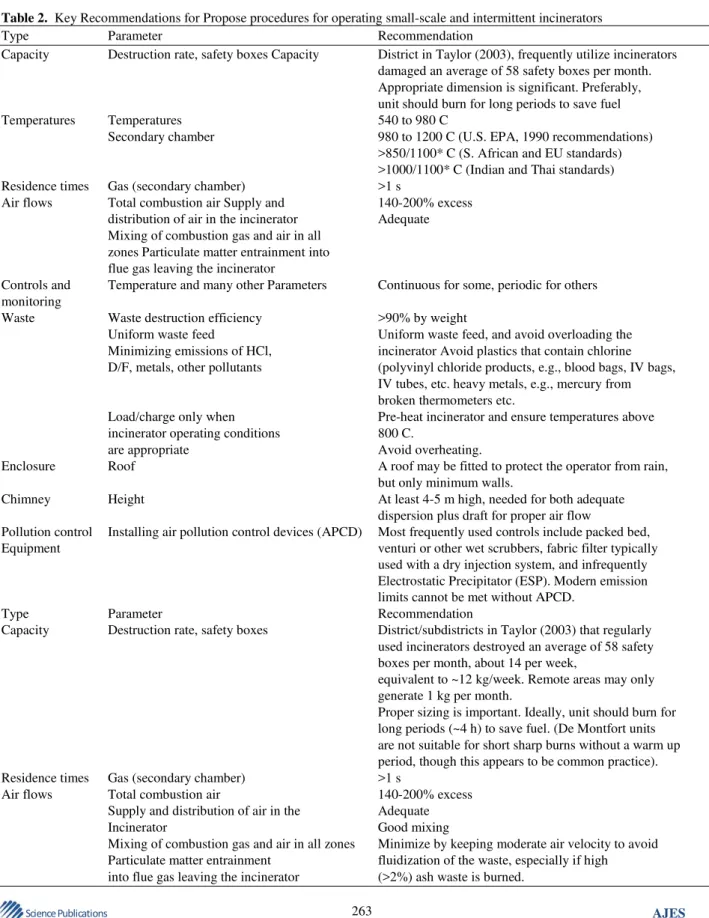
Table 2. Key Recommendations for Propose procedures for operating small-scale and intermittent incinerators
Type Parameter Recommendation
Capacity Destruction rate, safety boxes Capacity District in Taylor (2003), frequently utilize incinerators damaged an average of 58 safety boxes per month. Appropriate dimension is significant. Preferably, unit should burn for long periods to save fuel
Temperatures Temperatures 540 to 980 C
Secondary chamber 980 to 1200 C (U.S. EPA, 1990 recommendations)
>850/1100* C (S. African and EU standards) >1000/1100* C (Indian and Thai standards)
Residence times Gas (secondary chamber) >1 s
Air flows Total combustion air Supply and 140-200% excess distribution of air in the incinerator Adequate Mixing of combustion gas and air in all
zones Particulate matter entrainment into flue gas leaving the incinerator
Controls and Temperature and many other Parameters Continuous for some, periodic for others monitoring
Waste Waste destruction efficiency >90% by weight
Uniform waste feed Uniform waste feed, and avoid overloading the Minimizing emissions of HCl, incinerator Avoid plastics that contain chlorine D/F, metals, other pollutants (polyvinyl chloride products, e.g., blood bags, IV bags,
IV tubes, etc. heavy metals, e.g., mercury from broken thermometers etc.
Load/charge only when Pre-heat incinerator and ensure temperatures above incinerator operating conditions 800 C.
are appropriate Avoid overheating.
Enclosure Roof A roof may be fitted to protect the operator from rain,
but only minimum walls.
Chimney Height At least 4-5 m high, needed for both adequate
dispersion plus draft for proper air flow
Pollution control Installing air pollution control devices (APCD) Most frequently used controls include packed bed,
Equipment venturi or other wet scrubbers, fabric filter typically
used with a dry injection system, and infrequently Electrostatic Precipitator (ESP). Modern emission limits cannot be met without APCD.
Type Parameter Recommendation
Capacity Destruction rate, safety boxes District/subdistricts in Taylor (2003) that regularly used incinerators destroyed an average of 58 safety boxes per month, about 14 per week,
equivalent to ~12 kg/week. Remote areas may only generate 1 kg per month.
Proper sizing is important. Ideally, unit should burn for long periods (~4 h) to save fuel. (De Montfort units are not suitable for short sharp burns without a warm up period, though this appears to be common practice).
Residence times Gas (secondary chamber) >1 s
Air flows Total combustion air 140-200% excess
Supply and distribution of air in the Adequate
Incinerator Good mixing
Table 2. Continued……
Controls and Temperature and many other Parameters Continuous for some, periodic for others monitoring
Waste Waste destruction efficiency >90% by weight
Uniform waste feed Uniform waste feed, and avoid overloading the Minimizing emissions of HCl, incinerator Avoid plastics that contain chlorine D/F, metals, other pollutants (polyvinyl chloride products, e.g., blood bags, IV bags,
IV tubes, etc. heavy metals, e.g., mercury from broken thermometers etc.
Load/charge only when Pre-heat incinerator and ensure temperatures above incinerator operating conditions 800 C.
are appropriate Avoid overheating.
Enclosure Roof A roof may be fitted to protect the operator from rain,
but only minimum walls.
Chimney Height At least 4-5 m high, needed for both adequate
dispersion plus draft for proper air flow
Pollution control Installing Air Pollution Control Devices (APCD) Most frequently used controls include packed bed,
Equipment venturi or other wet scrubbers, fabric filter typically
used with a dry injection system, and infrequently electrostatic precipitator (ESP). Modern emission limits cannot be met without APCD.
Source: Derived in part from (U.S. EPA, 1990; UNEP, 2003; Batterman, 2004a)
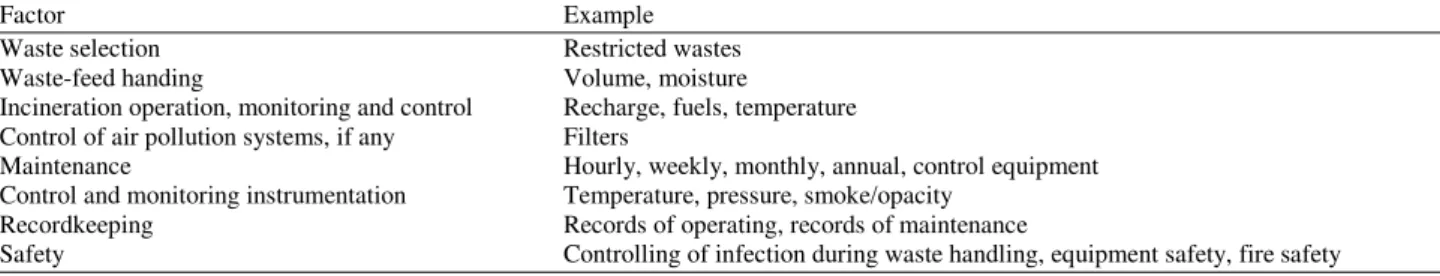
In the operation phase of the incinerator, correct operation is important to fully benefit from the design of the incinerator. Generally, the equipment manufacturer or designer should supply a manual that provides working procedures and processes of set up and the standard process of shutting down, tips for maintenance, recommended spare parts which may require special tooling. Some of the general operating procedures are listed in Table 3. As mentioned in table controlling of infection during waste handling, equipment safety and fire safety are necessary for safety issues in small incinerator.
In the monitoring phase of the incinerator, monitoring of combustion and emission should be routinely done to determine if the incinerators are correctly managed. Furthermore, screening is necessary to ensure conformity with regulations. Monitoring process of metals and dioxin, HCl, NOx for incinerator include the assessment of odors and emissions, stack tests regularly, temperature, pressure and soil monitoring near the incinerator to determine the suitability of burning. There are dangers to people living in the surrounding area of incinerators; this hazard can occurred due to the absence of dioxins monitoring (Thompson and Anthony, 2008).
Safety issues for incinerator are not just the prevention of emissions which happen during standard operating conditions; but attention should be paid to the
fact that many contaminants are bio-accumulate, they enter the food chain, stay there then produce chronic illnesses ultimately in the geographical region concerned. Furthermore, to prevent operator injury such preventive measures as using eye and face masks, heavy-duty gloves and fire safety are necessary in incinerator safety programs. For maintenance issue, an inadequately maintained incinerator will affect the combustion quality that creates risky emissions to the public. There is a need for repeated scheduled maintenance (U.S. EPA, 1990). A typical maintenance schedule for a small-scale incinerator and frequency of their activity are shown in Table 4. Incinerators typically need maintenance after about three (3) years.
1.3. Monitoring of Air Pollution from Incinerators
The monitoring and maintenance program in incinerators to control air pollution from incinerators is explained. Permanent monitoring program for pollutants of SO2, NO2, NO, HCl, TSP, VOCs, PM10,
Table 3. Operation and maintenance issues for small incinerators according to interview with the experts in Langkawi Island
Factor Example
Waste selection Restricted wastes
Waste-feed handing Volume, moisture
Incineration operation, monitoring and control Recharge, fuels, temperature Control of air pollution systems, if any Filters
Maintenance Hourly, weekly, monthly, annual, control equipment Control and monitoring instrumentation Temperature, pressure, smoke/opacity
Recordkeeping Records of operating, records of maintenance
Safety Controlling of infection during waste handling, equipment safety, fire safety
Table 4. Typical maintenance schedule for incinerators
Activity Frequency Component procedure
Hourly Ash removal Inspect and clean as required
Underfire air ports door seals Inspect and clean as required
Ash pit Inspect for wear, fit closeness, air leakage
Clean after each shift Weekly Latches, hinges, wheels Lubricate if applicable
Monthly External incinerator surfaces and Inspect external hot surfaces. White spots or
chimney (stack) discoloration may indicate loss of refractory Inspect and
Refractory repair minor wear with refractory cement
Upper/secondary combustion chamber Inspect and remove particulate matter accumulated on chamber floor
Semi-annually Hot external surfaces inspect and paint with high temperature paint as required
Ambient external surfaces Inspect and paint as need
Source: Derived in part from U.S. EPA (1990)
Table 5. The monitored parameters in control air pollution due to incinerators
O2, CO, CO2, HCL, All Hydrocarbons, Temperature,
Permanent monitoring Nitrogen oxides, Transparency into the chimney
Periodic monitoring suggested twice per year Chlorinated dioxins, ashes, furans, heavy metals in outputs chimney,slag, materials resulting from the combustion process, residues of pollution control machines Source: Takdastan et al. (2005)
2. MATERIAL AND METHODS
2.1. Study Area
The first global Geopark in Malaysia and Southeast Asia, Langkawi Geopark comprises 99 islands of Langkawi of the Kedah State, Malaysia. The latitude of Langkawi is “6° 19' 47" N (deg min sec), 6.3297° (decimal), 0619.78N (LORAN) and the longitude of the area is 99° 43' 43" E (deg min sec), 99.7287° (decimal) and 09943.72E (LORAN)”.
2.2. Methodology
In this research, we used personal observation of the area, conducted interview with the experts on the ground and conducted a review of secondary materials on the topic. Due to the amount of fixed carbon and ash content of solid waste in Langkawi Island, this study applied ASTM E 830-96 “Standard Test Method
for Ash in the Analysis Sample of Refused-Derived Fuel”. Again, due to the amount of carbon hydrogen of solid waste in Langkawi Island, we applied ASTM E 777-96 “Standard Test Method for carbon and hydrogen in the Analysis Sample of Refused-Derived Fuel”, we also applied ASTM E 778-96 “Standard Test Method for Nitrogen in the Analysis Sample of Refused-Derived Fuel” because of the amount of Nitrogen in solid waste in Langkawi Island. As a result of the amount of Sulfur in solid waste in Langkawi Island, we applied ASTM E 778-96 “Standard Test Method for Sulfur in the Analysis Sample of Refused-Derived Fuel” respectively.
applied ASTM D 3176 “Standard Practice for Ultimate Analysis of Coal and Cock”. Because of presence and the amount of sodium, potassium, calcium and cadmium in solid waste in Langkawi Island, we used ASTM E 926-94 “Standard Test Method for Preparing Refused Drived-Fuel Sample for Analysis of Metals”. Due to the amount of copper, aluminum, silica, iron, lead, mercury, tin, zinc, chromium, arsenic, cobalt, manganese and nickel of solid waste in Langkawi Island, this study applied ASTM E 885-96 “Standard Test Method for Analysis of Metals in Refuse-Derived Fuel by Atomic Absorption Spectroscopy” (MHLG, 2009).
If the main purpose is to investigate the fundamental aspects that are not directly clear in data groups, the factor analysis method is appropriate (Towned, 2012; Charkhabi and Sakizadeh, 2006). The main aim of applying factor analysis is to use the calculated correlation matrix to recognize the minimum quantity of general parameters that give the greatest details or explanation of the correlation between the indicators (statistic). To realize a minor element arrangement that can be significantly explicated by the researcher, element rotation can be applied to recognize the majority probable aspects solution (Sharma, 1996; Charkhabi and Sakizadeh, 2006). Data was analyzed using Statistical Package for Social Science (SPSS 19.0 IBM) to assess the significance of differences contained by the Physico-chemical factors with one-way analysis of variance (ANOVA), where significant values (p<0.05) were obtained, “A posteriori” Dunkan Multiple Range Test afterwards was used as means pairs to find out the variance location. Pearason’s rank correlation was applied to create relations between elements in the study area of Langkawi Island (Zar, 1984; Imoobe and Koye, 2011). Un-weighted Pair Grouping Method with Arithmetic-mean (UPGMA) software was used as clustering method to obtain clear shape of all the measured traits (Talei et al., 2012) and Graph Pad Prism version 5 was used to obtain clear diagram related to SPSS parts (comparison of water, soil and incinerator stations).
3. RESULTS
3.1. Pearson
Correlation
Analysis
for
Incinerator Sampling In Langkawi Island
Pearson’s correlation analysis: Correlation analysis provides a statistical means to show the relationship
and the strength of the relationship among metric variables (Malhotra, 2004; Yee and San, 2011). It designates the potency of linear relationship among variables (Malhotra, 2004). Pearson’s correlation coefficient is utilized in analyzing the association between the random variables. This kind of analysis is for determine the association between the variables.
The coefficient displays the linear association scale and/or the correlation direction. The correlation coefficient ranges from +1 shows ideal positive connection to -1, which shows ideal negative connection in addition to 0 rate shows no linear connection.
For example in Fig. 2, calcium and potassium have relationship and according to the analysis, the correlation is significant at the 0.01 level. Also, the relationship between sodium and total moisture is significant at the 0.01 significance level and r is 0.738. There was a negative relationship between dry basis and oxygen at the 0.01 significance level.
3.2. Modeling of SPSS for Incinerator in
Langkawi Island
The study chose the significant parameters and entered them into the model with the use of SPSS (Fig. 2). Even though the first model is significant, the second model has been found to be more significant.
Potassium and Iron were not entered into the model because they were found to have no effect on the model. However, temperature has been found to have affected sodium and increased its bulk density. There is shown by the following Equation 1:
(
)
(
)
Y 30.449 0.390 Amount of Sodium
0.358 Amount of Bulk Density
= +
− (1)
Linear equation explained heat (temperature) had the most effect on sodium and bulk density. Results by SPSS IBM clarified between of surveyed elements, amount of sodium and bulk density were significant parameters.
The model is chosen that have the most variable and its effect not low statistically Equation 2:
(
)
(
)
Y 22.885 0.29 Ash Content
0.002 Amount of Potassium
= −
Pearson Correlation
Total Moisture Volatile Matter Ash Content Fixed Carbon Carbon Hydrogen Nitrogen Sulfur Chlorine Oxygen Sodium Potasium Calcium Cadmium Copper AluminiumNickel Iron Lead Mercuary Tin Zink Cromium Arsenic Cobalt Manganese Silica Bulk DensitField MoistTemperaturDry Basis Wet Basis Total Moisture 1
Volatile Matter -0.05 1 Ash Content -0.078 -.531** 1 Fixed Carbon 0.132 -0.286 -.660** 1 Carbon -0.273 .464** -.496** 0.15 1 Hydrogen 0.082 0.117 -0.149 0.065 0.091 1 Nitrogen 0.304 0.329 -.419* 0.182 -0.062 0.149 1 Sulfur -0.121 0.054 0.191 -0.264 0.072 -0.161 -.362* 1 Chlorine -0.02 0.03 0.28 -.343* 0.029 -0.086 -.339* .460** 1 Oxygen 0.266 -0.012 .340* -.374* -.856** -0.199 0.166 0.019 -0.002 1 Sodium .738** 0.141 -0.133 0.025 -0.274 0.261 .440** -0.151 -0.216 0.291 1 Potasium .667** -0.167 0.199 -0.077 -.393* 0.06 0.07 -0.042 -0.176 .349* .693** 1 Calcium .551** -0.16 0.078 0.054 -0.279 -0.184 .395* -0.066 -0.173 0.297 .503** .640** 1 Cadmium -.413* -0.093 -0.119 0.217 0.265 0.146 -0.07 0.083 -0.089 -.404* -.390* -.393* -.349* 1 Copper -0.232 -0.059 -0.144 0.216 0.256 0.144 0.151 -0.058 -0.094 -0.293 -0.177 -.389* -0.015 0.304 1 Aluminium -0.039 0.063 -0.224 0.197 0.262 0.152 0.089 -0.069 -0.247 -0.325 0.157 -0.072 -0.018 0.176 0.086 1 Nickel -.568** 0.174 -0.209 0.081 0.235 0.015 -0.05 0.268 0.007 -0.167 -.553** -.470** -0.312 .482** 0.291 0.07 1 Iron .500** -0.265 0.286 -0.088 -.441** 0.07 -0.085 -0.058 -0.045 0.315 .655** .776** .359* -0.276 -0.245 -0.077 -.549** 1 Lead -0.226 -0.06 -0.249 .335* .489** 0.112 0 0.05 -0.061 -.606** -.443** -.482** -0.248 .553** .371* .393* .508** -.526** 1 Mercuary -0.3 -0.027 -0.117 0.156 .355* 0.099 -0.259 0.181 0.012 -.384* -.503** -.337* -0.15 .380* 0.303 -0.036 .452** -.489** .645** 1 Tin -0.253 0.033 0.035 -0.069 0.191 0.057 -0.187 0.078 0.005 -0.139 -0.212 -0.213 -0.139 .509** 0.251 0.206 0.055 -0.184 0.118 0.042 1 Zink -0.249 -0.096 -0.142 0.245 0.265 0.01 0.003 0.121 -0.038 -.361* -0.209 -0.301 -0.033 .434** 0.314 .519** 0.151 -0.318 .465** 0.193 .473** 1 Cromium -.441** 0.028 0.249 -0.307 0.086 -0.233 -0.232 0.137 0.23 -0.048 -.571** -.522** -.366* .407* 0.076 0.1 .455** -.410* .409* 0.225 0.233 0.182 1 Arsenic -0.077 -0.147 0.116 -0.001 -0.21 0.091 -0.148 -0.145 -0.04 0.181 -0.106 0.019 -0.02 -0.193 -0.181 -0.011 -0.029 0.115 -0.159 -0.187 -0.064 -0.156 -0.151 1 Cobalt 0.081 -0.202 -0.025 0.208 -0.008 0 0.055 0.069 -0.03 -0.15 -0.031 0.188 -0.118 0.103 0.019 0.158 0.124 0.097 0.21 -0.1 -0.118 0.129 -0.1 0.009 1 Manganese -.468** -0.138 -0.103 0.238 0.245 -0.04 -0.057 0.1 -0.062 -0.324 -.601** -.475** -0.317 .372* 0.229 0.095 .525** -.476** .561** .493** 0.125 0.291 .489** 0.003 0.274 1 Silica 0.148 0.015 0.051 -0.071 -0.006 .342* 0.093 -0.015 -0.169 -0.004 0.233 0.214 0.053 0.074 -0.229 0.167 -0.174 0.272 -0.146 -0.16 -0.052 -0.172 -0.126 0.081 -0.012 -0.165 1 Bulk Density 0.094 0.246 -0.138 -0.061 -0.126 0.002 0.018 0.039 0.009 0.33 -0.033 0.103 0.112 -0.234 -0.002 -0.121 0.029 -0.085 -0.066 0.115 -0.031 -0.129 -0.093 0.034 -0.044 -0.084 -0.05 1 Field Moisture -0.129 .431** -.674** .381* .389* 0.125 .361* -0.104 -0.153 -0.235 -0.134 -.482** -0.143 0.084 0.175 0.209 0.297 -.503** .366* 0.195 0.062 0.242 -0.081 -0.052 -0.164 0.175 0.007 0.185 1 Temperature 0.294 -0.082 0.056 0.01 -0.208 -0.028 0.1 -0.093 -0.137 0.14 .402* .370* 0.23 0.014 -0.251 -0.044 -0.149 .363* -0.292 -0.218 -0.085 -0.162 -0.19 0.067 -0.004 -0.277 0.189 -.371* -0.191 1 Dry Basis -0.256 0.277 -.426* 0.236 .909** .376* -0.133 0.03 -0.033 -.905** -0.221 -0.321 -0.325 .334* 0.307 0.331 0.208 -0.322 .531** .383* 0.171 0.286 0.004 -0.144 0.05 0.237 0.104 -0.148 0.309 -0.272 1 Wet Basis -.850** 0.238 -0.214 0.031 .703** 0.14 -0.249 0.084 -0.017 -.670** -.631** -.631** -.549** .486** 0.323 0.201 .539** -.539** .431** .427* 0.282 0.326 0.313 -0.028 -0.033 .472** -0.061 -0.149 0.267 -0.296 .713** 1 **. Correlation is significant at the 0.01 level (2-tailed).
*. Correlation is significant at the 0.05 level (2-tailed).
Fig. 2. Pearson Correlation analysis for incinerator sampling in Langkawi Island According to the results obtained by using ANOVA
and SPSS (IBM), moisture has the most impact on ash and potassium and temperature has the most effect on sodium by increasing its bulk density.
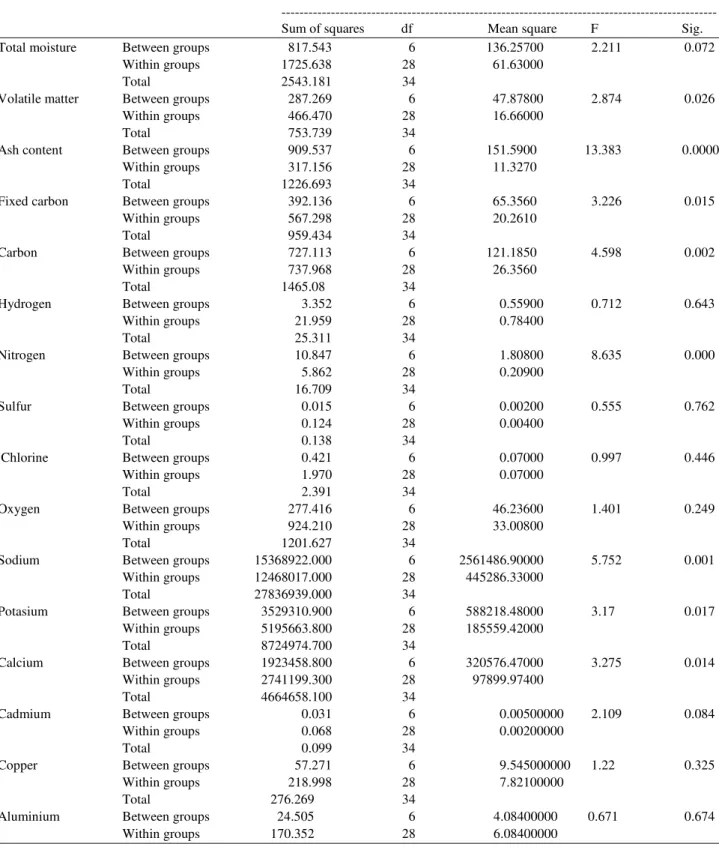
Table 6 shows coefficient of sodium and bulk density in the model; the significant is less than 0.05. In Table 7 analysis of variance is explained and significant of models. Table 8 is related to ash and potassium factors in the model. Table 9 show the Total ANOVA result of measured elements of incinerator in Langkawi Island.
The analysis of incinerator shows that moisture effects among 7 sampling periods of did not have much difference.
3.3. Analysis by Post Hoc
Analysis of studied elements done by SPSS and Post Hoc Tests and results is shown in Table 10 and Fig. 3-9.
Analysis of data by SPSS, Post Hoc Tests showed between the several sampling have not different significantly. Figure 9 show all the samples almost have equal moisture.
Table 6. Coefficients of incinerator in Langkawi Coefficientsa
--- Unstandardized coefficients Standardized coefficients
--- ---
Model B Std. Error Beta t Sig.
(Constant) 28.886 0.139 207.549 0.000
Sodium 0.0000 0.000 0.402 2.522 0.017
(Constant) 30.449 0.664 45.883 0.000
Sodium 0.0000 0.000 0.390 2.617 0.013
Bulk density -0.006 0.003 -0.358 -2.401 0.022
a. Dependent variable: Temperature
Table 7. ANOVA analysis of incinerator by SPSS ANOVAc
---
Model Sum of squares df Mean square F Sig.
1 Regression 130.563 1 130.563 27.48 0.000a
Residual 156.792 33 4.751
Total 287.355 34
Regression 166.912 2 83.4560 22.173 0.000b
Residual 120.443 32 3.7640
Total 287.355 34
a. Predictors: (Constant), Ash content
b. Predictors: (Constant), Ash content, potasium c. Dependent variable: Field moisture
Table 8. Modelling of incinerator coefficient Coefficientsa
--- Unstandardized coefficients Standardized coefficients
--- ---
Model B Std. Error Beta t Sig.
1 (Constant) 21.910 0.660 33.207 0.0000
Ash content -0.326 0.062 -0.674 -5.242 0.0000
2 (Constant) 22.885 0.666 34.376 0.0000
Ash content -0.291 0.057 -0.602 -5.156 0.0000
Potasium -0.002 0.001 -0.363 -3.108 0.0040
a. Dependent variable: Field moisture
4. DISCUSSION OF INCINERATOR
According to quality and quantity of solid waste management in Langkawi Island (Shamshiry et al., 2012) and also based on land scarcity, climatology and geo-morphology in the area as well as the importance of the tourism industry in Langkawi Island, more attention should be paid to make incineration compliant to the standard procedure as it is being used in solid waste management in the Langkawi. Figure 12 shows the incinerator in study area. The results have shown that a large amount of the collected materials in Langkawi’s solid waste is non-combustible and their disposal in a landfill causes pollution and a danger to the environment and eco-tourism.
The results have also shown that burning waste in incinerators caused some amount of air pollution and this can have direct effect on human health and increases environmental risk. This is because there is no total control of the various contaminants released by incinerators. The site of the incinerators is becoming unsuitable due to the increasing population and need for settlements.
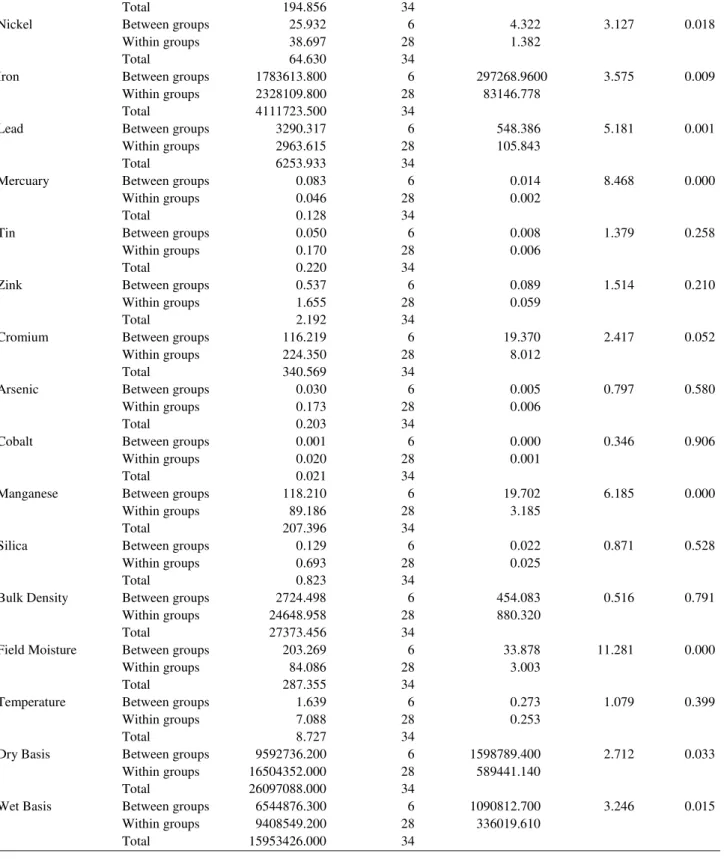
Table 9. Total ANOVA result of incinerator in Langkawi Island ANOVA
---
Sum of squares df Mean square F Sig.
Total moisture Between groups 817.543 6 136.25700 2.211 0.072
Within groups 1725.638 28 61.63000
Total 2543.181 34
Volatile matter Between groups 287.269 6 47.87800 2.874 0.026
Within groups 466.470 28 16.66000
Total 753.739 34
Ash content Between groups 909.537 6 151.5900 13.383 0.0000
Within groups 317.156 28 11.3270
Total 1226.693 34
Fixed carbon Between groups 392.136 6 65.3560 3.226 0.015
Within groups 567.298 28 20.2610
Total 959.434 34
Carbon Between groups 727.113 6 121.1850 4.598 0.002
Within groups 737.968 28 26.3560
Total 1465.08 34
Hydrogen Between groups 3.352 6 0.55900 0.712 0.643
Within groups 21.959 28 0.78400
Total 25.311 34
Nitrogen Between groups 10.847 6 1.80800 8.635 0.000
Within groups 5.862 28 0.20900
Total 16.709 34
Sulfur Between groups 0.015 6 0.00200 0.555 0.762
Within groups 0.124 28 0.00400
Total 0.138 34
Chlorine Between groups 0.421 6 0.07000 0.997 0.446
Within groups 1.970 28 0.07000
Total 2.391 34
Oxygen Between groups 277.416 6 46.23600 1.401 0.249
Within groups 924.210 28 33.00800
Total 1201.627 34
Sodium Between groups 15368922.000 6 2561486.90000 5.752 0.001
Within groups 12468017.000 28 445286.33000
Total 27836939.000 34
Potasium Between groups 3529310.900 6 588218.48000 3.17 0.017
Within groups 5195663.800 28 185559.42000
Total 8724974.700 34
Calcium Between groups 1923458.800 6 320576.47000 3.275 0.014
Within groups 2741199.300 28 97899.97400
Total 4664658.100 34
Cadmium Between groups 0.031 6 0.00500000 2.109 0.084
Within groups 0.068 28 0.00200000
Total 0.099 34
Copper Between groups 57.271 6 9.545000000 1.22 0.325
Within groups 218.998 28 7.82100000
Total 276.269 34
Aluminium Between groups 24.505 6 4.08400000 0.671 0.674
Table 9. Continued……
Total 194.856 34
Nickel Between groups 25.932 6 4.322 3.127 0.018
Within groups 38.697 28 1.382
Total 64.630 34
Iron Between groups 1783613.800 6 297268.9600 3.575 0.009
Within groups 2328109.800 28 83146.778
Total 4111723.500 34
Lead Between groups 3290.317 6 548.386 5.181 0.001
Within groups 2963.615 28 105.843
Total 6253.933 34
Mercuary Between groups 0.083 6 0.014 8.468 0.000
Within groups 0.046 28 0.002
Total 0.128 34
Tin Between groups 0.050 6 0.008 1.379 0.258
Within groups 0.170 28 0.006
Total 0.220 34
Zink Between groups 0.537 6 0.089 1.514 0.210
Within groups 1.655 28 0.059
Total 2.192 34
Cromium Between groups 116.219 6 19.370 2.417 0.052
Within groups 224.350 28 8.012
Total 340.569 34
Arsenic Between groups 0.030 6 0.005 0.797 0.580
Within groups 0.173 28 0.006
Total 0.203 34
Cobalt Between groups 0.001 6 0.000 0.346 0.906
Within groups 0.020 28 0.001
Total 0.021 34
Manganese Between groups 118.210 6 19.702 6.185 0.000
Within groups 89.186 28 3.185
Total 207.396 34
Silica Between groups 0.129 6 0.022 0.871 0.528
Within groups 0.693 28 0.025
Total 0.823 34
Bulk Density Between groups 2724.498 6 454.083 0.516 0.791
Within groups 24648.958 28 880.320
Total 27373.456 34
Field Moisture Between groups 203.269 6 33.878 11.281 0.000
Within groups 84.086 28 3.003
Total 287.355 34
Temperature Between groups 1.639 6 0.273 1.079 0.399
Within groups 7.088 28 0.253
Total 8.727 34
Dry Basis Between groups 9592736.200 6 1598789.400 2.712 0.033
Within groups 16504352.000 28 589441.140
Total 26097088.000 34
Wet Basis Between groups 6544876.300 6 1090812.700 3.246 0.015
Within groups 9408549.200 28 336019.610
Table 10. Total moisture analysis by post hoc tests Total moisture
---
Duncana Subset for alpha = 0.05
--- ---
T N 1 2
6 5 51.374
3 5 55.590 55.590
5 5 56.190 56.190
1 5 58.194 58.194
7 5 58.312 58.312
2 5 65.506
4 5 65.566
Sig. 0.222 0.086
Means for groups in homogeneous subsets are displayed a. Uses harmonic mean sample size = 5.000
Table 11. Simple statistical analysis on the heavy metals contents in MSW samples from Langkawi Island Concentration (mg/kg)
---
Parameter Minimum Mean Maximum
Sodium (Na) 246.5 1,279.300 3,008.000
Potassium(K) 76.2 615.100 1,978.000
Calcium (Ca) 36.51 374.370 1,726.000
Cadmium (Cd) ND 0.105 0.238
Copper (Cu) ND 3.072 10.920
Aluminium (Al) 0.519 3.227 9.040
Nickel (Ni) ND 1.588 5.610
Iron (Fe) 48.140 410.600 1,364.000
Lead (Pb) 0.530 12.560 45.040
Mercury (Hg) 0.013 0.106 0.218
Tin(Sn) ND* 0.071 0.110
Zinc (Zn) ND 0.297 1.020
Chromium (Cr) ND 3.651 11.030
Arsenic (As) ND 0.082 0.124
Cobalt (Co) ND 0.069 0.142
Manganese (Mn) 0.109 2.546 9.240
*ND =No Data Source: MHLG 2009
Fig. 4. Dry basis of ash in different sampling of incinerator in Langkawi Island
Fig. 5. Potassium in different ash sampling of incinerator in Langkawi Island
Fig. 6. Sodium in different ash sampling of incinerator in Langkawi Island
Fig. 7. Nitrogen in different ash sampling of incinerator in Langkawi Island
Fig. 8. Carbon in different ash sampling of incinerator in Langkawi Island
Fig. 10. Dendrogram generated by using the UPGMA clustering method of 7 Stations. Of incinerator produced content, according to every calculated under the same situation of survey. Red color shows the high rate of the traits examined at the same time as, green color indicates a low rate. The shading demonstrates the trait strength, wherein the bright colors have higher values than those shadows. The indicator box under the dendrogram displays the amount of accession and the cutting spot represents the quantity of clusters as shown in mentioned Fig. 11
Fig. 12. Site of an incinerator in Langkawi Island Source: Taken by Elmira Shamshiry, 2 Feb 2011
Fig. 13. Statistical analysis of the proximate constituents of MSW samples from Langkawi Island Source: MHLG (2009)
As mentioned in Fig. 13, the amount of volatile matter minimum is 62.55% compared to the fixed carbon of 3.36%, ash is 14.37% and also moisture is 35.81%. The minimum composition of the fixed carbon is 14.36% while volatile matter is 81.7%. Figure 14 displays the amount of minimum and maximum carbons in the ultimate constituents of MSW sample from the incinerator examined in Langkawi is higher than hydrogen, nitrogen, sulphur, oxygen and ash (Table 11).
5. CONCLUSION
As a result of scarcity of land, increasing population in recent years and also increasing tourist population (national and international tourists), an effective incinerator activity must be seen as one crucial aspect of solid waste management in Langkawi Island. Extra care is required to control gases and harmful suspended solids that are released from the incinerators. Untimely and inappropriate opening of the combustion chamber door, exorbitance blowing and improper use of the installed air pollution control devices contribute to the release of harmful gases that contaminant the quality of the air of the surrounding areas. When these measures are carefully implemented with regard to standard procedure of the incinerators, this will boost achieving the objective of especially good air quality and sustainable integrated solid waste management in Langkawi Island, befitting the status of a tourist hub and Geopark in Malaysia.
Investigating the use of incinerator in relation to observing the regulations or procedures and the adverse impacts associated with the misuse of incinerator would enrich the literature and knowledge about solid waste treatment in the landfills.
6. REFERENCES
Adzimah, S.K. and S. Anthony, 2009. Design of garbage sorting machine. Am. J. Eng. Applied Sci., 2: 428-437. DOI:10.3844/ajeassp.2009.428.437
Batterman, S., 2004a. Assessment of small-scale incinerators for health care waste. World Health Organization, Geneva, Switzerland. University of Michigan.
Batterman, S., 2004b. Findings on assessment of small-scale incinerators for healthcare waste. World Health Organization, Geneva, pp: 1-65.
Bodenan, F. and P. Deniard, 2003. Characterization of flue gas cleaning residues from European solid waste incinerators: Assessment of various Ca-based sorbent processes. Chemosphere, 51: 335-347. DOI: 10.1016/S0045-6535(02)00838-X
Brna, T.G. and J.D. Kilgroe, 1989. Control of PCDD/PCDF Emissions from municipal waste combustion systems. Proceedings of the 9th International Symposium on Chlorinated Dioxins and Related Compounds, Sept. 17-22, Toronto, Canada, pp: 1875-1882. 10.1016/0045-6535(90)90355-W
Charkhabi, A.H. and M. Sakizadeh, 2006. Assessment of spatial variation of water quality parameters in the most polluted branch of the Anzali Wetland, Northern Iran. Polish. J. Environ. Stud., 15: 395-403.
Christensen, T.R., 2010. Wetlands. In: Methane and Climate Change, Reay, D., P. Smith and A. van Amstel (Eds.), Earthscan Ltd. London, UK, ISBN-10: 1849775095, pp: 27-42.
Dong, J., Y. Fan, X. Gui, X. An and J. Ma et al., 2008. Geographic distribution and genetic analysis of physiological racesof setosphaeria turcica in Northern China. Am. J. Agric. Biological Sci., 3: 389-398.
Imoobe, T.O.T. and P.I.O. Koye, 2011. Assessment of the impact of effluent from a soft drink processing factory on the physico-chemical parameters of Eruvbi Stream Benin City, Nigeria. Bayero. J. Pure Applied Sci., 4: 126-134.
Malhotra, N.K., 2004. Marketing Research: An Applied Orientation. 4th Edn., Pearson Education, Inc., New Jersey, ISBN-10: 0-13-033716-1, pp: 864.
MHLG, 2009. Municipal Solid Wastes (MSW) characterization study for design and development of an incinerator at Pulau Langkawi, Kedah, Darul Aman. Ministry of Housing and Local Government. Perumal, Y., M. Marimuthu, A.P. Salim and B.
Ponnusamy, 2009. Host plant mediated population variations of cotton whitefly bemisia tabaci gennadius (Aleyrodidae: Homoptera) characterized with random DNA markers. Am. J. Biochem. Biotechnol., 5: 40-46.
Shamshiry, E., B. Nadi, M.B. Mokhtar, I. Komoo and H.S. Hashim et al., 2012. Impact of landfill leachate on water quality in Langkawi Island using management of environmental system. Asian J. Chem., 24: 1919-1923.
Sharma, S., 1996. Applied Multivariate Techniques. 1st Edn., John Willey and Sons, ISBN-10: 0471310646, pp: 493.
Takdastan, A., A. Bagherpoor, N. Poor Amini and S. Giveh Chi, 2005. Evaluation the risks of air pollution from incinerator to burn of different waste and pollution control methods produced by incinerator. Air pollution and its effect on health seminar. Institute for studies of clean environmental, Tehran.
Talei, D., M.K. Yusop, M.A. Kadir, A. Valdiani and M.P. Abdullah, 2012. Response of king of bitters (Andrographis paniculata Nees.) seedlings to salinity stress beyond the salt tolerance threshold. Aus. J. Crop Sci., 6: 1059-1067.
Themelis, N.J., Y.H. Kim and M.H. Brady, 2002. Energy recovery from New York City municipal solid wastes. Waste Manage. Res., 20: 223-233. DOI: 10.1177/0734242X0202000303
Thompson, J. and H. Anthony, 2005. The health effects of waste incinerators. Brit. Society Ecological Med., 15: 115-156. DOI: 10.1080/13590840600554685
Towned, J., 2012. Practical Statistics for Environmental and Biological Scientists. 1st Edn., John Willey and Sons, Hoboken, ISBN-10: 1118687418, pp: 272. Taylor, J.R., 2003. Linguistic Categorization. 3rd Edn.,
Oxford University Press,ISBN-10: 0191608386, pp: 328.
U.S. EPA, 1990. Emissions Inventory of Section 112 (c)(6) Pollutants: Final Report-Appendix A. U.S. EPA. UNEP, 2003. Standardized toolkit for identification and
quantifications of dioxin and furan releases. United Nations Environment Programme, UNEP Chemicals, Geneva, Switzerland.
Yee, C.J. and N.C. San, 2011. Consumers’ perceived quality, perceived value and perceived risk towards purchase decision on automobile. Am. J. Econom. Bus.
Administrat., 3: 47-57. DOI:
10.3844/ajebasp.2011.47.57