ORIGINAL ARTICLE
Components of the metabolic syndrome and depressive
symptoms in community-dwelling older people: the
Bambuı´ Cohort Aging Study
Luiz Gustavo Ruas,
1Breno S. Diniz,
2Jose´lia O. Firmo,
1Se´rgio V. Peixoto,
1Juliana V. Mambrini,
1Antoˆnio Igna´cio de Loyola-Filho,
1,3Maria Fernanda Lima-Costa,
1,4E
´ rico Castro-Costa
11Centro de Pesquisas Rene´ Rachou, Fundac
¸a˜o Oswaldo Cruz, Belo Horizonte, MG, Brazil.
2Department of Psychiatry and Behavioral
Sciences and Consortium on Aging, The University of Texas Health Science Center at Houston, Houston, TX, USA.3Faculdade de Enfermagem, Universidade Federal de Minas Gerais (UFMG), Belo Horizonte, MG, Brazil.4Faculdade de Medicina, UFMG, Belo Horizonte, MG, Brazil.
Objective: To investigate the moderating effect of an increasing number of clustered metabolic syndrome (MetS) components on the association between MetS and depressive symptoms in a population-based cohort of older adults in Brazil.
Methods: This analysis used data from the Bambuı´ Cohort Aging Study. Participants in this cross-sectional study comprised 1,469 community-dwelling older people agedX60 years. Analyses
were performed to assess both the association between depressive symptoms and each individual MetS component and the association between depressive symptoms and clustering of an increasing number of MetS components.
Results:High triglyceride level was the individual component that showed the strongest association with depressive symptoms (odds ratio [OR]: 1.47; 95% confidence intervals [95%CI] 1.19-1.81; po0.0001). Only the presence of three MetS components was associated with depressive symptoms
(OR = 1.53; 95%CI 1.05-2.23; p = 0.025). No graded association was detected between increasing number of clustered MetS components and depressive symptoms.
Conclusions: Increasing the number of MetS components did not impact the association with depressive symptoms. The association between high triglyceride level and depressive symptoms highlights the relevance of lipid metabolism abnormalities for the emergence of depressive symptoms in older adults.
Keywords: Metabolic syndrome; depressive symptoms; elderly; population-based
Introduction
The metabolic syndrome (MetS) is a complex disorder that is broadly defined by the presence of abdominal obesity, high blood pressure, HDL cholesterol, elevated triglycerides, and hyperglycemia. It is associated with increased risk of subclinical atherosclerosis, cardiovas-cular disease (CVD), diabetes, and mortality.1,2 In the past decades, several studies have reported a significant association between the MetS and depression among young3,4 and older adults.5-11 A recent meta-analysis indicates that the relationship between the MetS and depression is probably bidirectional.12
There is little information on how the number of MetS components relates to depressive symptoms, an aspect which is not usually investigated as a primary outcome. Different studies have reported a positive trend toward the association between the number of MetS components and
depression in young and older adults.5,10,13-15 However, a significant association between MetS components and depressive symptoms has not been detected.6,9
To the best of our knowledge, there have been no studies focusing on the moderating effect of increasing number of MetS components on the association between MetS and depressive symptoms in population-based studies including older adults. The aim of the present study was to investigate this aspect in a population-based cohort of older adults in Brazil.
Methods
Study area and population
This analysis used data from the Bambuı´ Cohort Aging Study, a population-based prospective cohort study of aging carried out in Bambuı´, Brazil (approximately 15,000 inhabitants). The original goal of the Bambuı´ study was to investigate the incidence and predictors of health out-comes in an elderly population with low socioeconomic status.16
The recruitment and procedures have been described in detail elsewhere.16 Briefly, the baseline population Correspondence: E´ rico Castro-Costa, Laborato´rio de Epidemiologia
e Antropologia Me´dica, Centro de Pesquisas Rene´ Rachou/Fiocruz, Av, Augusto de Lima, 1715/6o
andar, CEP 30190-002, Belo Horizonte, MG, Brazil.
E-mail: [email protected]
Submitted Nov 15 2015, accepted Jan 06 2016.
Associac¸a˜o Brasileira de Psiquiatria
comprised all residents aged 60 years and over on January 1, 1997, identified by a population census carried out in November and December 1996 by the research team. Of 1,742 older residents in Bambuı´, 1,606 (92.2%) participated in the baseline survey. Baseline data collec-tion was carried out from February to May 1997. All interviews were conducted in the participants’ homes. Clinical assessment (blood pressure and anthropometric measures) and collection of blood samples were per-formed at the project’s health clinic. Neither interviewers nor participants were aware of clinical results at the time of the interview. The Bambuı´ cohort was approved by the Ethics Committee of the Oswaldo Cruz Foundation, Brazil. All participants were informed about the objectives and procedures of the project and gave written informed consent.
Depressive symptoms
Depressive symptoms were ascertained using the 12-item version of the General Health Questionnaire (GHQ-12), translated and validated for Brazilian Portuguese for use with elderly populations. It shows similar accuracy as that of the 30-item Geriatric Depression Scale (GDS) for the identification of depressive symptoms.17 For statistical models, depressive symptoms were stratified in tertiles and each tertile was entered as an ordinal variable.
MetS components
MetS features were defined according to the Adult Treatment Panel III of the National Cholesterol Education Program (ATPIII-NCEP)18: abdominal obesity (waist circumference X 102 cm in men or X 88 in women),
hypertriglyceridemia (triglyceride levelX150 mg/dl or use of hypolipidemic medications), low HDL cholesterol
(o 40 mg/dL in men or o 50 mg/dL in women),
high blood pressure (systolic/diastolic blood pressure
X130/X85 mmHg, and/or current use of
anti-hyperten-sive medication), and high fasting glucose (X110 mg/dL
and/or current use of anti-diabetic medication).
Other covariates
Sociodemographic
We collected data on sociodemographic variables (age, gender, years of schooling, and monthly family income). Monthly family income was determined based on the Brazilian minimum wage at the time of assessment. Subjects were classified according to the number of monthly minimum wages (o2.00, 2.00-3.99, 4.00-9.99, and49.99).
Lifestyle characteristics
Participants were asked about the following lifestyle characteristics: alcohol consumption (drinking at least one glass of alcohol per week in the previous 12 months), smoking habits, and regular physical activity. Current smokers were those who had smoked at least 100 cigarettes during their lifetime and were currently
smoking. Regular physical activity was defined as any exercise during leisure time for at least 20-30 minutes at least three times a week in the previous 90 days.
Cognitive functioning
This aspect was assessed by the Mini-Mental State Examination using a cutoff point of 21/22 to define cognitive impairment.19,20
Biological variables
Trypanosoma cruziinfection was defined by seropositivity in
both indirect hemagglutination assay and enzyme-linked immunosorbent assay (bioMe´rieux, Rio de Janeiro, Brazil, and Abbott Chicago, USA, respectively). Information on lifetime history of stroke was obtained by interview as previously reported.16C-reactive protein was determined by immunoturbidimetry (Siemens, Marburg, Germany). Brain natriuretic peptide was measured using a microparticle-based immunoassay (MEIA/AxSYM; Abbott, Chicago, USA) (lower limit of detection: o15 pg/mL; mean interassay coefficient of variation: 12%). Plasmatic creatinine and urea were measured using enzymatic method (Eclipse Vitalab; Merck, Amsterdam, The Netherlands).
Current use of psychoactive drugs
Current use of psychoactive drugs (antidepressant, anti-psychotics, and hypnotic/sedative medication) was defined as intake of any number of pills in the last month.
Statistical analysis
Analysis of variance (ANOVA), the Kruskal-Wallis test (for continuous variables), and the Pearson’s chi-square test (for categorical variables) were used to compare char-acteristics of participants according to tertile distribution of depressive symptoms based on the GHQ-12. Cuzick’s non-parametric test of trends across ordered groups (an extension of the Wilcoxon rank-sum test21) was used to explore the relationship between individual/clusters of MetS components and depressive symptoms.
Ordinal logistic regression models were developed to assess the association between depressive symptoms and the number of MetS components. These analyses were based on four models. First, we estimated the unadjusted association between number of MetS components and depressive symptoms, and then each of these models was adjusted incrementally for: 1) sociodemographic variables, 2) lifestyle character-istics, and 3) cognitive functioning, biological variables, and current use of psychoactive drugs. The same
procedures were used to evaluate associations
Results
Characteristics of the study population and unadjusted analysis of covariates
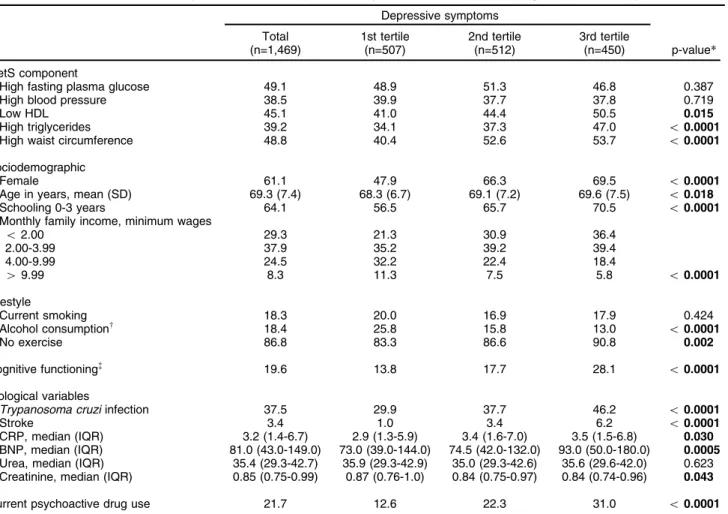
Clinical and sociodemographic characteristics are sum-marized in Table 1. Of the 1,606 baseline participants, data on all study variables were available for 1,469. Considering the group with a complete data set, mean age (standard deviation) was 69.3 (7.4) years, most were female (61.1%), had less than four years of schooling (64.1%), and had family income below 4.0 minimum wages (67.2%).
Trend analysis of individual MetS components and MetS component clusters according to depressive symptom tertiles
There was a positive association between depressive symptoms and low HDL, high triglycerides, high waist circumference, and clusters of MetS components, with a
consistent and statistically significant trend for these variables (Table 2).
Odds ratios for depressive symptoms for individual MetS components and clusters of components
The unadjusted and fully adjusted odds ratios (OR) for the association between each individual MetS component and depressive symptoms appear in Table 3. In the unadjusted analysis, higher waist circumference (OR = 1.49; 95%CI 1.23-1.80; po0.0001), low HDL (OR = 1.32; 95%CI 1.09-1.60; p = 0.004), and higher triglycer-ides (OR = 1.49; 95%CI 1.22-1.81; p o 0.0001) were associated with depressive symptoms. However, in the final model, statistical significance was retained only for the association of higher triglycerides (OR = 1.47; 95%CI 1.19-1.81; po0.0001) with depressive symptoms.
Table 3 shows the unadjusted and fully adjusted ORs obtained for the association between individual and clustered MetS components (as continuous and ordered
Table 1 Characteristics of the study sample and unadjusted analysis of covariates according to depressive symptom tertile
Depressive symptoms
Total (n=1,469)
1st tertile (n=507)
2nd tertile (n=512)
3rd tertile
(n=450) p-value*
MetS component
High fasting plasma glucose 49.1 48.9 51.3 46.8 0.387
High blood pressure 38.5 39.9 37.7 37.8 0.719
Low HDL 45.1 41.0 44.4 50.5 0.015
High triglycerides 39.2 34.1 37.3 47.0 o0.0001
High waist circumference 48.8 40.4 52.6 53.7 o0.0001
Sociodemographic
Female 61.1 47.9 66.3 69.5 o0.0001
Age in years, mean (SD) 69.3 (7.4) 68.3 (6.7) 69.1 (7.2) 69.6 (7.5) o0.018
Schooling 0-3 years 64.1 56.5 65.7 70.5 o0.0001
Monthly family income, minimum wages
o2.00 29.3 21.3 30.9 36.4
2.00-3.99 37.9 35.2 39.2 39.4
4.00-9.99 24.5 32.2 22.4 18.4
49.99 8.3 11.3 7.5 5.8 o0.0001
Lifestyle
Current smoking 18.3 20.0 16.9 17.9 0.424
Alcohol consumptionw
18.4 25.8 15.8 13.0 o0.0001
No exercise 86.8 83.3 86.6 90.8 0.002
Cognitive functioning=
19.6 13.8 17.7 28.1 o0.0001
Biological variables
Trypanosoma cruziinfection 37.5 29.9 37.7 46.2 o0.0001
Stroke 3.4 1.0 3.4 6.2 o0.0001
CRP, median (IQR) 3.2 (1.4-6.7) 2.9 (1.3-5.9) 3.4 (1.6-7.0) 3.5 (1.5-6.8) 0.030 BNP, median (IQR) 81.0 (43.0-149.0) 73.0 (39.0-144.0) 74.5 (42.0-132.0) 93.0 (50.0-180.0) 0.0005 Urea, median (IQR) 35.4 (29.3-42.7) 35.9 (29.3-42.9) 35.0 (29.3-42.6) 35.6 (29.6-42.0) 0.623 Creatinine, median (IQR) 0.85 (0.75-0.99) 0.87 (0.76-1.0) 0.84 (0.75-0.97) 0.84 (0.74-0.96) 0.043
Current psychoactive drug use 21.7 12.6 22.3 31.0 o0.0001
Data presented as %, unless otherwise stated. Values for depressive symptoms and age are expressed as mean (SD).
BNP = brain natriuretic peptide; CRP = C-reactive protein; IQR = interquartile range (25th and 75th percentile); MetS = metabolic syndrome; SD = standard deviation.
*p-value = ANOVA, test for trend, and Kruskal-Wallis test for differences between means, frequencies, and medians respectively. w
At least one glass/week in the previous 12 months. =Mini-Mental State Examination score
variables) and depressive symptoms. In the unadjusted model, clustered components analyzed as a continuous variable were associated with depressive symptoms (OR = 1.12; 95%CI 1.04-1.20; p = 0.001), but in the fully adjusted model this association was marginal (OR = 1.08; 95%CI 0.99-1.16; p = 0.058). The presence of three MetS components was significantly associated with depressive symptoms in both unadjusted (OR = 1.60; 95%CI 1.13-2.26; p = 0.008) and fully adjusted (OR = 1.53; 95%CI 1.05-2.23; p = 0.025) models. The interaction of gender, cognitive impairment, and current use of psychoactive drugs with MetS clusters including 0, 1, 2, 3, 4 or 5 MetS components (analyzed as ordered variables) was tested in the final model. The heterogeneity was not statistically significant between genders (likelihoodw2= 1.76; degree
of freedom [df] = 5; p = 0.88), those with/without cognitive impairment (likelihood w2= 7.53; df = 5; p = 0.18), and
current users/non-users of psychoactive drugs (likelihood
w2= 4.87; df = 5; p = 0.43).
In addition, in participants with four or five MetS components, an association was found with depressive symptoms in the unadjusted model (OR = 1.41; 95%CI 1.00-2.00; p = 0.050), but not in the fully adjusted model (OR = 1.19; 95%CI 0.81-1.74; p = 0.368). The unadjusted and fully adjusted OR of the association between the cluster of components defining MetS (presence of three or more symptoms) and depressive symptoms were 1.39(95%CI 1.14-1.69; p = 0.001) and 1.31(95%CI 1.05-1.63; p = 0.014), respectively (data not shown).
Brant test for parallel lines was performed to test for proportionality of OR and p-value. p-value was above 0.05 for all models, indicating the appropriateness of the ordered logistic regression.
Discussion
In the present study, we found that only a cluster of three MetS components is associated with depressive symp-toms, and that there is no graded association between increasing number of MetS components and depressive symptoms. High triglyceride level was the individual component that showed the strongest association with depressive symptoms among all MetS components. To
the best of our knowledge, this is the first study investigating the association between increasing number of clustered MetS components and depressive symptoms as well as the impact of individual MetS components on depressive symptoms in a population-based study of older adults.
Several community-based studies have investigated the association between MetS and depressive symptoms in the elderly,6,8,9,11,22,23 and in most this association was confirmed.6,11,22,23 However, some studies have not detected an association between MetS and depression.8,9 This contradiction may be explained at least in part by methodological differences, particularly concerning the assessment of depressive symptoms, definition of depres-sion cases, evaluation of each component of the MetS (e.g., objective laboratorial blood assessments or self-reported risk factors). Another possible explanation is the use of different diagnostic criteria for MetS and the statistical method employed.
Regarding the association between increasing number of clustered MetS components and depressive symptoms in the elderly, few studies have investigated this aspect, with inconsistent results.5,6,9,10 Roriz-Cruz et al.5 investi-gated the association between MetS and depression in a sample of 420 individuals aged 60 years or above from two communities in southern Brazil. They found significantly worse scores for GDS as the number of clustered MetS components increased in the stroke-free population using an ANOVA. Viscogliosi et al.,10 investigating the preva-lence of depressive symptoms in 133 older patients (mean age of 68.9 years) receiving a medical check-up in Rome, demonstrated a strong linear correlation of depressive symptoms defined by GDS with number of MetS compo-nents in the univariate analysis. An American study of 2,917 persons aged 70-79 years, assessing depressive symptoms using Center of Epidemiologic Studies Depres-sion (CES-D) scores as a continuous variable, found no linear correlation of depressive symptoms with number of components after adjustment for confounding variables.6 Finally, another study examining a community-based sample of 823 participants aged 65 years and over in two sites in Italy demonstrated no association between number of MetS components and onset of depression
Table 2 Individual MetS components and clusters of MetS components according to tertile of depressive symptoms
n 1st tertile 2nd tertile 3rd tertile p-value*(trend)
Component
High fast plasma glucose 721 34.4 36.2 29.4 0.534
High blood pressure 565 35.9 33.9 30.2 0.490
Low HDL 662 31.3 34.2 34.5 0.004
High triglycerides 576 30.0 33.0 37.0 o0.001
High waist circumference 717 28.2 37.8 34.0 o0.001
Clustered components
0 192 41.2 30.2 28.6
1 339 37.6 38.6 23.8
2 354 35.6 32.9 31.5
3 299 30.4 31.8 37.8
4 202 28.7 42.6 28.7
5 83 31.2 30.0 38.8 0.001
MetS = metabolic syndrome.
(measured by CES-D) in persons who were not depressed at baseline.9
In our study, the number of MetS components was treated as both continuous and ordered variables. In the univariate analysis, both coding procedures (continuous or ordered) of MetS components were associated with depressive symptoms. However, in the multivariate ana-lysis, only the presence of three clustered components was associated with depressive symptoms. Treating the number of components of MetS as a measure of an underlying continuous value means that a one-unit variation has the same effect regardless of the value measured for the independent variable (in this case, depressive symptom tertile), that is, the effect of a one-unit variation would be the same for the first or third tertile of depressive symptoms. However, there is evidence that increasing the number of MetS components does contribute to the development of diabetes and CVD.24,25 Thus, determining the number of components of MetS as an ordered variable is more appropriate to assess the graded association between MetS and depressive symp-toms, since moving from one category to another may differ depending of number of components of MetS.
There is variation between studies from different parts of the world concerning the frequency of individual compo-nents of MetS.26Our findings were consistent with the range of prevalence of individual components (defined by NCEP criteria) reported in a recent systematic review.26However, differently from that systematic review, we observed triglycerides as the most important individual component (77.8%), while high blood pressure had the lowest importance. Other conflicting results were also found in studies that investigated the association between individual
components of MetS and depression. In some studies, no association was found between any individual component and depression.5,11Yet other studies showed that low HDL, high blood pressure, high fasting glucose level, increased waist circumference, and obesity were associated with depressive symptoms.7-10Differences in sampling, region of residence, and variations in lifestyle can explain these inconsistent results.
Our study did not evaluate the biological mechanisms that link MetS and depression in older adults. The core pathophysiologic changes in MetS are insulin resistance syndrome and increased pro-inflammatory status.27Such abnormalities are also observed in depressed patients of all ages, and can be considered as a neurobiological link between MetS and depression.28,29It is interesting that in our study high triglyceride levels was the MetS compo-nent with the most significant association with depressive symptoms. This highlights the relevance of the emer-gence of depressive symptoms in older adults to ensue lipid metabolism abnormalities. In fact, recent data-driven studies showed that protein markers and biological pathways related to lipid metabolism are abnormally regulated in young and older adults with depression.30,31 Future studies are necessary to uncover the neurobiolo-gical links between MetS and depression and to develop more specific targets for prevention and treatment of depression in these subjects.
Strengths of our study include the investigation of the effect of number of clustered MetS components as an ordered variable on the association between MetS and depressive symptoms. Treating depressive symptoms as an ordered variable may reduce the loss of information due to categorizing it as binary outcome based on cutoff scores
Table 3 Ordered logistic regression analysis estimating the OR of individual MetS components and clusters of components for depressive symptoms
Unadjusted
Adjusted by sociodemographic status*
Adjusted by sociodemographic status and lifestylew
Fully adjusted model=
Individual components
High fasting plasma glucose 0.94 (0.77-1.14) 0.93 (0.76-1.12) 0.95 (0.78-1.15) 0.94 (0.77-1.16) High blood pressure 0.93 (0.76-1.13) 0.94 (0.77-1.15) 0.96 ( 0.79-1.18) 0.94 (0.76-1.16) Low HDL 1.32 (1.09-1.60)y
1.25 (1.02-1.52)y
1.22 (1.00-1.49)y
1.17 (0.95-1.45) High triglycerides 1.49 (1.22-1.81)8
1.47 (1.20-1.80)8
1.48 (1.21-1.82)8
1.47 (1.19-1.81)8
High waist circumference 1.49 (1.23-1.80)8
1.18 (0.95-1.46) 1.19 (0.95-1.47) 1.19 (0.94-1.51)
Clustered components
Continuous 1.12 (1.04-1.20)y
1.07 (1.00-1.18)y
1.08 (1.01-1.16)y
1.08 (0.99-1.16) Ordered
0 1.00 1.00 1.00 1.00
1 0.99 (0.70-1.39) 0.93 (0.66-1.32) 0.93 (0.66-1.32) 0.96 (0.67-1.38) 2 1.22 (0.87-1.71) 1.10 (0.78-1.56) 1.13 (0.80-1.60) 1.10 (0.77-1.59)
3 1.60 (1.13-2.26)y
1.48 (1.03-2.13)y
1.52 (1.05-2.18)y
1.53 (1.05-2.23)y
4 1.34 (0.93-1.95) 1.11 (0.75-1.64) 1.14 (0.77-1.69) 1.16 (0.77-1.75) 5 1.61 (0.98-2.63) 1.29 (0.77-2.16) 1.32 (0.79-2.20) 1.25 (0.74-2.13)
MetS = metabolic syndrome.
*Gender, age, schooling, and monthly family income. w
Current smoking, alcohol consumption, and no exercise. =
Adjusted by sociodemographic status, lifestyle, cognitive functioning (Mini-Mental State Examination score), biological variables (Trypanosoma cruzi infection, creatinine, urea, brain natriuretic peptide, C-reactive protein, and stroke), and current use of psychoactive drugs.
y
po0.05.
8
and increase the statistical power of analysis. In addition, the large sample, the high response rate, information on current use of psychoactive use, and the large numbers of measurements allowing a range of potential confounding factors to be taken into account should be highlighted.
However, the study has limitations. First, we did base our measure of depression on a structured psychiatric interview, but on a self-report symptom scale. Although measures of depression based on a structured psychiatric interview are desirable, their incorporation into community-based epidemiological studies poses substantial logistical challenges and self-report measures remain the most widely used instruments in these studies.5,6,9,11 Second, MetS was defined according to the ATP III-NCEP criteria, even if others definitions exist. Nevertheless, a recent meta-analysis did not find significant differences between the use of different criteria for MetS (ATP-III-A, ATP-III, International Diabetes Federation, and World Health Organization definitions).32In addition, the ATP III-NCEP is the most widely used definition of MetS, and using it facilitates the comparison of the present results with those of others studies. Third, residual confounding is a possibility, despite the control for a large number of factors.
Acknowledgements
This work was supported by grants from Conselho Nacional de Desenvolvimento Cientı´fico e Tecnolo´gico (CNPq; grants 301056/94-3, 14974/97-8, 572208/97-9) and Financiadora de Estudos e Projetos (FINEP; grant 6694009-00), Brazil. EC-C is supported by Programa Nacional de Po´s-Doutorado em Sau´de (PNDS). LGR is supported by Programa de Apoio e` Po´s-Graduac¸a˜o
(PROAP). JOF, SVP, and MFL-C are CNPq fellows. BSD receives research support from the John A. Hartford Foundation and Intramural Grant from Universidade Federal de Minas Gerais (UFMG).
Disclosure
The authors report no conflicts of interest.
References
1 Bayturan O, Tuzcu EM, Lavoie A, Hu T, Wolski K, Schoenhagen P, et al. The metabolic syndrome, its component risk factors, and progression of coronary atherosclerosis. Arch Intern Med. 2010;170:478-84. 2 Mottillo S, Fillion KB, Genest J, Joseph L, Pilote L, Poirier P, et al. The
metabolic syndrome and cardiovascular risk: a systematic review and meta-analysis. J Am Coll Cardiol. 2010;56:1113-32.
3 Pulkki-Ra˚back L, Elovainio M, Kivimaki M, Mattsson N, Raitakari OT, Puttonen S, et al. Depressive symptoms and the metabolic syndrome in childhood and adulthood: a prospective cohort study. Health Psychol. 2009;28:108-16.
4 Akbaraly TN, Kivima¨ki M, Brunner EJ, Chandola T, Marmot MG, Singh-Manoux A, et al. Association between metabolic syndrome and depressive symptoms in middle-aged adults: results from the Whitehall II study. Diabetes Care. 2009;32:499-504.
5 Roriz-Cruz M, Rosset I, Wada T, Sakagami T, Ishine M, Roriz-Filho JS, et al. Stroke-independent association between metabolic syndrome and functional dependence, depression, and low quality of life in elderly community-dwelling Brazilian people. J Am Geriatr Soc. 2007;55:374-82.
6 Vogelzangs N, Beekman AT, Kritchevsky SB, Newman AB, Pahor M, Yaffe K, et al. Psychosocial risk factors and the metabolic syndrome
in elderly persons: findings from the Health, Aging and Body Composition study. J Gerontol A Biol Sci Med Sci. 2007;62:563-9. 7 Almeida OP, Calver J, Jamrozik K, Hankey GJ, Flicker L. Obesity and
metabolic syndrome increase the risk of incident depression in older men: the health in men study. Am J Geriatr Psychiatry. 2009 17:889-98.
8 Vogelzangs N, Beekman AT, Dik MG, Bremmer MA, Comijs HC, Hoogendijk WJ, et al. Late-life depression, cortisol, and the metabolic syndrome. Am J Geriatr Psychiatry. 2009;17:716-21.
9 Vogelzangs N, Beekman AT, Boelhouwer IG, Bandinelli S, Mila-neschi Y, Ferrucci L, et al. Metabolic depression: a chronic depres-sive subtype? Findings from the InCHIANTI study of older persons. J Clin Psychiatry. 2011;72:598-604.
10 Viscogliosi G, Andreozzi P, Chiriac IM, Cipriani E, Servello A, Mar-igliano B, et al. Depressive symptoms in older people with metabolic syndrome: is there a relationship with inflammation?. Int J Geriatr Psychiatry. 2013;28:242-7.
11 Morikawa M, Okamoto N, Kiuchi K, Tomioka K, Iwamoto J, Harano A, et al. Association between depressive symptoms and metabolic syndrome in Japanese community-dwelling older people: a cross-sectional analysis from the baseline results of the Fujiwara-kyo pro-spective cohort study. Int J Geriatr Psychiatry. 2013;28:1251-9. 12 Pan A, Keum N, Okereke OI, Sun Q, Kivimaki M, Rubin RR, et al.
Bidirectional association between depression and metabolic syn-drome: a systematic review and meta-analysis of epidemiological studies. Diabetes Care. 2012;35:1171-80.
13 Kinder LS, Carnethon MR, Palaniappan LP, King AC, Fortmann SP. Depression and the Metabolic Syndrome in young adults: findings from the Third National Health and Nutrition Examination Survey. Psychosom Med. 2004;66:316-22.
14 Hartley TA, Knox SS, Fekedulegn D, Barbosa-Leiker C, Violanti JM, Andrew ME, et al. Association between depressive symptoms and metabolic syndrome in police officers: results from two cross-sectional studies. J Environ Public Health. 2012;2012:861219-861219. 15 Roohafza H, Sadeghi M, Talaei M, Pourmoghaddas Z,
Sarrafzade-gan N. Psychological Status and quality of life in relation to the metabolic syndrome: Isfahan Cohort Study. Int J Endocrinol. 2012;2012:380902.
16 Lima-Costa MF, Firmo JO, Uchoa E. Cohort profile: the Bambui (Brazil) Cohort Study of Ageing. Int J Epidemiol. 2011;40:862-7. 17 Costa E, Barreto SM, Uchoa E, Firmo JO, Lima-Costa MF, Prince M.
Is the GDS-30 better than the GHQ-12 for screening depression in the elderly people in the community? The Bambui Health Aging Study (BHAS). Int Psychogeriatr. 2006;18:493-503.
18 Expert Panel on Detection, Evaluation, and Treatment of High Blood Cholesterol in Adults. Executive Summary of the Third Report of the National Cholesterol Education Program (NCEP) Expert Panel on Detection, Evaluation, and Treatment of High Blood Cholesterol in Adults (Adult Treatment Panel III). JAMA. 2001;285:2486-97. 19 Castro-Costa E, Fuzikawa C, Uchoa E, Firmo JO, Lima-Costa MF.
Norms for the Mini-mental state examination: adjustment of the cut-off point in population-based studies (evidences from the Bambui Health Aging Study). Arq Neuropsiquiatr. 2008;66:524-8.
20 Castro-Costa E, Fuzikawa C, Ferri C, Uchoa E, Firmo J, Lima-Costa MF, et al. Dimensions underlying the mini-mental state examination in a sample with low-educational levels: the Bambui health and aging study. Am J Geriatr Psychiatry. 2009;17:863-72.
21 Cuzick J. A Wilcoxon-type test for trend. Stat Med. 1985;4:87-90. 22 Vogelzangs N, Suthers K, Ferruccil L, Simonsick EM, Ble A, Schrager
M, et al. Hypercortisolemic depression is associated with the metabolic syndrome in late-life. Psychoneuroendocrinology. 2007;32:151-9. 23 Akbaraly TN, Ancelin ML, Jaussent I, Ritchie C, Barberger-Gateau P,
Dufouil C, et al. Metabolic syndrome and onset of depressive symptoms in the elderly: findings from the three-city study. Diabetes Care. 2011;34:904-9.
24 Klein BE, Klein R, Lee KE. Components of the metabolic syndrome and risk of cardiovascular disease and diabetes in Beaver Dam. Diabetes Care. 2002;25:1790-4.
26 Denys K, Cankurtaran M, Janssens W, Petrovic M. Metabolic syndrome in the elderly: an overview of the evidence. Acta Clin Belg. 2009;64:23-34.
27 Samson SL, Garber AJ. Metabolic syndrome. Endocrinol Metab Clin North Am. 2014;43:1-23.
28 Nousen EK, Franco JG, Sullivan EL. Unraveling the mechanisms responsible for the comorbidity between metabolic syndrome and mental health disorders. Neuroendocrinology. 2013;98:254-66. 29 McIntyre RS, Rasgon NL, Kemp DE, Nguyen HT, Law CW, Taylor VH,
et al. Metabolic syndrome and major depressive disorder: co-occurrence and pathophysiologic overlap. Curr Diab Rep. 2009;9:51-9.
30 Bot M, Chan MK, Jansen R, Lamers F, Vogelzangs N, Steiner J, et al. Serum proteomic profiling of major depressive disorder. Transl Psychiatry. 2015;5:e599.
31 Diniz BS, Sibille E, Ding Y, Tseng G, Aizenstein HJ, Lotrich F, et al. Plasma biosignature and brain pathology related to persistent cognitive impairment in late-life depression. Mol Psychiatry. 2015;20:594-601.