(1) Faculdade de Medicina de Ribeirão Preto, Universidade de São Paulo. Ribeirão Preto - SP. Brasil.
(2) Hospital das Clínicas de Ribeirão Preto, / Faculdade de Medicina de Ribeirão Preto/ Universidade de São Paulo. Ribeirão Preto - SP. Brasil. (3) Centro Integrado de Reabilitação do
Hospital Estadual de Ribeirão Preto / Faculdade de Medicina de Ribeirão Preto/ Universidade de São Paulo. Ribeirão Preto - SP. Brasil. (4) Universidade Tecnológica Federal do
Paraná. Cornélio Procópio – PR. Brasil Conlict of interest: non-existent
Speech perception test with pictures: applicability in children
with hearing impairment
Teste de percepção de fala com figuras: aplicabilidade em crianças
com deficiência auditiva
Veronica Batista Queiroz(1)
Nelma Ellen Zamberlan-Amorim(2)
Kele Jaqueline Pinotti(3)
Elisangela Aparecida da Silva Lizzi(4)
Ana Claudia Mirândola Barbosa Reis(1)
Received on: November 06, 2016 Accepted on: March 19, 2017
Mailing address:
Ana Cláudia Mirândola Barbosa Reis Departamento de Oftalmologia, Otorrinolaringologia e Cirurgia de Cabeça e Pescoço
Av. Bandeirantes, 3900, Monte Alegre, Ribeirão Preto- SP
CEP. 14049-900
E-mail: anaclaudia@fmrp.usp.br
ABSTRACT
Purpose: to verify the applicability of speech perception test with igures, developed by Souza and Reis (2015), in children with hearing loss.
Methods: an exploratory descriptive study. A total of 40 children, both sexes, aged between 2 and 11 years, 20 normal hearing (CG) and 20 hearing impaired (SG), matched by time of sensorial auditory sti
-mulation with normal hearing. The groups were subdivided according to time of sensorial auditory stimu
-lation, being CG1 (2 years of age), CG2 (3 years of age), CG3 (4 years of age), SG1 (2 years of auditory stimulation), SG2 (3 years of auditory stimulation), SG3 (4 years of auditory stimulation).
Results: the groups presented the following percentages of correct answers: CG1 87.33%, CG2 85.6% and CG3 98.67%. For the study group, composed of children with hearing loss, the results were, SG1 61.33%, SG2 76.8% and SG3 88% of correct answers. There were signiicant differences for six of the 25 words (ice, knife, rat, train, dog, lower), when associated with correct and incorrect answers.
Conclusion: the test is feasible for the evaluation and monitoring of speech perception in children with hearing impairment, regardless of their verbal ability.
Keywords: Auditory Perception; Child; Hearing; Hearing Loss
RESUMO
Objetivo: veriicar a aplicabilidade do teste de percepção de fala com iguras, desenvolvido por Souza e Reis (2015), em crianças com deiciência auditiva.
Métodos: estudo descritivo exploratório. Participaram 40 crianças, de ambos os sexos, na faixa etária entre 2 e 11 anos, sendo 20 normo ouvintes (GC) e 20 com deiciência auditiva (GE), equiparadas por tempo de estimulação sensorial auditiva com audição normal. Os grupos foram subdivididos de acordo com tempo de estimulação sensorial auditiva, sendo GC1 (2 anos de idade), GC2 (3 anos de idade), GC3 (4 anos de idade), GE1 (2 anos de estimulação auditiva), GE2 (3 anos de estimulação auditiva), GE3 (4 anos de estimulação auditiva).
Resultados: os grupos apresentaram as seguintes porcentagens de acertos: GC1 87.33%, GC2 85.6% e GC3 98.67%. O grupo estudo, composto pelas crianças com deiciência auditiva, os resultados foram, GE1 61.33%, GE2 76.8% e GE3 88% de acertos. Houve diferença signiicante para seis das 25 palavras (gelo, faca, rato, trem, cão, lor), quando associados acertos e erros.
Conclusão: o teste é viável para a avaliação e monitoramento da percepção de fala em crianças com deiciência auditiva, independente da capacidade de verbalização das mesmas.
INTRODUCTION
Speech perception test designed for children should use familiar words and their speech presentation would be more appropriate through live voice 1,2 for facilitating
the presentation of stimuli during their attention period. It is necessary to elaborate protocols and standardized procedures that evaluate speciic aspects of the speech perception of sounds in Brazilian Portuguese language. This is important so that such procedure can be used to evaluate the performance of patients with a sound ampliier, cochlear implant or other devices 3-5 and to
monitor the rehabilitation process 6.
Souza and Reis 6 developed a graphic instrument
for carrying out the SRPI with pictures in children. The instrument was applied to children from 2 years to 4 years and 11 months. Based on the results, the authors concluded that the use of the material was fast and easy to apply, meeting the SRPI objectives in children in the studied age group, allowing the test application regardless of the child’s verbal ability.
It is important, during the follow-up process, that the evaluations use the same speech perception test with the children, in order to compare their evolution with standardized procedures in a given period. The speech perception test with pictures can be used both for a non-linguistic child during the process of phonemes acquisition, or even in linguistic children, allowing to compare their evolution (monitor the rehabilitation process).
Children with hearing impairment may be at different levels of language and speech development, therefore, when evaluated with a graphic support material, which is independent of the verbal response of the child, it can guarantee more reliable results regarding the ability of speech perception being evaluated.
The objective of this study was to verify the appli-cability of the speech perception test with pictures as a graphic support material for responses to the percentage of speech recognition index test in children with hearing impairment in the initial years of auditory stimulation.
METHODS
The study was approved by the Research Ethics Committee of the General Hospital of Ribeirão Preto, Medical School of São Paulo University, a highly complex hospital in the state of São Paulo, under number 600/2014.
All those responsible for the participants were informed about the objectives of the study and, once they agreed to participate, they signed a an Informed Consent and a Term of Agreement, when necessary.
In the present study, 20 children with a diagnosis of hearing impairment, of both sexes, in the age group between 3 and 11 years of age (2 to 4 years of auditory stimulation) were evaluated. The control group consisted of 20 normal hearing children, in the age group of 2 years to 4 years and 11 months, without diagnosed hearing, neurological or mental alterations.
Although children with hearing impairment were older than the children from the normal hearing group of children, the groups were matched according to the auditory sensory stimulation time (use of an electronic device applied to deafness and systematized speech therapy). Therefore, the chronological time does not correspond to the development time of auditory and language abilities between the normal hearing individuals and the hearing impaired ones.
For the control group (CG - normal hearing children) and for the study group (SG - hearing impaired children), the auditory threshold was investigated prior to the speech perception test, considering the eligibility criterion for CG when the child presented the mean auditory thresholds up to 25 dB in the open ield. The SG, matched by time of auditory stimulation with the CG, performed both auditory thresholds test and speech perception test with the electronic device applied to deafness with habitual regulation and volume, with new and average battery of auditory thresholds of 35 dB as eligibility criteria, regardless of the degree of hearing loss. Therefore, the auditory capacity of the participant of the SG was considered for inclusion in the study.
of children with auditory stimulation time between 3 years and 3 years and 11 months and E3 composed of children with auditory stimulation time between 4 years and 4 years and 11 months.
In these groups, individuals between 3 years to 11 years and 11 months of age, who were hearing impaired, and were actively involved in speech therapy and/or psychopedagogical therapy were included.
We excluded individuals whose responsible caregiver did not agree to participate and individuals who refused to complete the test.
Applicability of the instrument
Data collection was carried out in the Educational Audiology Services of two centers specialized in rehabilitation, of medium and high complexity, inserted in public hospitals of the city, between February and August 2015. The sample was formed by children who were waiting speech-language therapy in these services and at the researchers’ invitation.
Initially, a survey was carried out on the demographic data of both groups and on the adaptation of the electronic device or hearing aid used by Group E participants. Subsequently, auditory thresholds were investigated and Speech Recognition Percentage Index (SRPI) with igures, in an acoustically treated room, at loudspeaker, in a free ield system for both groups. In order to investigate auditory thresholds and SRPI with igures, hearing impaired children performed it with electronic devices or hearing aids, they usually use, in normal volume, with a new battery.
In order to control the acoustic signal at a speciic point in the space, we tried to establish a working distance, deined in this study, distance of 60 cm from the chair to the sound box, we also controlled the azimuth angle, at 0° azimuth once the stimulation was binaural and of raising of the incident sound for each participant as procedure for accomplishment of measurements in free ield. The audiometer was AC40, Interacoustic. At this stage, the children were told that they would hear several words and should point to the corresponding picture on the board presented in front of them and, as predicted in the test, training was performed prior to the accomplishment of the test.
To carry out auditory recognition of words, through the identiication of corresponding picture, the material proposed by Souza and Reis (2015)6 was used, which
consists of cards containing six pictures each, corre-sponding to monosyllable and dissyllable words, to which the children should point in order to match the
word dictated by the examiner. For this procedure a second examiner, inside the cabin, changed the cards according to the word presentation.
The speech perception test with igures was elabo-rated 6 to evaluate small children or individuals who
do not master the oral code, this procedure presents dificulties in the interpretation of answers, since these children use phonological processes to simplify their speech or they cannot verbalize. In the study published on this instrument, the objective was to verify the applicability of this support material with pictures for responses to SRPI test in children, according to gender and age between 2 years and 2 years and 11 months, 3 years and 3 years and 11 months and 4 years and 4 years and 11 months. In that study, the authors concluded that the use of the elaborated material, with regular and frequent monosyllabic and dissyllable words and pictures, the application was quick and easy, demonstrating meeting the SRPI objectives in children in the studied age group, allowing the systematized monitoring of speech perception ability regardless of the verbal ability of the child 7.
Training with a ive-word list was performed prior to the test to prevent dificulties in understanding the test strategy, regarding the stimuli or type of response required during the procedure.
Following the training, the speech perception test was performed with pictures, that is, the word list of the test was used, containing 25 monosyllable and dissyl-lable words.
The entire list of words was applied without pauses between the phonemes, and with repetition only once if requested by the child. Introductory phrases were used for presenting the picture list. Vehicle phrases were used: Show the _____ or Where is the _____. We used a bulkhead to prevent orofacial reading support, as in the conventional SRPI test.
Data analysis
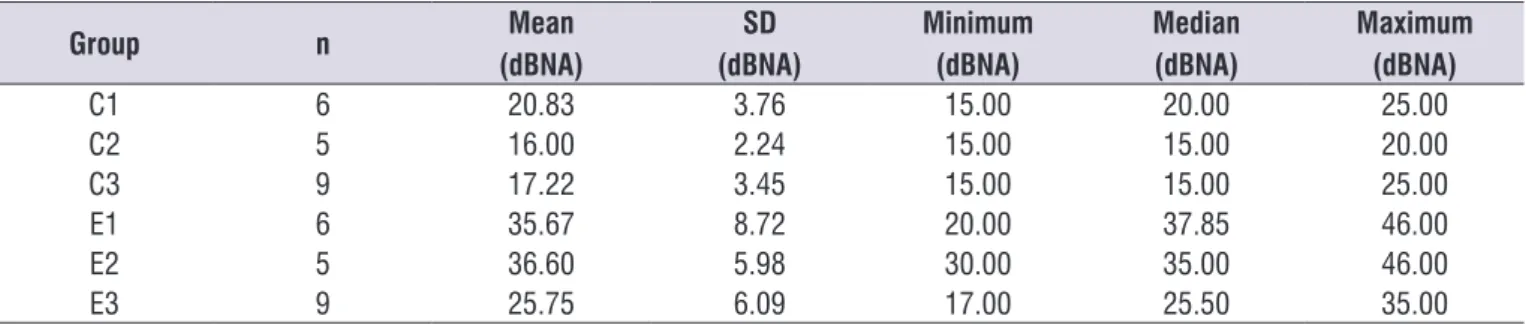
Auditory thresholds for children of both groups are shown in Table 2.
Tables 3, 4 and 5 will present the results regarding the application of SRPI with pictures.
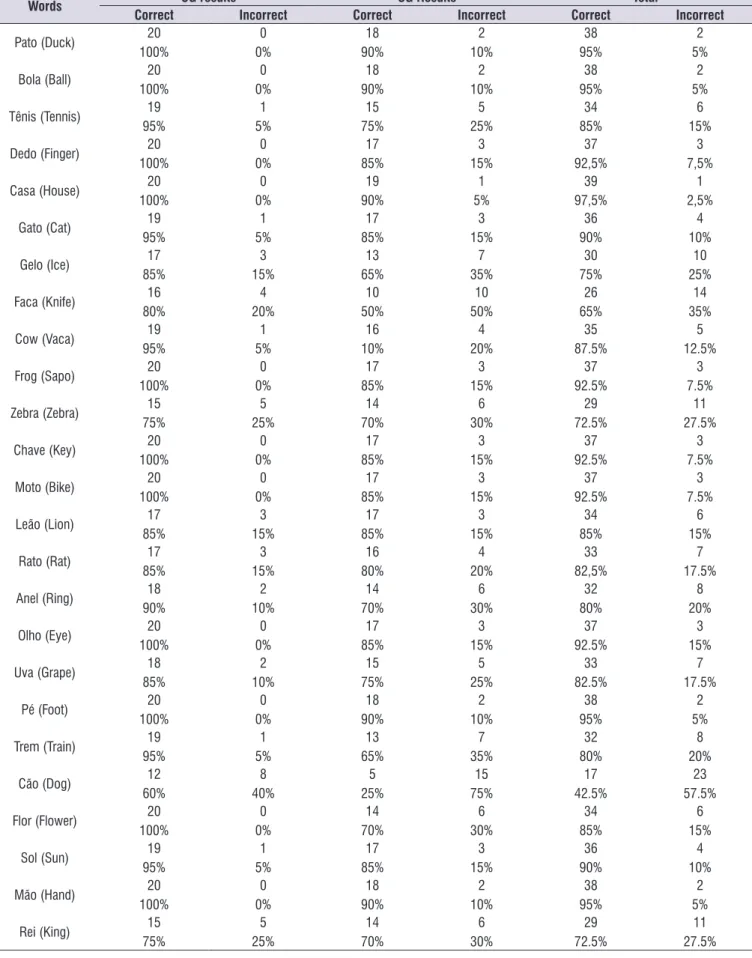
Table 4 shows the descriptive data (mean, standard deviation and median) in relation to the performance in SRPI with pictures, number and percentage of correct answers and incorrect answers, per word, of the partici-pating children.
RESULTS
Test Application
As described in the methodology, 20 children with hearing impairment using electronic devices applied to deafness for at least 2 years, and 20 normal hearing children aged 2 to 4 years and 11 months participated in the study
Table 1 shows the descriptive data (mean, standard deviation and median) in relation to the chronological age of the children’s groups.
Table 3. Descriptive data (mean, median, standard deviation, minimum and maximum values) of the percentage of correct answers
obtained in the test of control (C) and study (E) groups (n = 40).
Group n Mean SD Minimum Median Maximum
C1 6 87.33% 5.89% 80% 90% 92%
C2 5 85.60% 11.82% 76% 80% 100%
C3 9 98.67% 2.83% 92% 100% 100%
E1 6 61.33% 27.21% 16% 62% 100%
E2 5 76.8% 27.77% 28% 92% 92%
E3 9 88% 16% 56% 96% 100%
Caption: n = number of individuals; SD = standard deviation; C1 = control group with 2 years old; C2 = control group with 3 years old; C3 = control group with 4 years old; E1 = study group with 2 years of auditory stimulation; E2 = study group with 3 years of auditory stimulation; E3 = study group with 4 years of auditory stimulation. Table 1. Descriptive data (mean, median, standard deviation, minimum and maximum values) related to participants’ age in control (C)
and study (E) (n = 40) groups.
Group n Mean
(years)
DD (years)
Minimum (years)
Median (years)
Maximum (years)
C1 6 2.44 0.29 2.08 2.46 2.75
C2 5 3.43 0.32 3.08 3.42 3.92
C3 9 4.57 0.23 4.25 4.50 4.92
E1 6 4.69 0.95 3.25 4.88 5.58
E2 5 7.56 1.07 6.16 7.58 9.00
E3 9 9.35 1.18 6.92 9.16 11.33
Caption: n = number of individuals; SD = Standard Deviation; C1 = control group with 2 years old; C2 = control group with 3 years old; C3 = control group with 4 years old; E1 = study group with 2 years of auditory stimulation; E2 = study group with 3 years of auditory stimulation; E3 = study group with 4 years of auditory stimulation.
Table 2. Descriptive data (mean, median, standard deviation, minimum and maximum values) of auditory thresholds of control (C) and
study (E) groups (n = 40)
Group n Mean
(dBNA)
SD (dBNA)
Minimum (dBNA)
Median (dBNA)
Maximum (dBNA)
C1 6 20.83 3.76 15.00 20.00 25.00
C2 5 16.00 2.24 15.00 15.00 20.00
C3 9 17.22 3.45 15.00 15.00 25.00
E1 6 35.67 8.72 20.00 37.85 46.00
E2 5 36.60 5.98 30.00 35.00 46.00
E3 9 25.75 6.09 17.00 25.50 35.00
Table 4. Descriptive data of the number of correct answers and incorrect answers obtained in the test (SRPI with pictures), by word, of
the participating groups, control and study (n = 40)
Words CG results SG Results Total
Correct Incorrect Correct Incorrect Correct Incorrect
Pato (Duck) 100%20 0%0 90%18 10%2 95%38 5%2
Bola (Ball) 20
100% 0%0 90%18
2
10% 95%38
2
5%
Tênis (Tennis) 95%19 5%1 75%15 25%5 85%34 15%6
Dedo (Finger) 20
100% 0%0 85%17
3
15% 92,5%37
3
7,5%
Casa (House) 20
100% 0%0 90%19
1
5% 97,5%39
1
2,5%
Gato (Cat) 95%19 5%1 85%17 15%3 90%36 10%4
Gelo (Ice) 85%17 15%3 65%13 35%7 75%30 25%10
Faca (Knife) 80%16 20%4 50%10 50%10 65%26 35%14
Cow (Vaca) 95%19 5%1 10%16 20%4 87.5%35 12.5%5
Frog (Sapo) 20
100% 0%0 85%17
3
15% 92.5%37
3
7.5%
Zebra (Zebra) 15
75% 25%5
14
70% 30%6 72.5%29
11
27.5%
Chave (Key) 100%20 0%0 85%17 15%3 92.5%37 7.5%3
Moto (Bike) 100%20 0%0 85%17 15%3 92.5%37 7.5%3
Leão (Lion) 85%17 15%3 85%17 15%3 85%34 15%6
Rato (Rat) 17
85%
3
15% 80%16
4
20%
33
82,5% 17.5%7
Anel (Ring) 18
90%
2
10%
14
70% 30%6
32
80% 20%8
Olho (Eye) 100%20 0%0 85%17 15%3 92.5%37 15%3
Uva (Grape) 85%18 10%2 75%15 25%5 82.5%33 17.5%7
Pé (Foot) 20
100% 0%0 90%18
2
10% 95%38
2
5%
Trem (Train) 95%19 5%1 65%13 35%7 80%32 20%8
Cão (Dog) 12
60% 40%8 25%5 75%15 42.5%17
23
57.5%
Flor (Flower) 100%20 0%0 70%14 30%6 85%34 15%6
Sol (Sun) 19
95%
1
5% 85%17
3
15% 90%36
4
10%
Mão (Hand) 20
100% 0%0 90%18
2
10% 95%38
2
5%
Rei (King) 15
75% 25%5
14
70% 30%6 72.5%29
11
Table 5. Association between the number of correct answers and incorrect answers in the SRPI with pictures and the participants’ age in
control (C) and study (E) groups (n = 40)
Pictures GROUPS Fisher’s
Exact test
C1 C2 C3 E1 E2 E3 TOTAL
Pato (Duck)
Correct 6
15% 12.5%5 22.5%9 15%6
4
10% 20%8 95%38 p=0.6192
Incorrect 0
0% 0%0 0%0 0%0
1 2.5% 1 2.5% 2 5% Bola (Ball) Correct 6
15% 12.5%5 22.5%9 12.5%5
4
10% 22.5%9 95%38 p=0.2500
Incorrect 0
0% 0%0 0%0
1
2.5%
1
2.5% 0%0
2 5% Tênis (Tennis) Correct 6 15% 4
10% 22.5%9
3
7.5%
4
10% 20%8
34
85% p=0.0943
Incorrect 0
0%
1
2.5% 0%0
3
7.5%
1
2.5%
1
2.5% 15%6
Dedo (Finger)
Correct 6
15% 12.5%5 22.5%9 12.5%5
4
10% 20%8 92.5%37 p=0.6885
Incorrect 0
0% 0%0 0%0
1 2.5% 1 2.5% 1 2.5% 3 7.5% Casa (House) Correct 6
15% 12.5%5 22.5%9 15%6
4
10% 22.5%9 97.5%39 p=0.2500
Incorrect 0
0% 0%0 0%0 0%0
1
2.5% 0%0
1
2.5%
Gato (Cat)
Correct 5
12.5% 12.5%5 22.5%9
4
10%
4
10% 22.5%9 90%36 p=0.1386
Incorrect 1
2.5% 0%0 0%0
2
5%
1
2.5% 0%0
4 10% Gelo (Ice) Correct 5 12.5% 3
7.5% 22.5%9
2
5% 12.5%5 15%6 75%30 p=0.0307*
Incorrect 1
2.5%
2
5% 0%0
4
10% 0%0
3
7.5% 25%10
Faca (Knife)
Correct 3
7.5%
4
10% 22.5%9
2
5%
2
5% 15%6 65%26 p=0.0460*
Incorrect 3
7.5%
1
2.5% 0%0
4 10% 3 7.5% 3 7.5% 14 35% Vaca (Cow) Correct 5
12.5% 12.5%5 22.5%9
4
10%
3
7.5% 22.5%9 87.5%35 p=0.0713
Incorrect 1
2.5% 0%0 0%0
2
5%
2
5% 0%0 12.5%5
Sapo (Frog)
Correct 6
15% 12.5%5 22.5%9
4
10% 12.5%5 20%8 92.5%37 p= 0.1972
Incorrect 0
0% 0%0 0%0
2
5% 0%0
1 2.5% 3 7.5% Zebra (Zebra) Correct 4 10% 3
7.5% 20%8
4
10%
3
7.5% 17.5%7 72.5%29 p=0.7822
Incorrect 2 5% 2 5% 1 2.5% 2 5% 2 5% 2 5% 11 27.5% Chave (Key) Correct 6
15% 12.5%5 22.5%9 12.5%5
4
10% 20%8 92.5%37 p=0.6885
Incorrect 0
0% 0%0 0%0
1 2.5% 1 2.5% 1 2.5% 3 7.5% Moto (Bike) Correct 6
15% 12.5%5 22.5%9
4
10% 12.5%5 20%8 92.5%37 p=0.1972
Incorrect 0
0% 0%0 0%0
2
5% 0%0
1
2.5%
3
Pictures GROUPS Fisher’s Exact test
C1 C2 C3 E1 E2 E3 TOTAL
Leão (Lion)
Correct 5
12.5%
3
7.5% 22.5%9
4
10%
4
10% 22.5%9
34
85% p=0.0943
Incorrect 1
2.5%
2
5% 0%0
2
5%
1
2.5% 0%0 15%6
Rato (Rat)
Correct 5
12.5%
3
7.5% 22.5%9
3
7.5%
4
10% 22.5%9
33
82.5% p=0.0319*
Incorrect 1
2.5%
2
5% 0%0
3
7.5%
1
2.5% 0%0 17.5%7
Anel (Ring)
Correct 5
12.5%
4
10% 22.5%9
3
7.5% 12.5%5 15%6
32
80% p= 0.1354
Incorrect 1
2.5%
1
2.5% 0%0
3
7.5% 0%0
3
7.5% 20%8
Olho (Eye)
Correct 6
15% 12.5%5 22.5%9
4
10%
4
10% 22.5%9 92.5%37 p=0.0709
Incorrect 0
0% 0%0 0%0
2
5%
1
2.5% 0%0
3 7.5% Uva (Grape) Correct 5 12.5% 4
10% 22.5%9
3
7.5%
4
10% 20%8
33
82.5% p=0.2104
Incorrect 1
2.5%
1
2.5% 0%0
3
7.5%
1
2.5%
1
2.5% 17.5%7
Pé (Foot)
Correct 6
15% 12.5%5 22.5%9 12.5%5
4
10% 22.5%9 95%38 p=0.2500
Incorrect 0
0% 0%0 0%0
1
2.5%
1
2.5% 0%0
2 5% Trem (Train) Correct 6 15% 4
10% 22.5%9
1
2.5%
4
10% 20%8
32
80% p=0.0014*
Incorrect 0
0%
1
2.5% 0%0 12.5%5
1
2.5%
1
2.5% 20%8
Cão (Dog)
Correct 2
5%
2
5% 20%8
1
2.5% 0%0
4
10% 42.5%17 p=0.0151*
Incorrect 4
10%
3
7.5%
1
2.5% 12.5%5 12.5%5 12.5%5
23
57.5%
Flor (Flower)
Correct 6
15% 12.5%5 22.5%9
2
5%
4
10% 20%8
34
85% p=0.0062*
Incorrect 0
0% 0%0 0%0
4
10%
1
2.5%
1
2.5% 15%6
Sol
Correct 5
12.5% 12.5%5 22.5%9
4
10% 12.5%5 20%8 90%36 p=0.3604
Incorrect 1
2.5% 0%0 0%0
2
5% 0%0
1 2.5% 4 10% Mão (Hand) Correct 6
15% 12.5%5 22.5%9 12.5%5
4
10% 22.5%9 95%38 p=0.2500
Incorrect 0
0% 0%0 0%0
1
2.5%
1
2.5% 0%0
2 5% Rei (King) Correct 4 10% 3
7.5% 20%8
3
7.5%
3
7.5% 20%8 72.5%29 p=0.3982
Incorrect 2 5% 2 5% 1 2.5% 3 7.5% 2 5% 1 2.5% 11 27.5% * (p-value < 0.05)
are essential for the normal development of hearing and language.
Regarding the subjects’ performance, it was veriied that the test with the support of pictures did not reveal dificulties for any of the studied groups. When comparing the groups in relation to the performance for SRPI with pictures, normal hearing children had the highest number of correct answers in almost all words, except for the word «lion», which, in both groups (CG and SG) had the same number of correct answers (Table 4).
For 16 out of the 25 presented words (64%), the difference in the number of correct answers between normal hearing children (CG) and children with hearing loss varied between one and three correct answers, with better results for CG, which was expected since these children are more exposed to incidental learning, that is, unintentional or unplanned learning resulting from other activities.
Still in Table 4, it can be observed that the difference of correct answers between CG and SG was greater for the words: tennis, ice, knife, ring, train, dog and lower. Reinforcing the issue of the time of exposure to auditory stimulation and the effect of hearing deprivation in this age group. Although the groups were matched by time of auditory stimulation, the CG presented superior performance, demonstrating greater knowledge of the words considered regular and frequent during the construction of the material 6. The support of
the pictures, for these words, did not allow the SG subjects to identify the word auditory, suggesting the non-exposure of the child to the presented word (its auditory learning).
However, for the words «lion» and «rat» there was a similar or very close performance (difference of result equal to 1), respectively, for SG children. This is probably due to the fact that the SG children are in the process of speech-language rehabilitation, and the structured work usually establishes the vocabulary by semantic ield, often including animals for oral production and of interest for the age group (motivation), which is not necessarily presented to CG children.
Another factor to be considered for the greater number of correct answers by normal hearing children (CG) is their mean of auditory thresholds are better than the mean of the thresholds of the hearing impaired children, even considering when performed with the use of their sound ampliication device and, the presen-tation of the speech stimuli for both groups was 60 dB, By associating the number of correct answers
and incorrect answers in SRPI with pictures with the individuals’ age, a signiicant difference is observed for six of the 25 words, as seen in Table 5.
DISCUSSION
According to the results of this study (Table 3), the mean value of correct answers presented by the children in SRPI with pictures increased according to the time of auditory stimulation, with the mean value of correct answers for group E1 being 61.33%, with a standard deviation (SD) of 27.21%, and for E2 of 76.8%, with SD of 27.77%, and for group E3, the mean value of correct answers was 88%, with SD of 16%, in agreement with the study by Silva et al. (3). The results showed relation between the variables age and percentage of correct answers, i.e., the older the child (for group C) and the longer the duration of auditory stimulation (for group E), the higher the percentage of correct answers.
In the evaluation of auditory perception of speech, the time of auditory stimulation is a factor directly related to its performance. In Table 3, the evolution of SRPI with pictures of group E is similar to Group C, and group E3 (with 88% of correct answers - considered values within normality) approximates the results of group C3 (mean of 98.67% of correct answers - also considered values within normality), as well as the other groups when paired by auditory stimulation time with the control groups, respectively, although the results obtained by groups E1 and E2 have not yet reached normality scores.
Considering the normal hearing children, the chronological age, in addition to other factors, a direct relation with performance is observed. However, for children with hearing loss, the time of auditory depri-vation inluences, in many aspects, the performance of auditory perception, especially the perception of speech. Considering the time of auditory stimulation tends to equate to chronological age (or time of auditory stimulation), in this studied age group. It is noteworthy that for other age groups, the time of hearing loss may have a greater inluence on the performance of speech perception tests, due to issues related to the plasticity of the central auditory system and the most sensitive periods for the development of auditory perception 8,9. According to Azevedo 10, the neuronal
REFERENCES
1. Uhler K, Biever A, Gifford RH. Method of speech stimulus presentation impacts pediatric speech recognition: monitored live voice versus recorded speech. Otol Neurotol. 2016;37(2):70-4.
2. Mendel LL, Owen SR. A study of recorded versus live voice word recognition. Int. J Audiol. 2011;50(10):688-93.
3. Silva RCL, Bevilacqua MC, Mitre EI, Moret ALM. Teste de percepção de fala para palavras dissílabas. Revista CEFAC. 2004;6(2):209-14.
4. Magalhães LA, Cimonari PM, Novaes BCAC. Avaliação de percepção de fala em crianças com deiciência auditiva usuárias de aparelho de ampliicação sonora: a questão do instrumento e seus critérios. Rev Soc. Bras. Fonoaudiol. 2007;12(3):221-32.
5. Bazon AC, Mantello EB, Gonçales AS, Isaac M de L, Hyppolito MA, Reis ACMB. Auditory Speech Perception Tests in Relation to the Coding Strategy in Cochlear Implant. Int. Arch. Otorhinolaryngol. 2016;20(3):254-60. doi:10.1055/s-0035-1559595.
6. Souza LF, Reis ACMB. Teste de Percepção de Fala com Figuras. 2015. [material impresso].
7. Souza LF, Braga GRAB, Mota ALR, Zamberlan-Amorim NE, Reis ACMB. Construção e aplicabilidade de um teste de percepção de fala com iguras. CoDAS [Internet]. 2016 Dec [cited 2017 Feb 09]; 28(6):758-69. Available from: http://www.scielo. br/scielo.php?script=sci_arttext&pid=S2317-17822016000600758&lng=en. Epub Dec 08, 2016. http://dx.doi.org/10.1590/2317-1782/20162015224.
8. Moore DR, Ferguson MA, Halliday LF, Riley Al. Frequency discrimination in children: Perception, learning and attention. Hearing Research. 2008;238: 147-54.
9. Ylinen S, Kujala T. Neuroscience illuminating the inluence of auditory or phonological intervention on language-related déicits. Front Pysichol. 2015;6(137):12-25.
10. Azevedo MF. Desenvolvimento das habilidades auditivas. In: Bevilacqua MC, Martinez MAN, Balen AS, Pupo AC, Reis ACM, Frota S. Tratado de Audiologia.1 ªed, São Paulo: Santos; 2011. p.475-93.
in addition to the familiarity of some children with such words (greater auditory exposure). Silva et al. 3 report
that speech perception tests for children should be composed of familiar words, as the use of unfamiliar vocabulary in the procedure can lead to erroneous conclusions about the auditory recognition of speech sounds.
By associating the number of correct answers and incorrect answers in SRPI with pictures with the individuals’ age, evidence of statistical difference is observed for six of the 25 words: «ice», «knife», «rat», «train» and «lower» (Table 5).
The word «dog» was the one that presented the greatest number of incorrect answers for both CG and SG. Incorrect answers can be justiied because of the term used to describe the pictures, since usually with children, the term «dog» or onomatopoeia «au-au» is used, especially with children with hearing or speech disorders. During the application of the test, the word «dog» or onomatopoeia «au-au» was presented when the word was mistaken, which were correctly identiied in all cases, demonstrating that the children have the concept, but do not have the auditory recognition of the linguistic sign of the word used in the test.
The incorrect answers identiied for the word «knife» (faca), especially for SG, can be justiied due to the dificulty of distinguishing sonority traits from fricative sounds, since the graphical representation of this word appears in the test on the same board as the graphical representation of the word «cow» (vaca).
Thus, the results obtained in the application of the Speech Perception Test with Pictures in children with hearing impairment, suggest that the graphic material proposed by Souza and Reis 6 is satisfactory for the
application of the procedure (SPT), allows the evalu-ation of speech perception, regardless of the verbal ability of the child.
It is worth mentioning that a single test is not enough to evaluate all aspects of the perception of speech sounds in the hearing impaired child, so it is up to the professional to use the instrument and produce results in a judicious way.