Priscila Maria Stolses Bergamo FranciscoI
Marilisa Berti de Azevedo BarrosI
Neuber José SegriII
Maria Cecília Goi Porto AlvesIII
I Departamento de Saúde Coletiva. Faculdade de Ciências Médicas. Universidade Estadual de Campinas. São Paulo, SP, Brasil
II Departamento de Estatística. Instituto de Ciências Exatas e da Terra. Universidade Federal de Mato Grosso. Mato Grosso, MT, Brasil
III Instituto de Saúde. Secretaria de Estado da Saúde de São Paulo. São Paulo, SP, Brasil
Correspondence:
Priscila Maria Stolses Bergamo Francisco Faculdade de Ciências Médicas – Unicamp Rua Tessália Vieira de Camargo, 126 13083-887 Campinas, SP, Brasil E-mail: [email protected] Received: 2/1/2012
Approved: 7/23/2012
Article available from: www.scielo.br/rsp
Comparison of estimates of
population-based surveys
ABSTRACT
OBJECTIVE: To compare estimates obtained through household and telephone surveys for monitoring, intervention and development of health policies.
METHODS: The study analyzed data from 2,526 and 1,900 individuals aged 18 and over, living in Campinas, SP, interviewed by the household survey (ISACamp) and by the telephone survey (Vigitel), respectively. Sex, age and schooling were used to characterize the studied population. Prevalence estimates and 95% confi dence intervals were utilized in the analysis. The estimates of the sociodemographic characteristics of the population were compared by t-test for two independent samples and the comparison of the other estimates, according to the type of survey, was performed using Poisson regression.
RESULTS: No statistically signifi cant differences were found between the estimates obtained by the two surveys analyzed for overall prevalence of: overweight/obesity, smoking status, mammography in the prior year and Pap smear at least once in life. However, for the estimates of worse perceived health status, health plan affi liation, mammography at least once in life and Pap smear in the prior year, signifi cant differences were found, with a tendency to overestimate data from the telephone survey, except in the case of worse perceived health status.
CONCLUSIONS: These fi ndings point to the need for further studies, which may contribute to a better understanding of the differences, given that telephone surveys can provide quick and essential information for monitoring modifi able risk factors for the assessment of interventions and to develop policies promoting health in Brazil.
Population-based studies are an important tool for estimating a population’s health condition indicators, health-related behavior, access to and use of services and morbidity.3 Although summary measures of health are necessary, the availability of indicators which enable different dimensions of the disease process to be assessed make it possible to produce formulations for the wider health scene.2
With the increased prevalence of non-communicable chronic illness, there is greater interest in studies whose data on signs, symptoms and risk factors are self-reported by the population. The data may be collected through face-to-face or telephone interviews or through self reported questionnaires. They allow the accompaniment of the population over time by means of probabilistic samples, at a lower cost and with
simpli-fi ed fi eld work.3,15,18
National health surveys carried out in the country describe indicators at a metropolitan level, i.e., they do not provide suffi cient information to assess and monitor health campaigns carried out by the public health system,3 which aims to decentralize management at the municipal level. In the last few decades, the research of these surveys stands out due to their capacity to measure modifi ed risk factors and, increasingly, valid data is becoming necessary for decision making, be they clinical or for public health interventions.3
Household health surveys enable more detailed informa-tion on a wide range of topics to be obtained.3,16 The more concise, telephone interviews cost less and are quicker in obtaining and divulging and obtaining information.4,15,16
The ISACamp (Campinas Health Survey) is a cross-sectional population-based study carried out by the Health Situation Analysis Collaborating Centre of the Faculdade de Ciências Médicas da Universidade Estadual de Campinas. Household interviews were used to analyze health status, lifestyle profi le (risk factors for chronic illness) and use of health care services for different sectors of the population, assessing the degree of social equality/inequality.
The Vigitel (Telephone Survey System for Monitoring Risk and Protection Factors for Chronic Illness) is population based research established by the Ministry of Health in 2006. This research aims to continuously monitor the frequency and distribution of risk and protection factors for chronic disease in the Brazilian state capitals and in the federal district.a In 2008, the municipality of Campinas was included in this research. INTRODUCTION
a Ministério da Saúde. Secretaria de Vigilância em Saúde. Secretaria de Gestão Estratégia e Participativa. Vigitel Brasil 2008: vigilância de fatores de risco e proteção para doenças crônicas por inquérito telefônico. Brasília (DF); 2009.
b Alves MCGP. ISA-CAMPINAS 2008/09. Plano de Amostragem. Campinas: UNICAMP; 2009 [cited 2012 Jan 5]. Available from: http://www. fcm.unicamp.br/centros/ccas/arquivos/plano_de_amostragem.pdf
Telephone interviews are the cheapest and most
fl exible method for collecting population data and can achieve estimates comparable with those of face-to-face interviews.
Household and telephone interviews provide similar estimates.7,8,10,16 However, the high rates of not-responding or not-covered found in telephone surveys may affect the quality of the estimates.4,20,22
The aim of this study was to compare estimates obtained from household and telephone surveys in order to develop, carry out and monitor health policies.
METHODS
Data on the adult (over 18) population from the 2008 ISACamp and Vigitel (Campinas) surveys were used.
The household survey sample – ISACamp, was obtained through probabilistic two-stage cluster sampling proce-dures: census tract and households. In the fi rst stage, 50 census tract with probability proportional to size were randomly selected. The draw was systematic and the sectors were in order of percentage of heads of household with university education, producing implicit stratifi cation according to the level of education of the head of the household. In the second stage 2,150, 700 and 3,900 households were randomly selected for adolescents, adults and the elderly respectively.
The questionnaire included information on the inter-viewees’, the households’ and the families’ state of health, use of health care services, habits related to health, height, weight and socio-economic condi-tions. This information was obtained for the sample representing the population ≥ ten years old, through household interviews carried out by trained and super-vised interviewers.
c Lee S, Davis WW, Nguyen HA, McNeel TS, Brick JM, Flores-Cervantes I. Examining trends and averages using combined cross-sectional survey data from multiple years. CHIS Methodology Paper. Los Angeles; 2007[cited 2010 Sep 19]. Available from: http://www.chis.ucla.edu/ pdf/paper_trends_averages.pdf
The fi nal weight given to each individual resulted from multiplying the design weight, the weight of no responses and the post-stratifi cation weight, taking into consider-ation the distribution according to gender and age ranges (10-19, 20-39, 40-59, ≥ 60 years old) of the Seade-2007 (State System of Data Analysis Foundation).
The sampling procedures adopted by Vigitel aimed to obtain probabilistic samples of adults resident in households served by at least one landline. The sample selection took place in two stages: random selection of landline numbers and of the inhabitant to be interviewed. A systematic random selection of 5,000 landline numbers was made from the Telefônica phone company’s elec-tronic records of residential landlines, ordered by prefi x, leading to implicit stratifi cation according to area of the municipality. In the second stage, the randomly selected numbers were then re-drawn and divided into 25 groups of 200 lines. Each group had the same proportion of numbers by telephone prefi x.a
The data from the probabilistic sample of the ≥ 18 year old population were collected through telephone inter-views conducted by a company hired for the purpose. The team of interviewers received training and were continu-ously supervised throughout the data collection.a The questions were about: socio-economic and demographic characteristics; eating and exercise patterns associated with non-communicable chronic disease; characteristics indicating body composition; frequency of alcohol and tobacco consumption; the interviewees’ self-rated state of health and references to prior medical diagnoses of high blood pressure, cholesterol and diabetes.
Calls were made to 4,800 numbers distributed throughout 25 replicas, identifying 2,773 eligible numbers in Campinas. The individuals were numbered and one of them was randomly selected to be inter-viewed for each eligible number, and permission sought from the users to take part.
The fi nal weight applied to each interviewee was the result of multiplying the design weight (inverse of the number of telephone lines in the interviewee’s home multiplied by the number of adults in the interviewee’s home) by the post-stratification weight (relative frequency of individuals in the population of the 2000 Census divided by the relative frequency in the weighted sample). For the post-stratifi cation, 36 strata were consid-ered according to sex, age group (18-24, 25-34, 35-44, 45-54, 55-64 and 65 and over) and level of education (0-8, 9-11 and 12 or more years of schooling).a
In total, 4,426 individuals aged ≥ 18, resident in Campinas in 2008 were included, 2,526 were inter-viewed by ISACamp and 1,900 by Vigitel.
The indicators (variables) used to compare the survey estimates were: being overweight (BMI ≥ 25 kg/m2), smoking (current smoker), self-rated health (worse perceived health), having health insurance, in women
≥ 40 having had a mammogram and in women ≥ 20, a smear test at least once and in the previous 12 months.
Sex, age group and education (in years of schooling) were used to characterize the population. The data from both surveys were analyzed based on a combined archive. The variables were renamed and classifi ed as values and identical labels for the same categories of response. A new variable was created to identify the origin of the information (ISACamp or Vigitel), making comparisons possible.c
The prevalence of the selected variables and their respective 95% confi dence intervals were estimated. In addition to overall estimates, prevalence estimates were also calculated according to gender, age group and education.
The estimates of prevalence ratios used to compare the surveys were obtained using Poisson regression, considering the characteristic studied as a dependent variable and the variable created to identify the origin of the survey (household or telephone) as an independent variable. According to Lee et alc (2007),if the indepen-dent variable is statistically signifi cant, there is evidence to reject the hypothesis that the estimates from the two types of survey are similar, with a descriptive level of 0.05 for the Wald test.
In order to control possible differences in the surveys samples’ distributions, due to the dissimilar post-strat-ifi cation weights based on different years (ISACamp – Seade 2007 and Vigitel – 2000 Census), age, gender and education were used as adjustments in the regres-sion models.
The Stata 11.0 program, which enables the aspects of the complex sample design to be considered, was used.
The research project was approved by the Ethics Committee of the Universidade Estadual de Campinas (Report no 079/2007) and the interviewees signed consent forms. In the Vigitel research, the interviewees’ verbal consent to participate was given at the time telephone contact was made. The establishment of the Vigitel project was approved by the Ministry of Health Ethical Research Committee (CONEP 13081/2008).
RESULTS
39.9 (95%CI 38.9;40.9). The response rates were 85.6% (interviews conducted/ eligible individuals) and 72.7% (interviews conducted/ eligible numbers) in the household and telephone surveys respectively. Of the individuals aged ≥ 18, 76.6% (95%CI 70.9;82.2) reported having a landline in their home.
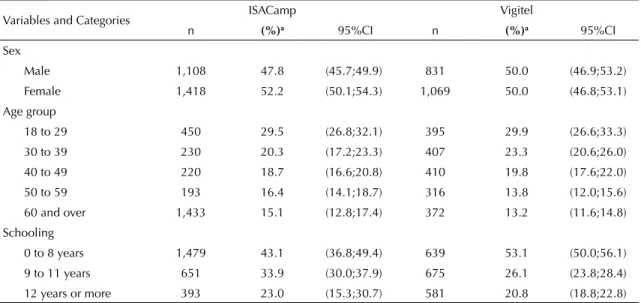
The socio-demographic characteristics obtained by the ISACamp and Vigitel surveys are shown in Table 1.
The percentages for gender, age group and education
referred to those of the population of Campinas for 2007 and 2000, based on projections by the SEADE Foundation and the Census, respectively.
There were no differences in overall estimates and
for the subgroups evaluated for being overweight or smoking (Table 2).
Table 1. Percentage distribution of adult population ( 18), according to socio-demographic characteristics. ISACamp and
Vigitel. Campinas, Southeastern Brazil, 2008.
Variables and Categories ISACamp Vigitel
n (%)a 95%CI n (%)a 95%CI
Sex
Male 1,108 47.8 (45.7;49.9) 831 50.0 (46.9;53.2)
Female 1,418 52.2 (50.1;54.3) 1,069 50.0 (46.8;53.1)
Age group
18 to 29 450 29.5 (26.8;32.1) 395 29.9 (26.6;33.3) 30 to 39 230 20.3 (17.2;23.3) 407 23.3 (20.6;26.0) 40 to 49 220 18.7 (16.6;20.8) 410 19.8 (17.6;22.0)
50 to 59 193 16.4 (14.1;18.7) 316 13.8 (12.0;15.6) 60 and over 1,433 15.1 (12.8;17.4) 372 13.2 (11.6;14.8) Schooling
0 to 8 years 1,479 43.1 (36.8;49.4) 639 53.1 (50.0;56.1) 9 to 11 years 651 33.9 (30.0;37.9) 675 26.1 (23.8;28.4)
12 years or more 393 23.0 (15.3;30.7) 581 20.8 (18.8;22.8) n: number of individuals in the unweighted sample
ISACamp: Health Survey Campinas; Vigitel: Monitoring system for Risk and Protective Factors for Chronic Diseases Telephone Survey
a Prevalence in the weighted sample
Table 2. Comparison of estimates for being overweight and percentage of smokers, by sex, age and education. ISACamp and
Vigitel. Campinas, Southeastern Brazil, 2008.
Variable Overweight and obese (%) Smokers (%) ISACamp Vigitel PRAdjusted
a ISACamp Vigitel PR Adjusted
a
Sex
Male 47.9 (43.5;52.3) 52.3 (47.5;57.2) 1.10 (0.97;1.26) 22.7 (19.4;26.1) 21.6 (17.3;25.9) 0.85 (0.67;1.07) Female 46.8 (42.8;50.7) 42.3 (38.3;46.4) 0.91 (0.80;1.03) 15.1 (11.9;18.2) 13.5 (10.4;16.6) 0.84 (0.62;1.14)
Age group (years)
18 to 39 37.7 (33.4;42.0) 38.9 (34.1;43.9) 0.98 (0.83;1.16) 17.1 (13.6;20.6) 16.3 (12.0;20.6) 0.80 (0.59;1.09) 40 to 59 57.9 (53.4;62.5) 57.6 (53.2;61.9) 0.98 (0.87;1.09) 24.2 (20.0;28.5) 21.6 (17.7;25.4) 0.86 (0.67;1.10) 60 and
over 54.4 (51.7;57.1) 55.1 (49.0;61.2) 1.01 (0.90;1.14) 11.4 (9.2;13.6) 12.5 (8.4;16.7) 1.09 (0.74;1.61) Schooling (years)
0 to 8 54.9 (50.4;59.5) 50.0 (44.7;55.3) 0.94 (0.81;1.08) 24.9 (21.3;28.6) 22.5 (17.9;27.1) 0.80 (0.62;1.03) 9 to 11 40.8 (35.6;45.9) 43.4 (39.0;47.7) 1.12 (0.95;1.31) 14.6 (11.1;18.1) 12.5 (9.7;15.4) 0.99 (0.65;1.25)
12 or more 42.7 (37.0;48.4) 45.3 (40.7;50.0) 1.05 (0.90;1.24) 13.3 (9.2;17.5) 11.4 (8.5;14.2) 0.85 (0.56;1.26) Total 47.3 (44.4;50.3) 47.3 (44.2;50.5) 1.00 (0.91;1.10) 18.8 (16.3;21.2) 17.6 (14.9;20.2) 0.84 (0.70;1.02)
a Adjusted for variables which appear in the Table
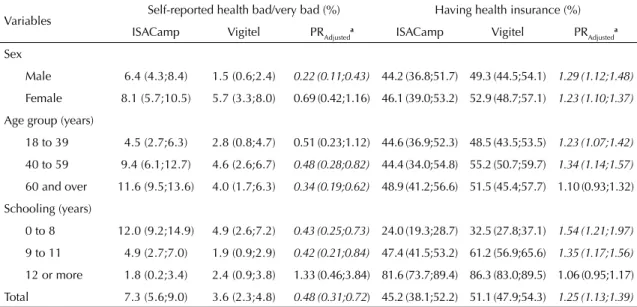
Table 3. Comparison of estimates for worse self-rated health and having health insurance, according to sex, age and schooling. ISACamp and Vigitel. Campinas, Southeastern Brazil, 2008.
Variables Self-reported health bad/very bad (%) Having health insurance (%) ISACamp Vigitel PRAdjusteda ISACamp Vigitel PR
Adjusted
a
Sex
Male 6.4 (4.3;8.4) 1.5 (0.6;2.4) 0.22 (0.11;0.43) 44.2 (36.8;51.7) 49.3 (44.5;54.1) 1.29 (1.12;1.48)
Female 8.1 (5.7;10.5) 5.7 (3.3;8.0) 0.69 (0.42;1.16) 46.1 (39.0;53.2) 52.9 (48.7;57.1) 1.23 (1.10;1.37)
Age group (years)
18 to 39 4.5 (2.7;6.3) 2.8 (0.8;4.7) 0.51 (0.23;1.12) 44.6 (36.9;52.3) 48.5 (43.5;53.5) 1.23 (1.07;1.42)
40 to 59 9.4 (6.1;12.7) 4.6 (2.6;6.7) 0.48 (0.28;0.82) 44.4 (34.0;54.8) 55.2 (50.7;59.7) 1.34 (1.14;1.57)
60 and over 11.6 (9.5;13.6) 4.0 (1.7;6.3) 0.34 (0.19;0.62) 48.9 (41.2;56.6) 51.5 (45.4;57.7) 1.10 (0.93;1.32)
Schooling (years)
0 to 8 12.0 (9.2;14.9) 4.9 (2.6;7.2) 0.43 (0.25;0.73) 24.0 (19.3;28.7) 32.5 (27.8;37.1) 1.54 (1.21;1.97)
9 to 11 4.9 (2.7;7.0) 1.9 (0.9;2.9) 0.42 (0.21;0.84) 47.4 (41.5;53.2) 61.2 (56.9;65.6) 1.35 (1.17;1.56)
12 or more 1.8 (0.2;3.4) 2.4 (0.9;3.8) 1.33 (0.46;3.84) 81.6 (73.7;89.4) 86.3 (83.0;89.5) 1.06 (0.95;1.17)
Total 7.3 (5.6;9.0) 3.6 (2.3;4.8) 0.48 (0.31;0.72) 45.2 (38.1;52.2) 51.1 (47.9;54.3) 1.25 (1.13;1.39)
aAdjusted for the variables which appear in the Table
ISACamp: Health Survey Campinas; Vigitel: Monitoring system for Risk and Protective Factors for Chronic Diseases Telephone Survey
The fi gures in italic show differences in the indicators analyzed
Table 4. Comparison between estimates for coverage of mammograms and smear tests at least once and in the preceding 12
months. ISACamp and Vigitel. Campinas, Southeastern Brazil, 2008.
Variables Mammogram at least once (%) Mammogram in the preceding 12 months (%) ISACamp Vigitel PRAdjusted
a ISACamp Vigitel PR
Adjusted
a
Age group (years)
40 to 59 80.1 (74.1;86.1) 89.1 (85.4;92.8) 1.12 (1.03;1.21) 63.1 (57.0;69.3) 61.3 (55.4;67.3) 0.98 (0.86;1.12)
60 and over 80.1 (76.9;83.3) 89.6 (85.1;94.1) 1.12 (1.05;1.20) 45.6 (40.2;50.9) 54.0 (45.8;62.3) 1.20 (0.98;1.45)
Schooling (years)
0 to 8 76.9 (71.8;81.9) 87.5 (83.4;91.7) 1.14 (1.05;1.25) 52.6 (46.8;58.3) 55.4 (48.7;62.1) 1.02 (0.86;1.21)
9 to 11 82.4 (73.3;91.5) 92.2 (87.5;97.0) 1.12 (0.98;1.27) 57.8 (47.2;68.5) 68.3 (59.6;77.0) 1.15 (0.92;1.44)
12 or more 88.7 (80.7;96.8) 93.3 (89.2;97.4) 1.06 (0.95;1.19) 72.6 (63.7;81.6) 64.4 (55.6;73.1) 0.89 (0.73;1.07)
Total 80.1 (75.9;84.4) 89.3 (86.3;92.2) 1.12 (1.05;1.20) 57.7 (52.9;62.4) 59.2 (54.3;64.0) 1.01 (0.90;1.13)
Smear test at least once (%) Smear test in the preceding 12 months (%)
Age group (years)
20 to 39 87.9 (84.0;91.8) 92.1 (87.9;96.4) 1.05 (0.98;1.11) 67.9 (62.1;73.7) 71.5 (65.6;77.4) 1.04 (0.92;1.18)
40 to 59 99.6 (98.7;100.0) 97.6 (95.6;99.7) 0.98 (0.96;1.00) 60.1 (52.9;67.3) 67.8 (62.5;73.2) 1.14 (0.99;1.30)
60 and over 91.8 (89.5;94.1) 95.7 (92.9;98.4) 1.04 (1.00;1.09) 45.1 (40.5;49.6) 59.1 (51.3;66.9) 1.32 (1.12;1.56)
Schooling (years)
0 to 8 95.0 (93.0;97.0) 95.2 (91.7;98.8) 1.00 (0.96;1.05) 54.0 (48.4;59.6) 64.7 (58.7;70.6) 1.18 (1.02;1.36)
9 to 11 92.5 (87.6;97.4) 92.7 (88.6;96.8) 1.00 (0.94;1.08) 61.9 (53.1;70.6) 69.8 (64.0;75.7) 1.12 (0.95;1.32)
12 or more 88.9 (83.3;94.5) 95.7 (92.9;98.5) 1.08 (1.01;1.16) 76.1 (67.7;84.5) 74.5 (68.8;80.1) 0.96 (0.84;1.10)
Total 92.9 (90.9;94.9) 94.7 (92.5;96.9) 1.02 (0.99;1.06) 61.1 (56.7;65.4) 68.2 (64.5;71.8) 1.10 (1.01;1.20)
aAdjusted for the variables which appear in the Table
ISACamp: Health Survey Campinas; Vigitel: Monitoring system for Risk and Protective Factors for Chronic Diseases Telephone Survey
There were no differences observed in self-rated health for women, those aged 18 to 39 and those who had higher levels of education. For the other categories, the estimates obtained by the telephone survey were lower than those obtained by the household survey (p < 0.05).Considering the other categories, the estimates obtained by the telephone survey were lower than the obtained by the household survey (p < 0.05).
Higher prevalence of having health insurance was observed from the Vigitel data, except among the elderly and for those with higher levels of education. The overall estimate of health plan coverage among individuals was 25% higher among those surveyed by telephone (Table 3).
The coverage for mammography was 80.1% (95%CI 75.9;84.4) in the ISACamp survey and was almost 12% higher in the Vigitel survey, irrespective of age or education (Table 4). Differences were observed in age groups and for women with lower levels of education. There was no statistical signifi cance with regards to having had the examination in the preceding 12 months.
There were no differences in overall estimates for ever having had a pap smear test. The prevalence obtained in the Vigitel survey was 8% higher for women with a higher level of education, irrespective of age. The overall estimate reached by the telephone survey for having had the examination in the preceding 12 months was around 10% higher than that of the household survey. The size of this difference when evaluated according to subgroup was 32% for the elderly and 18% for those who reported lower levels of education (Table 4).
DISCUSSION
This study compares estimates of health indicators commonly investigated health indicators, obtained from household (ISACamp) and telephone (Vigitel) interviews. The surveys showed similar overall results of four of the eight items assessed: being overweight, smoking, having had a smear test at least once and having had a mammogram in the preceding 12 months. For the estimates of worse self-rated health, having health insurance, having had a mammogram at least once and a smear test in the preceding 12 months, it was possible to verify differences of a variety of sizes, with signifi cantly higher estimates from the Vigitel survey, except in the case of worse self-rated health.
The validity of self-reported weight and height showed a high correlation between measured and reported data. In spite of the tendency to underestimate weight and exaggerate height.9,17 In this study, similarities were observed between overall estimates and socio-demographic variables for being overweight. Nelson et al16 (2003) using data from the National Health Interview Survey (NHIS) and the (Behavioral Risk
Factor Surveillance System) (BRFSS) compared esti-mates for weight, height and body mass index (BMI) and observed signifi cant differences in overall BMI estimates for the population aged ≥ 18 and according to specifi c groups, with greater prevalence obtained from the household interview (NHIS) data. Upon comparing estimates of BMI with data from the 20004 BRFSS, the NHIS and the National Health and Nutrition Examination Survey (NHANES), no differences were found in overall estimates between the BRFSS and the NHIS, although the rates were higher for the NHANES data.7 However, as in the study by Nelson et al16 (2003), cut off points specifi c to BMI were not used.
Epidemiological studies have identifi ed new locations for cancer since the fi rst link between smoking and lung cancer was established, with a causal link to tobacco.19 Policies aiming to reduce and prevent tobacco consump-tion have contributed to the fall in smoking in Brazil and reduced the burden which smoking related illness represents for the health system.23 For Wunschet al23 (2010), knowing the extent of the problem in different subgroups of the population is fundamental for adopting and monitoring effective campaigns to control smoking.
No statistically signifi cant differences were observed when comparing the percentage of adult smokers, which implies that obtaining estimates for this indicator via telephone interviews is viable. Overall estimates of the percentages of smokers presented similar values to data from the 2004 BRFS and the NHIS. Upon comparing NHANES with BRFSS, the household survey showed signifi cantly higher overall prevalence than those obtained by the telephone survey.7 Arday et al1 (1997) used data from the 1985, 1989 and 1992/1993 BRFSS and from the Current Population Survey (CPS), a survey conducted in every American state by the Census Bureau, in order to compare the prevalence of smoking and they observed similarities.
Population based studies including self-rated health as an indicator enables the researcher to know about health conditions as perceived by the individual. In the last few decades, longitudinal studies have shown the ability to predict mortality in adults and functional decline in the elderly. For Macintyre et al14 (2005), this is a relevant indicator, even at ages when mortality rates are low.
Having health insurance in Brazil is an indicator which enables the assessment of cover by the supplementary health system. The study by Lima-Costa13 (2004) indicates greater use of preventative services among individuals who have private health insurance, even when the results are stratified by education. This suggests social inequalities with regards to access to health care services.
In this study, except for the elderly and those with higher levels of education, the Vigitel survey showed higher percentages of having health insurance. Bernal & Silva4 (2009) showed that having at least one health insurance plan was positively associated to access to a residential landline. Data on the population with a landline are biased towards coverage by a health insurance plan.8,11
Fahimi et al7 (2008) found similarities when comparing overall estimates of lack of health insurance in the US, using data from the 2004 BRFSS and NHIS. Similarities in the overall estimates of these surveys with the 1997 data were observed by Nelson et al16 (2003).
In spite of recognized methods of prevention and early detection in Brazil, estimates for 2012, valid for 2013, show 52,680 and 17,540 cases of breast cancer and cervical cancer respectively.d According to Viacava et al22 (2009),estimates of coverage for mammograms obtained from household surveys are used in various countries to monitor campaigns for early detection of breast cancer and to evaluate the effects of increasing coverage in reducing mortality and increasing survival rates. Estimates of mammogram and smear test coverage in Brazil are obtained from data from various population surveys.6,8,12,21,22
No statistically signifi cant differences were found for mammogram coverage in the preceding 12 months, but the estimates from the Vigitel survey were higher for having had the examination at least once, as was the case in the study using data from household and tele-phone interviews in São Paulo, Southeastern Brazil.20 Davis et al5 (2010) observed higher estimates for the phone surveys in the periods 1997-1999 and 2000-2003 based on NHIS and BRFSS data. Viacava et al22 (2009) showed signifi cant differences in mammogram cove-rage in the three years preceding the interview using data from household and telephone surveys for all of the state capitals analyzed, with greater coverage obtained by the Vigitel survey. Studies show that data referring only to the population who have a landline may have signifi cant biases for having had a mammogram,11,20,21 especially in municipalities with low numbers of landlines.22
The estimates differ for having had a smear test in the preceding 12 months, with coverage around 10% higher
among those interviewed by telephone. Data from São Paulo for 2008 show higher coverage for telephone surveys both for having had a smear test at least once (4%) and in the preceding 12 months (14%).21
Studies on comparing estimates from different meth-odologies for collecting data in population surveys are documented in the international literature.1,5,7,16 The increasing number of surveys carried out in Brazil over the last few decades require studies on: method-ological questions involving sample design; selection procedures; techniques for assessing data quality and validity; post-stratifi cation strategies for minimizing the no-response effects; evaluating the effects of applying different measuring tools; and comparing estimates obtained from different types of survey. However, national experience is of recent date.8,10,21,22
The ISACamp and Vigitel surveys are population based with different sample designs and different methods of collecting data. However, comparison was possible as they had many similarities: they were carried out in 2008, they did not use proxy data and the questions used for some of the indicators were analogous.
Analyses indicated that part of the overall results were similar and, for those which presented significant differences, a tendency for the telephone survey data to overestimate was noted, except in the case of worse self-reported health.
Interpreting the results of those indicators which showed differences between the two surveys required detailed analysis of its epidemiological signifi cance. In spite of overestimating prevalence, the estimates obtained by the Vigitel survey overall, converged in the same direction as those found by the household survey.
This survey compared estimates of indicators inves-tigated using different types of surveys and enabled the statistical differences in some variables, whose post-stratifi cation adjustments are still not suffi cient to cancel out the defects associated with those without a telephone being excluded, to be viewed in perspective. Moreover, it demonstrated that the estimates obtained by the Vigitel survey show consistency, which has also been observed in other studies.8,10,21 Although there are signifi cant differences, the consequences related to using such estimates in implementing public health campaigns and programs may be considered of minor importance.
Studies which compare estimates of these and other indicators for both types of surveys are necessary to confi rm the fi ndings and validate data relevant to public health. These data can be made available rapidly and systematically through a dynamic and effi cient system of collection such as the telephone survey (Vigitel).
The authors declare that there are no confl icts of interest. 1. Arday DR, Tomar SL, Nelson DE, Merritt RK,
Schoolev MW, Mowery P. State smoking prevalence estimates: a comparison of the Behavioral Risk Factor Surveillance System and Current Population Surveys. Am J Public Health. 1997;87(10):1665-9. DOI:10.2105/AJPH.87.10.1665
2. Barros MBA. A importância dos sistemas de informação e dos inquéritos de base populacional para avaliações de saúde. Epidemiol Serv Saude. 2004;13(4):199-200. DOI:10.5123/S1679-49742004000400001
3. Barros MBA. Inquéritos domiciliares de saúde: potencialidades e desafi os. Rev Bras Epidemiol. 2008;11(supl 1):6-19. DOI:10.1590/S1415-790X2008000500002
4. Bernal R, Silva NN. Cobertura de linhas telefônicas residenciais e vícios potenciais em estudos
epidemiológicos. Rev Saude Publica. 2009;43(3):421-6. DOI:10.1590/S0034-89102009005000024
5. Davis WW, Parsons VL, Xie D, Schenker N, Town M, Raghunathan TE, et al. State-Based Estimates of Mammography Screening Rates Based on Information from Two Health Surveys. Public Health Rep. 2010;125(4):567-78.
6. Dias-da-Costa JS, Olinto MTA, Gigante DP, Menezes AMB, Macedo S, Borba AT, et al. Cobertura do exame citológico na cidade de Pelotas, Rio Grande do Sul, Brasil. Cad Saude Publica. 2003;19(1):191-7. DOI:10.1590/S0102-311X2003000100021
7. Fahimi M, Link M, Mokdad A, Schwartz DA, Levy P. Tracking chronic disease and risk behavior prevalence as survey participation declines: statistics from the Behavioral Risk Factor Surveillance System and other national surveys. Prev Chronic Dis. 2008;5(3):A80. 8. Ferreira AD, César CC, Malta DC, Andrade ACS,
Ramos CGC, Proietti FA, et al. Validade de estimativas obtidas por inquérito telefônico: comparação entre Vigitel 2008 e Inquérito de Saúde em Beagá. Rev Bras Epidemiol. 2011;14(Supll 1):16-30. DOI:10.1590/S1415-790X2011000500003
9. Fonseca MJM, Faerstein E, Chor D, Lopes CS. Validade de peso e estatura informados e índice de massa corporal: Estudo Pré-Saúde. Rev Saude Publica. 2004;38(3):392-8. DOI:10.1590/S0034-89102004000300009
10. Francisco PMSB, Barros MBA, Segri NJ, Alves MCGP, Cesar CLG, Malta DA. Comparação de estimativas para o auto-relato de condições crônicas entre inquérito domiciliar e telefônico - Campinas (SP), Brasil. Rev Bras Epidemiol. 2011;14(Supll 1):5-15. DOI:10.1590/S1415-790X2011000500002
11. Francisco PMSB, Barros MBA, Segri NJ, Cesar CL, Alves MCGP. Inquérito de saúde no Município de Campinas (ISACamp): comparação de estimativas segundo posse de linha telefônica residencial. Cad Saude Publica. 2011;27(10):1951-60. DOI:10.1590/S0102-311X2011001000008
12. Lima-Costa MF, Matos DL. Prevalência e fatores associados à realização da mamografi a na faixa etária de 50-69 anos: um estudo baseado na
Pesquisa Nacional por Amostra de Domicílios (2003). Cad Saude Publica. 2007;23(7):1665-73. DOI:10.1590/S0102-311X2007000700018
13. Lima-Costa MF. Estilos de vida e uso de serviços preventivos de saúde entre adultos fi liados ou não a plano privado de saúde (inquérito de saúde de Belo Horizonte). Cienc Saude Coletiva. 2004;9(4):857-64. DOI:10.1590/S1413-81232004000400008
14. Macintyre S, Der G, Norrie J. Are there socioeconomic differences in responses to a commonly used self report measure of chronic illness? Int J Epidemiol. 2005;34(6):1284-90. DOI:10.1093/ije/dyi200
15. Monteiro CA, Moura EC, Jaime PC, Lucca A, Florindo AA, Figueiredo ICR, et al. Monitoramento de fatores de risco para as doenças crônicas por entrevistas telefônicas. Rev Saude Publica. 2005;39(1):47-57. DOI:10.1590/S0034-89102005000100007 16. Nelson DE, Powell-Griner E, Town M, Kovar MG. A
comparison of national estimates from the National Health Interview Survey and the Behavioral Risk Factor Surveillance System. Am J Public Health. 2003; 93(8):1335-41. DOI:10.2105/AJPH.93.8.1335
17. Peixoto MRG, Benício MHD, Jardim PCBV. Validade do peso e da altura auto-referidos: o estudo de Goiânia. Rev Saude Publica. 2006;40(6):1065-72. DOI:10.1590/ S0034-89102006000700015
18. Peixoto MRG, Monego ET, Alexandre VP, Souza RGM, Moura EC. Monitoramento por entrevistas telefônicas de fatores de risco para doenças crônicas: experiência de Goiânia, Goiás, Brasil. Cad Saude Publica. 2008;24(6):1323-33. DOI:10.1590/S0102-311X2008000600013
19. Secretan B, Straif K, Baan R, Grosse Y, El Ghissassi F, Bouvard V, et al. A review of human carcinogens - Part E: tobacco, areca nut, alcohol, coal smoke, and salted fi sh. Lancet Oncol. 2009;10(11):1033-4. DOI:10.1016/S1470-2045(09)70326-2
20. Segri NJ, Cesar CLG, Barros MBA, Alves MCGP, Carandina L, Goldbaum M. Inquérito de saúde: comparação dos entrevistados segundo posse de linha telefônica residencial. Rev Saude Publica. 2010;44(3):503-12. DOI:10.1590/S0034-89102010005000012
21. Segri NJ, Francisco PMSB, Alves MCGP, Barros MBA, Cesar CLG, Goldbaum M, et al. Práticas preventivas de detecção de câncer em mulheres: comparação das estimativas dos inquéritos de saúde (ISA-Capital) e vigilância de fatores de risco e proteção para doenças crônicas por inquérito telefônico (Vigitel-São Paulo). Rev Bras Epidemiol. 2011;14(Supl.1):31-43. DOI:10.1590/ S1415-790X2011000500004
22. Viacava F, Souza Jr PRB, Moreira RS. Estimativas da cobertura de mamografi a segundo inquéritos de saúde no Brasil. Rev Saude Publica. 2009;43(Supll 2):117-25. DOI:10.1590/S0034-89102009000900015
23. Wünsch Filho V, Mirra AP, López RVM, Antunes L. Tabagismo e câncer no Brasil: evidências e perspectivas. Rev Bras Epidemiol. 2010;13(2):175-87. DOI:10.1590/ S1415-790X2010000200001