CLUSTERS AND PIVOTS FOR EVALUATING A LARGE NUMBER OF ALTERNATIVES IN AHP
Alessio Ishizaka
Received July 27, 2010 / Accepted June 15, 2011
ABSTRACT.AHP has been successful in many cases but it has a major limitation: a larger number of alter-natives requires a high number of judgements in the comparison matrices. In order to reduce this problem, we present a method with clusters and pivots. This method also helps with a further four problems of the Analytic Hierarchy Process. It enlarges the comparison scale, facilitates the construction of a consistent or near consistent matrix, eliminates the problem of the choice of the priorities derivation method and allows the use of incomparable alternatives.
Keywords: supplier selection, Analytic Hierarchy Process (AHP), Multicriteria Decision Making (MCDM).
1 INTRODUCTION
The Analytic Hierarchy Process (AHP) is a multi-criteria decision making method developed by Saaty (1977; 1980). Since its inception, it has been applied successfully on numerous occasions: see for example the reviews (Zahedi, 1986; Golden & Wasilet al., 1989; Shim, 1989; Vargas, 1990; Saaty & Forman, 1992; Forman & Gass, 2001; Kumar & Vaidya, 2006; Omkarprasad & Sushil, 2006; Ho, 2008; Liberatore & Nydick, 2008; Sipahi & Timor, 2010). The method is similar to the weighted sum model with the exception of the weight allocation process. AHP is a successive pairwise comparison process between each criterion and each alternative, rather than a simultaneous process like the weighted sum model. Psychologists have used this technique for a long time to compare affective alternatives (Yokoyama, 1921; Saaty & Ozdemir, 2003). They argue it is easier and more accurate to express one’s opinion on only two alternatives than simultaneously on all the alternatives. The absence of units is another advantage: a comparison is a relative value or a quotient a/b of two quantities a and b of the same kind. The decision maker does not need to give a numerical judgement; instead a relative verbal appreciation, more familiar in our daily lives, is sufficient. Saaty has proposed a comparison scale of nine levels (see Table 1).
Table 1– Scale of relative importance according to Saaty (1977; 1980) .
Intensity
Definition of importance
1 Equal importance
2 Weak
3 Moderate importance
4 Moderate plus
5 Strong importance
6 Strong plus
7 Very strong or demonstrated importance
8 Very, very strong
9 Extreme importance
However Saaty’s scale sometimes suffers from shortcomings (Dyer, 1990; Ho & Xuet al., 2010). Some decision problems need a larger scale. AHP also suffers from other criticisms:
– the number of required comparisons could be very high,
– only consistent or near consistent comparison matrices can be used to calculate meaningful priorities which could often necessitate many reconsiderations of the entries,
– the priorities depend on the method used to derive them, – incomparable alternatives are not allowed.
This paper shows how clusters and pivots can solve these problems.
2 CLUSTERS AND PIVOTS
2.1 Description of the method
The clusters and pivots method is useful for application on matrices of high rank, when the number of pairwise comparison becomes overwhelming. It is based on four steps:
a) For each criterion the alternatives are preordered.
Each criterion produces another order otherwise all criteria would be a replicate of them-selves and the problem would be mono-criterion.
b) Alternatives are divided into clusters.
– either the cluster contains 7 elements. Psychologists have observed that it is difficult to evaluate more than 7 elements (Saaty & Ozdemir, 2003). Therefore, it is recom-mended to build clusters that do not contain more than 7 elements.
– or the entered comparison is 9. As no higher intensity of preference is available on the comparison scale (Table 1), it is appropriate to close the cluster.
The last compared alternative becomes the pivot at the boundary of both clusters. The same process is repeated with the pivot until 7 elements are in the cluster or a comparison value of 9 is entered, or all entries are provided. In the Figure 1, the alternative D is the pivot.
c) Comparisons are entered in clustered matrices and priorities are calculated.
d) Priorities of the clusters are joined with a common element: “the pivot”.The pivot is used for the conversion rate between two clusters.
In AHP all alternatives are compared with each other in a unique comparison matrix, which can be perceived as a one-cluster problem. In a scoring model, direct judgements are used. We can consider each element to be a separate cluster. The AHP and the scoring model represent the two extremes, where 1 or n clusters are used. Our model is the middle way between these two methods.
The next sections detail the advantages of clusters and pivots in AHP.
A B C D E F
A 1
B 1
C 1
D 1
E 1
F 1
Figure 1– Building clusters.
2.2 Comparison scale
Because the 1-9 scale sometimes suffers from shortcomings, Saaty (2001) has already proposed to use clusters and pivots to extend the comparison scale. The scale will be extended from 1-9 to 1-9n, wherenis the number of clusters.
2.3 Reduction of the number of entries
Central to the analysis stage of the Analytic Hierarchy Process (AHP) is a redundant pairwise comparison process for entering judgements among defined alternatives or criteria. For each local priority vector,(n2−n)/2 comparisons are required (wherenis the dimension of the matrix). It is known that the total number of comparisons and the demands placed upon the decision maker can become excessive as the number of alternatives, criteria and hierarchical levels increase. For example, a simple hierarchy with nine alternatives and five criteria would require the decision maker to perform(52−5)/2+5∙(92−9)/2 = 190 paired comparisons. In problems with
very large hierarchies, the total number of comparisons can number in the thousands. In group decisions, the problem is exacerbated since each comparison carries the potential for lengthy debate.
In fact, only the firstn−1 comparisons are actually necessary; the remaining comparisons are
redundant but valuable to crosscheck judgments, measure consistency and increase accuracy. Realizing these facts, Harker (1987) developed a procedure for calculating AHP priorities with missing judgements, a gradient procedure for choosing the next comparison, and stopping rules after sufficient redundancy has been archived. However this method, allowing one to make fewer judgements, has a corresponding loss of accuracy (Forman, 1993).
We suggest subdividing a large number of alternatives into relatively homogenous groups for assessment. Clusters also considerably reduce the number of entries. For example, nine alter-natives and five criteria, when working with two clusters of three criteria, two clusters of four alternatives and one cluster of three alternatives (Fig. 2) would require only 2∙(32−3)/2+5∙
2∙(42−4)/2+5∙(32−3)/2=72 entries. Without clusters, 190 entries are required.
Goal
criteria 1 criteria 2 criteria 3 criteria 4 criteria 5
S1 S2 S3 S4 S5 S6 S7 S8 S9
Figure 2– Hierarchy with 5 criteria and 9 suppliers; dashed line highlights clusters.
2.4 Consistency
A pairwise matrix is called consistent if the transitivity (1) and the reciprocity (2) rules are respected:
ai,j =ai,k∙ak,j (1)
ai,j =1/aj,i (2)
The calculated priorities are plausible only if the comparison matrices are consistent or near con-sistent. Especially for high order matrices, consistency is difficult to reach because the number of transitive rules (1) to be satisfied increases quadratically.
To improve an inconsistent matrix, a user can be urged to reconsider pairwise comparisons until the consistency measure proves to be satisfactory (Harker, 1987). Feedback after the completion of the comparison matrix is frustrating to the user, because it gives no hints as to what should be reconsidered in regard to the comparisons. In a previous paper (Ishizaka & Lusti, 2004), an expert module intervening after each event where a pairwise comparison contradicts the comparisons made so far, then explaining it and suggesting consistent alternatives was presented. In such an approach, the user is guided through a sequence of four steps, which lead to a consistent or near consistent matrix. However helpful the method may be, it is difficult to improve the consistency for high order matrices. Often the user does not know which alternative to choose to improve the consistency.
Clusters and pivots split high-order matrices, which decreases the dimension. The consistency improvement is easier because fewer transitive rules have to be considered. For example, in two clusters of four alternatives, only 2∗4=8 transitive rules (without considering reciprocal) have to be considered. Without cluster, the comparison matrix would be of dimension 7 with 35 transitive rules to be considered!
2.5 Derivation of priorities
Different methods have been developed to derive priorities. They can be divided into two groups: the eigenvalue approach and the methods minimizing the distance between the user-defined ma-trix and the nearest consistent mama-trix.
2.5.1 Eigenvalue approach
Saaty (1977; 1980) proposes the principal eigenvectorpas the desired priorities vector. It is derived from the following equation:
A∙p=λ∙p (3)
whereAis the comparison matrix;pis the priorities vector; andλis the maximal eigenvalue. Saaty justifies the eigenvalue approach for slightly inconsistent matrices with the perturbation theory, which says that slight variations in a consistent matrix imply slight variations of the eigenvector and the eigenvalue.
The rank reversal problem for scale inversion is the most pertinent criticism of the eigenvalue method (Johnson & Beineet al., 1979). The solution of the eigenequation (3) gives the right eigenvectorp, which is not necessary the same as the left eigenvectorp′: the implicationp∙A=
2.5.2 Geometric mean
The priorities are given by the geometric mean. The geometric mean minimizes the logarithmic error (Crawford & Williams, 1985):
n
X
i=1
n
X
j=1
ln(ai j)−ln
pi
pj
2
(4)
whereai j is the comparison betweeni and j; pi is the priority ofi; andn is the dimension of
the matrix.
This method is insensitive to an inversion of the scale: the geometric mean of the rows and the columns give the same ranking.
2.5.3 Other methods
Many other methods are proposed. Some minimise the Euclidian distance between the user-defined matrix and the nearest consistent matrix in different metrics. These methods are difficult to apply. In particular, the least squares method has several minima and makes the choice am-biguous. Saaty & Vargas (Saaty & Vargas, 1984) give an example where the least squares method produces an illogical result.
Other methods (e.g.the mathematical mean of the row), who provides exactly the same priorities for consistent matrices than any other classical method, has been also used. However, their application on inconsistent matrices has not been yet mathematically justified. These methods are rather used for fast calculations.
2.5.4 Choice of the derivation method
A heated discussion has arisen over the “best” method. One side supports the eigenvalue method (Saaty & Vargas, 1984; Saaty & Vargas, 1984; Harker & Vargas, 1987; Saaty, 2003), the other side argues for the geometric mean (Barzilai & Cooket al., 1987; Barzilai & Golany, 1990; Barzilai, 1997; Aguar ´on & Jim´enez, 2000; Barzilai, 2001; Aguar ´on & Moreno-Jim´enez, 2003; Leskinen & Kangas, 2005).
In fact, the right eigenvalue method, the left eigenvalue method and the geometric mean produce the same result for matrices of order three (Saaty, 2001). For matrices of order four, the ranking contradiction is rare (Ishizaka & Lusti, 2006). The use of clusters and pivots erases the problem of the choice of the derivation method if matrices are reduced at order to three or four, which provides same or similar results with all methods.
2.6 Incomparable alternatives
more difficult to quantify precisely how many times a Mercedes is more prestigious than a Fiat because of the large difference. Typically, they do not belong to the same class of prestige. To bypass this problem, we gather comparable alternatives in clusters – thus alternatives which cannot be compared are separated. To unify the clusters we use a common alternative, the pivot, for both clusters. The drawback of this process is to find a common alternative at the boundary of both clusters, which may not be trivial.
3 CASE STUDY: SUPPLIER SELECTION
3.1 Introduction
Suppliers are of tremendous importance to their clients. This importance is accentuated with the pressure to reduce the supply base (Ogden, 2006; Sarkar & Mohapatra, 2006). Wrong supplier selection could lead to serious consequences. Hoecht & Trott (2006) have enumerated several problems due to poor supplier and unhealthy buyer-supplier relationships. Recent surveys con-firm the importance given to the supplier selection process (Lieb & Bentz, 2005; Lieb & Bentz, 2006; Lieb & Butner, 2007), but the analysis of criteria for selection and measuring performance of supplier has been the focus of many researchers and purchasing practitioners since the 1960’s. The multicriteria nature of the problem was recognised very early. Aissaouiet al. (2007), De Boeret al. (2001), El-Sawalhiet al. (2007) and Hoet al. (2010) have compiled a review of selection methods. Among them, Analytic Hierarchy Process (AHP) has been widely used but only when the number of suppliers is small. In this case study, we will illustrate the use of clus-ters and pivots in AHP for the supplier selection problem among twelve candidates evaluated on the basis of their quality, on-time delivery and costs.
3.2 Quality
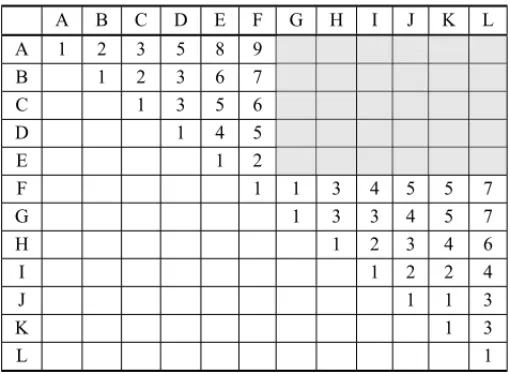
The twelve prospective suppliers A, B, C, D, E, F, G, H, I, J, K, L are preordered according to their quality. Then, A, the best supplier for quality, is compared successively with the next others until the entered comparison is 9 (Table 2). As the supplier A is 9 times better than F for its quality, the alternative F is declared the pivot: the last element in the first cluster and the first element in the second cluster. It can be noticed that the process requires 30 comparisons less than the classical AHP approach (in grey in Table 2).
Priorities are calculated for both clusters (Tables 3 and 4). Results of the second clusters are linked to the first one by dividing them by the ratio of the scores of the pivot F in the two clusters: 0.311/0.029.
3.3 Costs
Table 2– Comparison matrix for the criterion quality.
A B C D E F G H I J K L
A 1 2 3 5 8 9
B 1 2 3 6 7
C 1 3 5 6
D 1 4 5
E 1 2
F 1 1 3 4 5 5 7
G 1 3 3 4 5 7
H 1 2 3 4 6
I 1 2 2 4
J 1 1 3
K 1 3
L 1
Table 3– First cluster quality.
Suppliers Priority
F 0.311
G 0.289
H 0.157
I 0.097
J 0.061
K 0.057
L 0.028
Inconsistency Ratio: 0.03.
Table 4– Second cluster quality.
Suppliers Priorities Priorities linked with the first cluster
A 0.404 4.333
B 0.249 2.670
C 0.178 1.909
D 0.101 1.083
E 0.040 0.429
F 0.029 0.311
Inconsistency Ratio: 0.04.
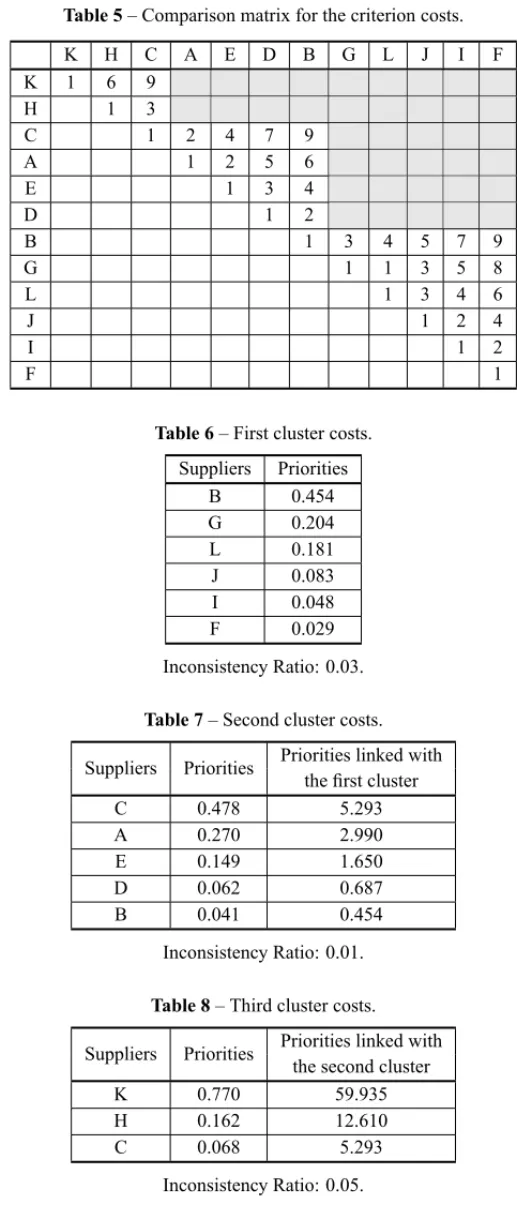
Table 5– Comparison matrix for the criterion costs.
K H C A E D B G L J I F
K 1 6 9
H 1 3
C 1 2 4 7 9
A 1 2 5 6
E 1 3 4
D 1 2
B 1 3 4 5 7 9
G 1 1 3 5 8
L 1 3 4 6
J 1 2 4
I 1 2
F 1
Table 6– First cluster costs.
Suppliers Priorities
B 0.454
G 0.204
L 0.181
J 0.083
I 0.048
F 0.029
Inconsistency Ratio: 0.03.
Table 7– Second cluster costs.
Suppliers Priorities Priorities linked with the first cluster
C 0.478 5.293
A 0.270 2.990
E 0.149 1.650
D 0.062 0.687
B 0.041 0.454
Inconsistency Ratio: 0.01.
Table 8– Third cluster costs.
Suppliers Priorities Priorities linked with the second cluster
K 0.770 59.935
H 0.162 12.610
C 0.068 5.293
3.4 On-time delivery
The twelve prospective suppliers are preordered according to the criterion costs: E, H, C, K, I, L, D, A, G, J, F, B. Two clusters are built with the alternatives A as pivot. The process requires 28 comparisons less than the classical AHP approach (in grey in Table 9). Results of the second clusters (Table 11) are linked to the first one (Table 10) by dividing them by the ratio of the scores of the pivot B in the two clusters: 0.460/0.021.
Table 9– Comparison matrix for the criterion on-time delivery.
E H C K I L D A G J F B
E 1 2 3 5 5 7 8 9
H 1 2 4 4 6 7 8
C 1 2 2 5 6 7
K 1 1 3 4 5
I 1 3 4 5
L 1 2 3
D 1 2
A 1 3 3 5 6
G 1 1 4 5
J 1 4 4
F 1 2
B 1
Table 10– First cluster on-time. Suppliers Priority
A 0.460
G 0.214
J 0.205
F 0.071
B 0.050
Inconsistency Ratio: 0.04.
Table 11– Second cluster on-time.
Suppliers Priorities Priorities linked with the first cluster
E 0.343 7.513
H 0.243 5.323
C 0.151 3.308
K 0.086 1.884
I 0.086 1.884
L 0.041 0.898
D 0.028 0.613
A 0.021 0.460
3.5 Criteria evaluation
The criteria quality, on-time delivery and costs are also evaluated in a pairwise matrix.
Table 12– Criteria evaluation.
Cost Quality On-time Priority
Cost 1 1/4 1/3 0.122
Quality 4 1 2 0.558
On-time 3 1/2 1 0.320
3.6 Criteria evaluation
Finally, the local priorities are aggregated (Table 13). The best supplier is K, thanks especially to its low costs.
Table 13– Final results.
On-time Quality Costs Global priority
Weight 0.122 0.558 0.32
A 0.46 4.333 2.99 3.431
B 0.05 2.67 0.454 1.641
C 3.308 1.909 5.293 3.163
D 0.613 1.083 0.687 0.899
E 7.513 0.429 1.65 1.684
F 0.071 0.311 0.029 0.191
G 0.214 0.289 0.204 0.253
H 5.323 0.157 12.61 4.772
I 1.884 0.097 0.048 0.299
J 0.205 0.061 0.083 0.086
K 1.884 0.057 59.935 19.441
L 0.898 0.028 0.181 0.183
4 CONCLUSION
Although AHP has been applied in numerous situations with impressive results, it can present certain problems. In particular, the high number of pairwise comparisons required may deter con-sidering large number of alternatives. In fact in the reviewed papers applying AHP for suppliers’ selection, the number of alternatives is small. In order to prevent an artificial early elimination of alternatives, we have presented in this paper a method with clusters and pivots. This technique, which can also be applied in other decision problems, has the following benefits:
– decreases the number of required comparisons,
– facilitates the construction of consistent or near consistent matrices,
– eliminates the problem of the choice of the derivation method because all methods provide the same result,
– gives the opportunity to avoid the evaluation of two alternatives, which are difficult to compare.
However, clusters and pivots should be used only when groups can be built so that the degree of association is strong between members of the same cluster and weak between members of different clusters. The pivot, which joins the two clusters, must be selected carefully because of its central role. Inaccuracies in comparisons involving the pivot will be propagated in all elements of the cluster. An abusive use of clusters will also reduce the property of redundancy and consistency check and therefore increase the inaccuracy.
Clusters and pivots help in five problems of AHP, but further research is needed to solve remain-ing problems of AHP:
– The rank reversal problem (Belton & Gear, 1983) has been much debated but never fully resolved, see a review in (Ishizaka & Labib, 2009; Ishizaka & Labib, 2011).
– The use of verbal scales may be ambiguous and its conversion to a numerical scale is subjective to the decision-maker (Donegan & Doddet al., 1992; Ishizaka & Balkenborget al., 2010).
– A ratio scale is inappropriate when an absolute zero does not exist on the preference scale (Barzilai, 2005).
– The consistency check has been criticized because it allows contradictory judgements in matrices (Kwiesielewicz & van Uden, 2004; Bana e Costa & Vansnick, 2008) or rejects reasonable matrices (Karapetrovic & Rosenbloom, 1999).
ACKNOWLEDGMENTS
I wish to thank Ian Stevens for the proofreading. I also thank the two anonymous reviewers for the valuable feedback and constructive criticism.
REFERENCES
[1] AGUARON´ J & MORENO-JIMENEZ´ J. 2000. Local Stability Intervals in the Analytic Hierarchy Process.European Journal of Operational Research,125(1): 113–132.
[2] AGUARON´ J & MORENO-JIMENEZ´ J. 2003. The Geometric Consistency Index: Approximated Thresholds.European Journal of Operational Research,147(1): 137–145.
[3] AISSAOUI N & HAOUARI M ET AL. 2007. Supplier selection and order lot sizing modeling: A review.Computers & Operations Research,34(12): 3516–3540.
[5] BARZILAIJ. 1997. Deriving Weights from Pairwise Comparisons Matrices.Journal of the Opera-tional Research Society,48(12): 1226–1232.
[6] BARZILAIJ. 2001. Notes on the analytic hierarchy process. Proceedings of the NSF Design and Manufacturing Research Conference, Tampa.
[7] BARZILAIJ. 2005. Measurement and preference function modelling.International Transactions in Operational Research,12(2): 173–183.
[8] BARZILAIJ & COOKWDET AL. 1987. Consistent weights for judgements matrices of the relative importance of alternatives.Operations research letters,6(1): 131–134.
[9] BARZILAIJ & GOLANYB. 1990. Deriving weights from pairwise comparison matrices: the additive case.Operations Research Letters,9(6): 407–410.
[10] BELTON V & GEAR A. 1983. On a Shortcoming of Saaty’s Method of Analytical Hierarchies. Omega,11(3): 228–230.
[11] CRAWFORDG & WILLIAMSC. 1985. A Note on the Analysis of Subjective Judgement Matrices. Journal of Mathematical Psychology,29(4): 387–405.
[12] DEBOERL & LABROEET AL. 2001. A review of methods supporting supplier selection.European Journal of Purchasing & Supply Management,7(2): 75–89.
[13] DONEGANH & DODDF ET AL. 1992. A new approach to AHP decision-making.The Statician, 41(3): 295–302.
[14] DYERJ. 1990. Remarks on the Analytic Hierarchy Process.Management Science,36(3): 249–258.
[15] EL-SAWALHI N & EATON D ET AL. 2007. Contractor pre-qualification model: State-of-the-art. International Journal of Project Management,25(5): 465–474.
[16] FORMAN E & GASS S. 2001. The Analytic Hierarchy Process – An Exposition. Operations Research,49(4): 469–486.
[17] FORMANEH. 1993. Facts and fictions about the analytic hierarchy process.Mathematical and com-puter modelling,17(4-5): 19–26.
[18] GOLDENB & WASILEET AL. 1989. The Analytic Hierarchy Process: Applications and Studies. Heidelberg, Springer-Verlag.
[19] HARKERP & VARGASL. 1987. The Theory of Ratio Scale Estimation: Saaty’s Analytic Hierarchy Process.Management Science,33(11): 1383–1403.
[20] HARKERPT. 1987. Incomplete pairwise comparisons in the analytic hierarchy process. Mathemati-cal Modelling,9(11): 837–848.
[21] HOW. 2008. Integrated analytic hierarchy process and its applications – A literature review. Euro-pean Journal of Operational Research,186(1): 211–228.
[22] HOW & XUXET AL. 2010. Multi-criteria decision making approaches for supplier evaluation and selection: A literature review.European Journal of Operational Research,202(1): 16–24.
[23] HOECHTA & TROTTP. 2006. Outsourcing, information leakage and the risk of losing technology based competencies.European Business Review,18(5): 395–412.
[25] ISHIZAKAA & LABIBA. 2009. Analytic Hierarchy Process and Expert Choice: benefits and limita-tions.OR Insight,22(4): 201–220.
[26] ISHIZAKAA & LABIBA. 2011. Review of the main developments in the analytic hierarchy process. Expert Systems with Applications,38(11): 14336–14345.
[27] ISHIZAKAA & LUSTIM. 2004. An Expert Module to Improve the Consistency of AHP Matrices. International Transactions in Operational Research,11(1): 97–105.
[28] ISHIZAKA A & LUSTI M. 2006. How to derive priorities in AHP: a comparative study.Central European Journal of Operations Research,14(4): 387–400.
[29] JOHNSONC & BEINEWET AL. 1979. Right-Left Asymmetry in an Eigenvector Ranking Procedure. Journal of Mathematical Psychology,19(1): 61–64.
[30] KARAPETROVIC S & ROSENBLOOME. 1999. A Quality Control Approach to Consistency Para-doxes in AHP. European Journal of Operational Research,119(3): 704–718.
[31] KUMARS & VAIDYAO. 2006. Analytic hierarchy process: An overview of applications.European Journal of Operational Research,169(1): 1–29.
[32] KWIESIELEWICZM &VANUDENE. 2004. Inconsistent and Contradictory Judgements in Pairwise Comparison Method in AHP.Computers and Operations Research,31(5): 713–719.
[33] LESKINENP & KANGASJ. 2005. Rank reversal in multi-criteria decision analysis with statistical modelling of ratio-scale pairwise comparisons.Journal of the Operational Research Society,56(7): 855–861.
[34] LIBERATORE M & NYDICKR. 2008. The analytic hierarchy process in medical and health care decision making: A literature review.European Journal of Operational Research,189(1): 194–207.
[35] LIEBR & BENTZ B. 2005. The North Amarican third party logistics in 2004: the provider CEO perspective.International Journal of Physical Distribution & Logistics Management,35(8): 595– 611.
[36] LIEBR & BENTZB. 2006. The 3PL Industry in Asia/Pacific.Supply Chain Management Review, 10(9): 10–15.
[37] LIEBR & BUTNER K. 2007. The North American Third-Party Logistics Industry in 2006: The Provider CEO Perspective.Transportation Journal,46(3): 40–52.
[38] OGDEN J. 2006. Supply base reduction: an empirical study of critical success factors.Journal of Supply Chain Management,42(4): 29–39.
[39] OMKARPRASADV & SUSHIL K. 2006. Analytic hierarchy process: an overview of applications. European Journal of Operational Research,169(1): 1–29.
[40] SAATYT. 1977. A scaling method for priorities in hierarchical structures.Journal of mathematical psychology,15(3): 234–281.
[41] SAATYT. 1980. The Analytic Hierarchy Process. New York, McGraw-Hill.
[42] SAATYT. 2001. Decision-making with the AHP: Why is the principal eigenvector necessary? Pro-ceedings of the sixth international symposium on the analytic hierarchy process (ISAHP 2001), Bern.
[44] SAATY T. 2003. Decision-making with the AHP: Why is the Principal Eigenvector necessary? European Journal of Operational Research,145(1): 85–91.
[45] SAATYT & FORMANE. (1992). The Hierarchon: A Dictionary of Hierarchies. Pittsburgh, RWS Publications.
[46] SAATYT & OZDEMIRM. 2003. Why the magic number seven plus or minus two.Mathematical and Computer Modelling,38(3-4): 233–244.
[47] SAATYT & VARGAS L. 1984. Comparison of Eigenvalue, Logarithmic Least Squares and Least Squares Methods in Estimating Ratios.Mathematical Modeling,5(5): 309–324.
[48] SAATY T & VARGAS L. 1984. Inconsistency and Rank Preservation. Journal of Mathematical Psychology,28(2): 205–214.
[49] SARKARA & MOHAPATRAP. 2006. Evaluation of supplier capability and performance: A method for supply base reduction.Journal of Purchasing and Supply Management,12(3): 148–163.
[50] SHIM J. 1989. Bibliography research on the analytic hierarchy process (AHP). Socio-Economic Planning Sciences,23(3): 161–167.
[51] SIPAHI S & TIMOR M. 2010. The analytic hierarchy process and analytic network process: an overview of applications.Management Decision,48(5): 775–808.
[52] VARGAS L. 1990. An overview of the analytic hierarchy process and its applications. European Journal of Operational Research,48(1): 2–8.
[53] YOKOYAMA M. 1921. The Nature of the affective judgment in the method of paired comparison. The American Journal of Psychology,32: 357–369.
[54] ZAHEDI F. 1986. The analytic hierarchy process: a survey of the method and its applications.