*e-mail: [email protected]
1. Introduction
Biopolymer electrolytes have potential applications in electrochemical devices such as electrode coatings, fuel cells, biosensors, bioelectrodes, rechargeable batteries, super capacitors, biopolymer membranes1-6 and turn out
to be an interesting, cost effective and attractive devices. The inherent structure, morphology, biocompatibility and biodegradability of biopolymers make them discrete in these applications. These electrochemical devices have high selectivity and ionic conductivity, acid, base and solvent resistance, excellent contact between synthetic and biological systems, pH sensitive and good mechanical properties1,2,7.
Chitosan (poly-β(1,4)-D-glucosamine) is an abundant, naturally occurring cationic biopolymer with reactive hydroxyl and amino group and has many electrical, chemical, and biological properties8-11. It has been used extensively for
biomedical applications like drug delivery systems, tissue engineering, separation membranes, and artiicial corneas, adhesives etc.12-15. It is used with synthetic polymers like
poly (vinyl alcohol) (PVA), poly (vinyl chloride) (PVC), poly (acrylonitrile) (PAN), poly (ethylene oxide) (PEO), (N-vinyl pyrrolidone) (PVP), poly (vinyl phosphoric acid)7,16-18 for the
synthesis of polymer electrolytes. PVA has non-polar carbon backbone and polar hydroxyl group and have good ionic
conductivity due to more charge carriers15. It is a synthetic
polymer which is biodegradable, non-toxic, biocompatible, and easy to process, have good ilm forming properties, and is highly hydrophilic with exceptional mechanical, chemical and thermal properties2,8,9,19,20.
Impedance spectroscopy is a technique in which real and imaginary parts of complex planes are determined which measures the electrical quantity as a function of the frequency of applied electric ield21,22. This procedure is
now being extensively used in a various scientiic areas such as biosensing, bioelectrodes, fuel cell membranes and biomolecular interactions. Different attempts have been made to study the conductivities of biopolymer based composites membranes, bioelectrodes, fuel cells membranes with good electrical properties1,23-26.
The purpose of this work was to provide ideas to analyze the electrical properties of CS-silane crosslinked-PVA blended ilms for bioelectrical applications. The effect of increase in PVA concentration and temperature on the electrical properties of blended ilms was studied. Silane crosslinker was used for blended crosslinked ilm which is simple, cheap, and safe used widely in biomaterials8,9,11,27. The blend ilms were
characterized by Fourier transform infrared spectroscopy for structural elucidation and impedance spectroscopy for the measurement of conductive properties.
An Investigation of Ac Impedance and Dielectric Spectroscopic Properties of Conducting
Chitosan-silane Crosslinked-poly (Vinyl Alcohol) Blended Films
Atif Islama*, Zahid Imranb, Tariq Yasinc, Naisa Gulla, Shahzad Maqsood Khana, Muhammad Shaiqc,
Aneela Sabira, Muhammad Azeem Munawara, Muhammad Hamid Razad, Tahir Jamila
aDepartment of Polymer Engineering and Technology, University of the Punjab, Lahore, 54590, Pakistan
bDepartment of Physics, COMSATS Institute of Information Technology, Park Road, Chak Shahzad, Islamabad 44000, Pakistan
cDepartment of Metallurgy and Materials Engineering, Pakistan Institute of Engineering and Applied Sciences, P.O. Nilore, Islamabad, 45650 Pakistan
dInstitute of Chemistry, University of the Punjab, Lahore, 54590 Pakistan
Received: July 31, 2015; Revised: September 21, 2015
The ilms of chitosan (CS)-silane crosslinked-poly(vinyl alcohol) (PVA) with different weight % were prepared. The effect on conductivity of CS/PVA blended ilms due to change in the concentration of PVA and temperature was investigated by impedance spectroscopy and showed good conductance properties. The complex impedance plots revealed single semicircular arcs indicating the bulk contribution to overall electrical behavior of all synthesized samples. The ac conductivity obeyed the Jonscher’s power law for all samples in the frequency range of 2 kHz to 2 MHz. The ionic conductivity of the ilms was increased with the increase in temperature for all synthesized samples which showed an increase in the number of effective charge carriers while it was decreased at a speciic higher temperature for each ilm. The observed activation energy for CP4, CP8 and CP10 were 0.431, 0.610 and 0.425 eV, respectively. These properties showed that the ilms were promising materials to be employed for conducting properties.
2015; 18(6) 1257 An Investigation of Ac Impedance and Dielectric Spectroscopic Properties of Conducting Chitosan-silane
Crosslinked-poly (Vinyl Alcohol) Blended Films
2. Experimental
2.1. Materials
CS having degree of deacetylation ca 75%, viscosity >200 cP, poly (vinyl alcohol), TEOS, acetic acid, sodium hydroxide, hydrochloric acid and methanol (99.7%) were purchased from Sigma-Aldrich (Milwaukee, WI). These chemicals were used as received without any further puriication.
2.2. Synthesis of blend
CS-silane crosslinked-PVA blend membranes were prepared using dissolution casting method. CS was dissolved in 0.5 M acetic acid under magnetic stirring. 4, 8 and 10% PVA was dissolved in deionized water at 80 °C for 1 h till clear solution was made. For CP4, CS (0.96 g) was dissolved in 0.5 M acetic acid (40 mL) and mixed with 0.04 g of PVA in 20 g of water and pH was set at about 3.5 at room temperature. Under constant stirring, TEOS (2%) was added to this blend and stirred for additional 1 h. This blended solution was poured on petri plates, dried at room temperature and inally in vacuum oven at 60 °C. Similarly, 8 and 10% PVA was added in CS (0.92 and 0.90 g, respectively) solutions. The samples were coded as CP4, CP8 and CP108. Detailed
formulation of these blends is given in Table 1.
3. Characterization
3.1. Fourier Transform Infrared spectroscopic
(FTIR) analysis
The FTIR spectra were scanned on FTIR spectrophotometer (Nicolet, 6700) from Thermo Electron Corporation, USA, at room temperature. Attenuated total relectance (ATR) technique with diamond crystal was used in the scanning range of 4000-500 cm–1 (200 average scans) and resolution
of 6.0 cm–1. The spectra of chitosan and PVA were also taken
for comparison with the product.
3.2. Impedance spectroscopy
The impedance measurements were carried out by using Agilent E4980A in the frequency range of 25Hz to 2MHz at room and elevated temperatures (313-403 K). The AC signal amplitude and voltage of 1volt was used for all samples. Appropriate sized blended ilms were cut and connected through wires by indium gallium paste. The thickness of the blend ilm was between 135-140 µm and the area between the contacts was about 1.00 cm2 as calculated by micrometer.
The geometric factor (GF = t/A, where, t = thickness of the sample and A = area between the connected wires) calculated was 0.00054 cm–1. Z-View software was used for itting
measured results28.
4. Result and Discussion
4.1. Fourier transform infrared spectroscopic
(FTIR) analysis
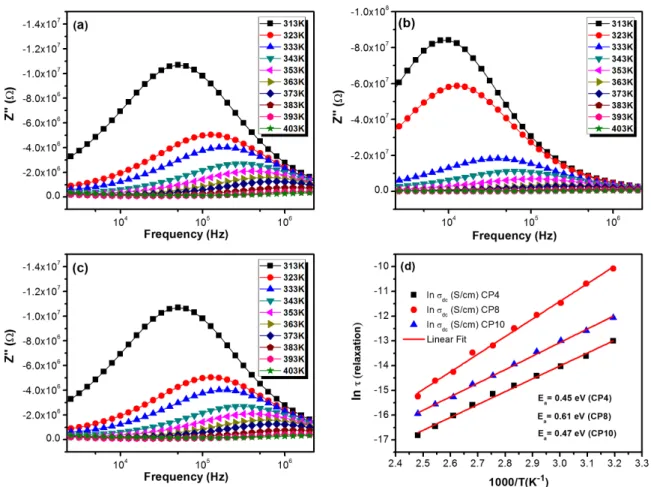
The FTIR spectra of the blends membranes with chitosan and PVA are shown in Figure 1 which shows bands at 893 and 1155 cm–1 conirmed the presence of
pyranose ring and saccharine structure of chitosan11,27,29.
The bands at 1644 and 1322 cm–1 are characteristics of
chitin and chitosan moieties, respectively and are reported as amide I and amide III peaks. The bands ranging from 1565 to 1510 cm–1 corresponds to amide II conirmed the
presence of partially de-acetylated chitosan. It can be seen from Figure 1b that with the increase in amount of PVA, amide I band was shifted from 1644 to 1634 cm–1 which
showed the existence of hydrogen bonding between the incorporated components. C-H vibrational stretching of alkyl groups has been observed between 3000-2840 cm–1.
A broad band at 3600-3200 cm–1 (Figure 1a) was due to
–NH symmetric vibration and -OH stretching of inter and intra-molecular hydrogen bonding29-32. It was also observed
that the broad region between 3600-3200 cm–1 was increased
in all blended ilms as compared to the chitosan and PVA. There was an increase in intensity and shift in the band from 1418 to 1402 cm–1 due to –CH
2 bending vibration in all
blends. The bending vibration of NH…CO (amide IV & V) was observed at 613 and 650 cm–1 conirmed the presence
of intermolecular hydrogen bonding in all blends. The existence of siloxane linkage in the blends resulted by the silane reaction was conirmed by the presence of bands in the range of 1020 (Si-O-Si) and 1060 cm–1 (Si-O-C)8,9,11,27.
The intensity of these peaks remained the same as the crosslinker amount endured constant in all blends.
4.2. Impedance spectroscopy
Impedance spectroscopy measurements of the CS/PVA blends were performed in the frequency range of 25 Hz to 2 MHz. Figure 2a-c illustrates the impedance Bode plots (imaginary part) of all the blends. The conductivity of all the blends was increased with the increase in temperature
(3.10 × 10⁻⁸ to 9.47 × 10⁻⁷Ω–1 cm–1 for CP4 up to 403K,
3.80 × 10⁻⁹ to 7.60 × 10⁻⁷Ω–1 cm–1 for CP8 up to 383 K,
4.50 × 10⁻⁸ to 1.98 × 10⁻⁶Ω–1 cm–1 for CP10 up to 383 K)
which can also be veriied by the shifting of peak (Z” r max)
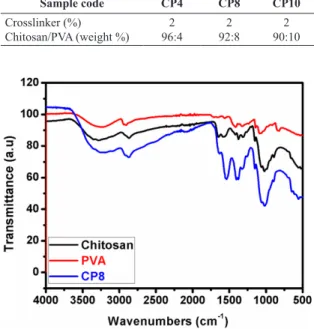
Table 1. Composition and codes of CS/PVA blends.
Sample code CP4 CP8 CP10
Crosslinker (%)
Chitosan/PVA (weight %) 96:42
2 92:8
2 90:10
from low to higher frequency. The conductivity was increased up to a speciic temperature (Figure 2a-c) after which it was decreased which might be due to the accumulation of ions at higher temperature. Peak shifting occurred from 313 to 403 K in CP4 while in CP8 and CP10, it occurred from 313 to 383 K. Peak height was also reduced towards higher frequency showed the increase in conductivity with increase in temperature. The peak was shifting towards higher frequency with the increase in conductivity and hence decreased the resistance in the blends. It can also be seen that the conductivity at higher temperature (403 K) was increased from CP4 to CP10. This trend illustrated that the number of effective charge carrier ions were increased with surging PVA concentration in the blend15.
The relaxation frequency at each peak value Z”
r max is given
by fr = (2πτ)
–1, where τ is the relaxation time33. The peaks
were shifted towards higher frequencies with increase in temperature for this relaxation process. The higher values of fr with the increase in temperature were obvious which
conirmed that the mobility of the charge carriers were raised with enhanced temperature. As a result, the increased mobility of the charge carriers between the polymer chains was responsible for the conduction mechanism.
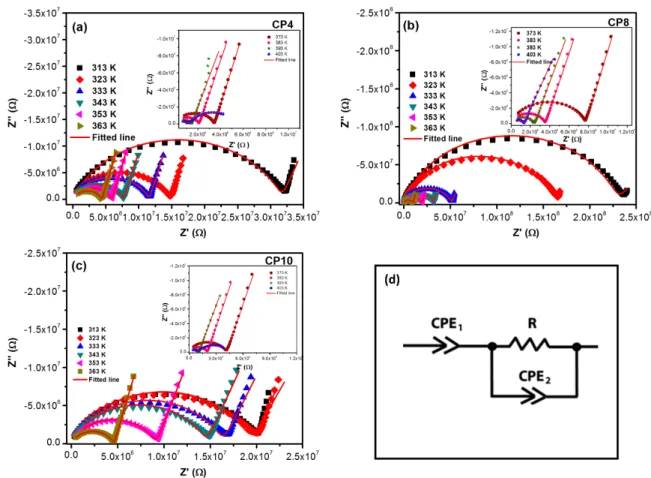
The Nyquist plots of CS/PVA blends are shown in Figure 3 and arrow illustrates the direction of the increase in the frequency. This plot showed one semicircular arc at
higher frequencies for each blend and a lower frequency spike which might be due to the contacts wire between the two electrodes. In a complex plane, a spike represents highest resistivity as the ions could not pass through the region between the two electrodes. So, the ions faced highest resistivity and hence lowest will be the ionic concentration and mobility. In CP4, length of the spike was increased up to 373 K and then decreased. In CP8, spike was increased up to 363 K and then decreased while in CP10, spike was increased up to 343 K and then decreased constantly up to 393 K. At 403 K, two semicircular arcs were observed in CP4 and CP10. First semicircle in CP4 and CP10 touches
Z’ at higher frequency with lowest resistivity while second
semicircle touches at lower frequency and more resistivity. The intersection of the circle at high frequency (left-hand side) passed through the origin while the intersection at low frequency showed total resistance of the blend.
The experimental data was itted using ZView software with itting error <5%. The circuit used for itting is shown in Figure 3d. The circuit consists of one RC loop connected in
series whereas CPE1 represents the constant phase element
which was used to accommodate the non-ideal capacitor behavior. In addition CPE2 was used to model the electrode
effect at all temperatures34. The capacitance (C) was calculated
using the expression:
Figure 2. Variation of Z” with frequency at different temperatures of synthesized blends (a) CP4 (b) CP8 (c) CP10 and (d) Variation of
2015; 18(6) 1259 An Investigation of Ac Impedance and Dielectric Spectroscopic Properties of Conducting Chitosan-silane
Crosslinked-poly (Vinyl Alcohol) Blended Films
(
)
1 n
n 1
C=R− CPE n (1)
Where, n is empirical constant represents, the deviation from ideal Debaye behavior and its value is 0 < n < 1[35].
The relaxation time can be calculated using following formula (Equation 1) and the ionic conductivity of the blends can be calculated from the Equation 2. Therefore, increase in PVA content in the blends enhanced the density of charge carriers and hence increased the ionic conductivity15.
b R C =
τ (2)
Where, Rb is the bulk resistance and C is the capacitance
related with that phase33.
b 1
d R
S
=
δ
(3)
Where, δ is the ionic conductivity, Rb is the bulk resistance, d
is the ilm thickness and S is the area of electrodes contacting the membranes.
The conductivity increased and Rb decreased up to a
403K in CP4, CP8 and CP10. The increase in the conductivity was due to the increased PVA concentration, inter-molecular hydrogen bonding between CS and PVA and also the silane crosslinking in the system. This phenomenon increased the number of charge carriers and hence decreased the bulk resistance.
Figure 2d shows the Arrhenius form of relaxation time of synthesized blends at various temperatures. The activation energies (EA) were calculated for all synthesized blends
using the expression36:
a 0
b E exp− k T
=
τ τ (4)
Where τo is pre-exponential factor and kb is the Boltzmann
constant and T is the temperature. Activation energies for relaxation process was calculated from the graph are 0.45, 0.61 and 0.47 eV for CP4, CP8 and CP10, respectively.
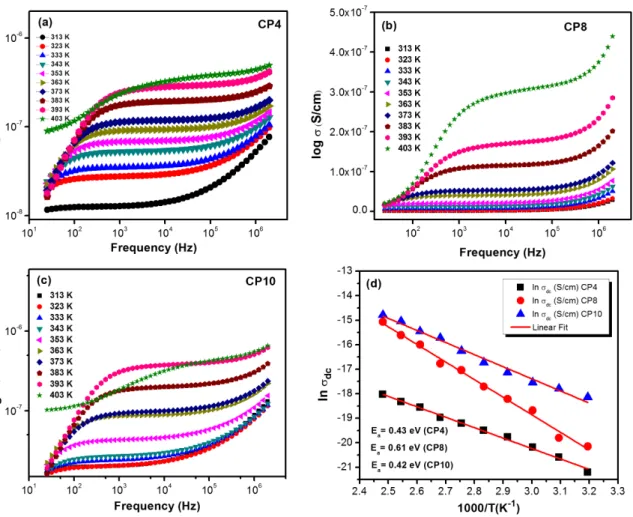
4.3. AC conductivity of the blends
conductivity data with increasing temperature follow the Jonscher’s universal power law37.
s ac= dc+A
σ σ ω (5)
Where “σDC” is frequency independent conductivity
(dc part), “A” is the temperature dependent factor and “s”
is the frequency exponent which lies in the range of0< <s 1.
The values of σDC and s are given in Table 2. The Jonscher’s
power law itted in the frequency range of 2 kHz to 2 MHz which includes dc conductivity (frequency independent) and ac conductivity (frequency dependent). The value of σDC increased with the increase of temperature for all
synthesized samples.
The variation of conductivity with temperature (Figure 4d)
showed that the thermal activation generated the ionic conductivity which was in agreement with the law of activation energy. The conductive ions were thermally stimulated from conined ionic state to allowed ion like condition on above an energy gap E and can disseminate throughout the ilm.
The σDC data is represented by Arrhenius relation:
dc o
E exp
kT
= −
σ
σ σ (6)
Where, σDC is the dc conductivity, Eσ is the activation
energy, σ0 is an exponential factor, T is the corresponding
temperature and k is the Boltzmann constant. Activation energy (Eσ) was believed as the threshold value of the
ionic movement. Its low value assisted the motion of effective number of conductive ions exhibited an increase in conductivity. Hence, Eσ were like the threshold value for
the propagation of ions. Low Eσ comforted the propagation
of conductive ions, so does the increase of conductivity. The activation energy Eσ was extracted from the slope
of the plot ln(σDC) verses 1000/T shown in Figure 4d.
The activation energies were equal to 0.43, 0.61 and 0.42 eV for CP4, CP8 and CP10, respectively. There was a slight difference in the activation energies for the relaxation and conduction. This was because, the relaxation process involved only the hopping energy of the carriers between the localized states, but the conduction mechanism involved hopping energy as well as disorder and binding energy of polarons38. E
A was irst increased with an increase in
PVA amount but decreased again verifying that with the increase in PVA amount, the conductivity irst decreased and then increased. This was according to the change in the conductivity with the variation in PVA amount.
Figure 4. Variation of conductivity with frequency of CS/PVA blends at different temperatures (a) CP4 (b) CP8 (c) CP10 and (d) Arrhenius
2015; 18(6) 1261 An Investigation of Ac Impedance and Dielectric Spectroscopic Properties of Conducting Chitosan-silane
Crosslinked-poly (Vinyl Alcohol) Blended Films
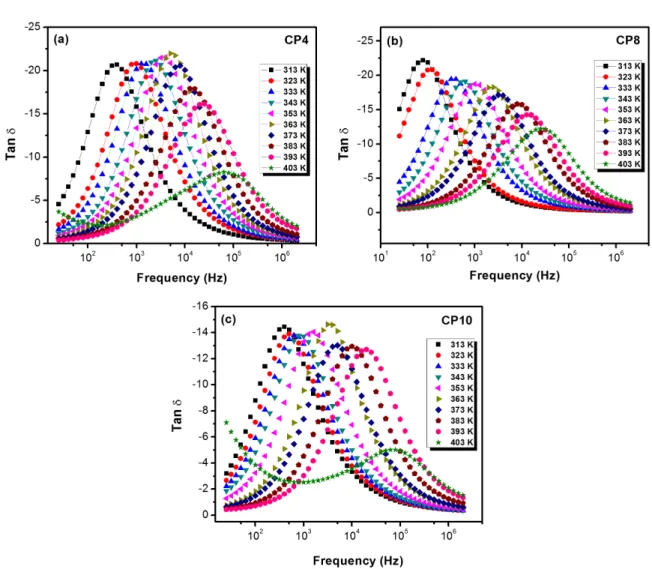
4.4. Dielectric loss
Figure 5 shows the variation of dielectric loss (tan δ) for all synthesized blends. The ratio of real and imaginary part of dielectric permittivity was called dielectric loss factor. In all the synthesized samples at low frequency, tan
δ increased with increase in frequency for all temperatures. A single peak was appeared for all synthesized samples in the loss spectra at particular frequency which suggested the presence of relaxing dipoles in the entire temperature range. The peak shifted towards the higher frequency range which suggested the reduction of relaxation time39.
Table 2. Data of σDC and s at different temperatures for the CP4, CP8 and CP10 blends.
Temperature (K)
CP4 CP8 CP10
σdc s σdc s σdc s
313 1.24 e–8 0.68 1.78e–9 0.73 2.04e–8 0.98
323 2.73 e–8 0.69 2.51e–9 0.72 2.05e–8 0.67
333 3.45 e–8 0.70 7.69e–9 0.69 2.41e–8 0.65
343 5.24 e–8 0.72 1.23e–8 0.68 2.75e–8 0.68
353 6.81 e–8 0.74 2.03e–8 0.70 4.38e–8 0.69
363 9.18 e–8 0.77 3.99e–8 0.73 8.74e–8 0.75
373 1.16 e–8 0.78 5.22e–8 0.74 9.67e–8 0.72
383 1.89 e–8 0.72 1.13e–7 0.77 1.95e–7 0.73
393 2.75 e–8 0.64 1.66e–7 0.70 3.64e–7 0.65
403 2.98 e–8 0.62 2.85e–7 0.55 3.78e–7 0.61
5. Conclusion
The effect of increase in PVA amount and elevated temperature on AC electrical properties of CS-silane crosslinked-PVA blend crosslinked by TEOS was studied. Structural analysis by FTIR showed the existence of Si-O-Si and Si-O-C linkages and the presence of hydrogen bonding in the network structure. Impedance spectroscopy conirmed that the ilms were conductive and with the increase in temperature, the conductivity was increased. Activation energy was calculated for CP4, CP8 and CP10 were 0.431, 0.610 and 0.425 eV, respectively. Hence, the
novel properties of synthesized blended ilms can be used in different biomedical and bioelectrochemical applications concerning to the synthetic and biological systems which use lesser charge in medical electrode devices.
Acknowledgements
The author, Atif Islam is highly obliged to Higher Education Commission of Pakistan for granting him IPFP fellowship to work at Department of Polymer Engineering and Technology, University of the Punjab and also in university of Shefield, UK under IRSIP program.
References
1. Green RA, Baek S, Poole-Warren LA and Martens PJ. Conducting polymer-hydrogels for medical electrode applications. Science and Technology of Advanced Materials. 1995; 11(1):1-13.
2. Guimard NK, Gomez N and Schmidt CE. Conducting polymers in biomedical engineering. Progress in Polymer Science. 2007; 32(8-9):876-921. http://dx.doi.org/10.1016/j.
progpolymsci.2007.05.012.
3. Sun Z and Yuan A. Electrochemical performance of nickel hydroxide/activated carbon supercapacitors using a modified polyvinyl alcohol based alkaline polymer electrolyte. Chinese Journal of Chemical Engineering. 2009; 17(1):150-155. http://
dx.doi.org/10.1016/S1004-9541(09)60047-1.
4. Adhikari B and Majumdar S. Polymers in sensor applications.
Progress in Polymer Science. 2004; 29(7):699-766. http://
dx.doi.org/10.1016/j.progpolymsci.2004.03.002.
5. Chen R-Y, Chen Z, Zheng X, Chen X and Wu S-Y. Preparation and characterization of mSA/mCS bipolar membranes modified by CuTsPc and CuTAPc. Journal of Membrane Science. 2010; 355(1-2):1-6. http://dx.doi.org/10.1016/j.memsci.2010.01.013.
6. Xu C-X, Chen R-Y, Zheng X, Chen X and Chen Z. Preparation of PVA-GA-CS/PVA-Fe-SA bipolar membrane and its application in electro-generation of 2,2-dimethyl-3-hydroxypropionic acid.
Journal of Membrane Science. 2008; 307(2):218-224. http://
dx.doi.org/10.1016/j.memsci.2007.09.034.
7. Du JF, Bai Y, Chu WY and Qiao LJ. The structure and electric characters of proton-conducting chitosan membranes with various ammonium salts as complexant. Journal of Polymer Science. Part B, Polymer Physics. 2010; 48(8):880-885. http://
dx.doi.org/10.1002/polb.21973.
8. Islam A and Yasin T. Controlled delivery of drug from pH sensitive chitosan/poly (vinyl alcohol) blend. Carbohydrate Polymers. 2012; 88(3):1055-1060. http://dx.doi.org/10.1016/j.
carbpol.2012.01.070.
9. Islam A, Yasin T, Bano I and Riaz M. Controlled release of aspirin from pH-sensitive chitosan/poly(vinyl alcohol) hydrogel.
Journal of Applied Polymer Science. 2011; 124(5):4184-4192. http://dx.doi.org/10.1002/app.35392.
10. Yang C-C, Chiu S-J, Chien W-C and Chiu S-S. Quaternized poly(vinyl alcohol)/alumina composite polymer membranes for alkaline direct methanol fuel cells. Journal of Power Sources. 2010; 195(8):2212-2219. http://dx.doi.org/10.1016/j.
jpowsour.2009.10.091.
11. Rasool N, Yasin T and Akhter Z. Synthesis of carboxymethyl-chitosan/acrylic acid hydrogel using silane crosslinker.
e-Polymers. 2008; 142:1-11.
12. Drury JL and Mooney DJ. Hydrogels for tissue engineering: scaffold design variables and applications. Biomaterials.
2003; 24(24):4337-4351. http://dx.doi.org/10.1016/S0142-9612(03)00340-5. PMid:12922147.
13. Peppas NA, Hilt JZ, Khademhosseini A and Langer R. Hydrogels in biology and medicine: from molecular principles to bionanotechnology. Advanced Materials. 2006; 18(11):1345-1360. http://dx.doi.org/10.1002/adma.200501612.
14. Peppas NA. Intelligent therapeutics: biomimetic systems and nanotechnology in drug delivery. Advanced Drug Delivery Reviews. 2004; 56(11):1529-1531. http://dx.doi.org/10.1016/j. addr.2004.07.001. PMid:15350286.
15. Rodrigues IR, Forte MMC, Azambuja DS and Castagno KRL. Synthesis and characterization of hybrid polymeric networks (HPN) based on polyvinyl alcohol/chitosan. Reactive & Functional Polymers. 2007; 67(8):708-715. http://dx.doi.
org/10.1016/j.reactfunctpolym.2007.05.010.
16. Buraidah MH and Arof AK. Characterization of chitosan/ PVA blended electrolyte doped with NH4I. Journal of Non-Crystalline Solids. 2011; 357(16-17):3261-3266. http://dx.doi.
org/10.1016/j.jnoncrysol.2011.05.021.
17. Wu GM, Lin SJ and Yang CC. Preparation and characterization of PVA/PAA membranes for solid polymer electrolytes. Journal of Membrane Science. 2006; 275(1-2):127-133. http://dx.doi.
org/10.1016/j.memsci.2005.09.012.
18. Göktepe F, Çelik SÜ and Bozkurt A. Preparation and the proton conductivity of chitosan/poly(vinyl phosphonic acid) complex polymer electrolytes. Journal of Non-Crystalline Solids. 2008; 354(30):3637-3642. http://dx.doi.org/10.1016/j.
jnoncrysol.2008.03.023.
19. Gao C, Gao Q, Li Y, Rahaman MN, Teramoto A and Abe K. Preparation and in vitro characterization of electrospun PVA scaffolds coated with bioactive glass for bone regeneration.
Journal of Biomedical Materials Research Part A. 2012; 100(5):1324-1334. http://dx.doi.org/10.1002/jbm.a.34072.
PMid:22374712.
20. Liang S, Liu L, Huang Q and Yam KL. Preparation of single or double-network chitosan/poly(vinyl alcohol) gel films through selectively cross-linking method. Carbohydrate Polymers. 2009; 77(4):718-724. http://dx.doi.org/10.1016/j.carbpol.2009.02.007.
21. Kremer F, Schonhals A and Luck W. Broadband dielectric spectroscopy. Berlin: Springer; 2002.
22. Sidorovich AM. Dielectric spectrum of water. Ukrainian Physical Journal. 1984; 29(8):1175-1181.
23. Khiar ASA, Puteh R and Arof AK. Conductivity studies of a chitosan-based polymer electrolyte. Physica B: Condensed Matter. 2006; 373(1):23-27. http://dx.doi.org/10.1016/j.
physb.2005.10.104.
2015; 18(6) 1263 An Investigation of Ac Impedance and Dielectric Spectroscopic Properties of Conducting Chitosan-silane
Crosslinked-poly (Vinyl Alcohol) Blended Films
Matter. 2010; 405(21):4439-4444. http://dx.doi.org/10.1016/j.
physb.2010.08.011.
25. Zhang Y, Cui Z, Liu C, Xing W and Zhang J. Implantation of Nafion® ionomer into polyvinyl alcohol/chitosan composites to form novel proton-conducting membranes for direct methanol fuel cells. Journal of Power Sources. 2009; 194(2):730-736.
http://dx.doi.org/10.1016/j.jpowsour.2009.06.022.
26. Magalad VT, Pattanashetti SS, Gokavi GS, Nadagouda MN and Aminabhavi TM. Proton conducting properties of nanocomposite membranes of chitosan. Chemical Engineering Journal. 2012; 189-190:1-4. http://dx.doi.org/10.1016/j.cej.2012.02.002.
27. Rasool N, Yasin T, Heng JYY and Akhter Z. Synthesis and characterization of novel pH-, ionic strength and temperature- sensitive hydrogel for insulin delivery. Polymer. 2010; 51(8):1687-1693. http://dx.doi.org/10.1016/j.polymer.2010.02.013.
28. Afzal AB, Akhtar MJ, Nadeem M and Hassan MM. Investigation of structural and electrical properties of polyaniline/gold nanocomposites. The Journal of Physical Chemistry C. 2009; 113(40):17560-17565. http://dx.doi.org/10.1021/jp902725d.
29. Sokker HH, Abdel Ghaffar AM, Gad YH and Aly AS. Synthesis and characterization of hydrogels based on grafted chitosan for the controlled drug release. Carbohydrate Polymers. 2009; 75(2):222-229. http://dx.doi.org/10.1016/j.carbpol.2008.06.015.
30. Mansur HS, Costa E Jr, Mansur AAP and Barbosa-Stancioli EF. Cytocompatibility evaluation in cell-culture systems of chemically crosslinked chitosan/PVA hydrogels. Materials Science and Engineering C. 2009; 29(5):1574-1583. http://
dx.doi.org/10.1016/j.msec.2008.12.012.
31. Mishra RK, Majeed ABA and Banthia AK. Fabrication and characterization of chitosan/poly (vinyl alcohol)-CO-(vinyl acetate)-CO-(itaconic acid) hydrogel membranes. International
Journal of Plastics Technology. 2011; 15(1):21-32. http://dx.doi.
org/10.1007/s12588-011-9012-2.
32. Costa-Júnior ES, Barbosa-Stancioli EF, Mansur AAP, Vasconcelos WL and Mansur HS. Preparation and characterization of chitosan/poly(vinyl alcohol) chemically crosslinked blends for biomedical applications. Carbohydrate Polymers. 2009; 76(3):472-481. http://dx.doi.org/10.1016/j.carbpol.2008.11.015.
33. Idrees M, Nadeem M and Hassan MM. Investigation of conduction and relaxation phenomena in LaFe0.9Ni0.1O3 by impedance
spectroscopy. Journal of Physics. D, Applied Physics. 2010; 43(15):1-9. http://dx.doi.org/10.1088/0022-3727/43/15/155401.
34. Imran Z, Rafiq MA and Hasan MM. Charge carrier transport mechanisms in perovskite CdTiO3 fibers. AIP Advances. 2014; 4(6):067137. http://dx.doi.org/10.1063/1.4885462.
35. Yang M, Wang J, Li H, Zheng JG and Wu NN. A lactate electrochemical biosensor with a titanate nanotube as direct electron transfer promoter. Nanotechnology. 2008; 19(7):075502. http:// dx.doi.org/10.1088/0957-4484/19/7/075502. PMid:21817635.
36. Imran Z, Rafiq MA, Ahmad M, Rasool K, Batool S and Hasan M. Temperature dependent transport and dielectric properties of cadmium titanate nanofiber mats. AIP Advances. 2013; 3(3):032146. http://dx.doi.org/10.1063/1.4799756.
37. Jonscher AK. Theuniversal’dielectric response. Nature. 1977; 267(5613):673-679. http://dx.doi.org/10.1038/267673a0.
38. Wul B. Dielectric constants of some titanates. Nature. 1945; 156(3964):480-480. http://dx.doi.org/10.1038/156480a0.
39. Rathan SV and Govindaraj G. Thermal and electrical relaxation studies in Li (4+ x) TixNb1− x P3 O12 (0.0≤ x≤ 1.0) phosphate
glasses. Solid State Sciences. 2010; 12(5):730-735. http://