Grain-Boundary Resistance and Nonlinear Coeicient Correlation for SnO
2-Based Varistors
Mateus Gallucci Masteghina, Marcelo Ornaghi Orlandia*
Received: March 09, 2016; Revised: June 27, 2016; Accepted: August 23, 2016
This work has focused on the electrical and microstructural properties of Nb2O5-doped SnO2 -MnO2 ceramics. The pellets were prepared by solid-state reaction method according to the system (99.5-x) SnO2 - 0.5 MnO2 - x Nb2O5, on the following molar ratio x = 0.05; 0.10; 0.15; 0.20 and 0.25. Scanning electron microscopy and electrical measurements (ac and dc) were used to study the materials properties. The results showed that the increase of Nb2O5 content in the SnO2-MnO2 matrix has led to an increase in the varistor properties. A detailed study of the electrical properties of materials was conducted using impedance spectroscopy and the results indicated that Nb2O5 has a tendency to form an electron trapping level near the conduction band. In order to explain these indings, a parallel equivalent circuit model was used to simulate the values of the grain boundary resistance. A close relationship was found between the value of the nonlinear coeicient and the grain boundary resistance for the studied varistors, where both values increased with increasing the amount of Nb2O5, which is important for practical applications.
Keywords: Varistor, Tin oxide, Electrical properties, Impedance spectroscopy
* e-mail: [email protected]
1. Introduction
Semiconductor Metal Oxides (SMO)1 are interesting
materials due to their nonlinear electrical response, making their use possible in many technological applications, such as light and gas sensors, electro-optical devices, photovoltaic cells, and electrical transient suppressors (varistors), responsible for acting as an energy drain.
This characteristic is due to the polycrystalline nature of ceramic varistors and the efective potential barriers at the grain boundaries that enables a nonlinear relationship between the voltage and the current. This non-ohmic behavior of the ceramics has been deined by the empirical equation:
circuit element. Finally, another factor that should be taken into account is the leakage current (Il), which is the current lowing through the circuit when the voltage is 80% of the breakdown voltage. There has been a correlation between the leakage current and the eiciency of the electrostatic potential barrier2, which may allow the current lux by tunneling and/or
thermionic emission before reaching the breakdown voltage, which results in functional losses in the circuit.
A wide variety of materials have been employed to obtain the varistor behavior, like ZnO3,4,5,6,7, SnO
2
8,9, TiO
2
10, and more
recently CaCu3Ti4O1211, and it has been shown that the
non-ohmic characteristic is related to the back-to-back Schottky type barrier located at the grain boundary region12,2. This
barrier is formed during the sintering process due to oxygen enrichment at grain boundaries compensated by interstitial cations and/or oxygen vacancies in the adjacent region13.
The tin oxide is an n-type semiconductor as a consequence of the oxygen non-stoichiometry, enabled by the coordination 6:3 in the rutile-type crystalline structure14,15. It has been shown
that tin dioxide is a strong candidate to replace the commercial zinc oxide varistors8, presenting some advantages, such as the need for a small amount of dopants to obtain similar non-ohmic properties (high nonlinear coeicient and low leakage current), single phase pattern at the detection limit of X-ray difraction technique, higher thermal conductivity that enables better mechanical stability during a voltage overload, and much greater chemical inertness; i.e., SnO2 is not attacked by acids or weak bases and thus can be used in harsh environments without any previous preparation.
aChemistry Institute, São Paulo State University, Araraquara, SP, Brazil
( )
I
=
K V
$
a1
in which I is the current, V is the applied voltage, K is a constant related to the microstructure of the material and α is the nonlinear coeicient.
In varistor materials, one of the most important parameter is the nonlinear coeicient (α). The value of α deines how fast the change is from the high resistive to the low resistive state, allowing the excess current to low through the ground. Another important parameter is the breakdown electric ield (Eb) which determines the practical application of varistor, i.e., low, medium or high voltage networks. Since these electronic ceramics are used directly connected to a voltage source in parallel with the circuit element being protected, Eb
However, pure SnO2 usually presents low density even when sintered at high temperatures16. To overcome this
obstacle for the application as a varistor system, Park et al.17
proposed a sintering at 1400 degrees for 12 hours under an isostatic pressure of 150 MPa, yielding 97% of densiication. Another alternative was proposed by Cerri et al.18, who studied the addition of CoO and MnO2 to the tin oxide matrix, reaching 97% or more of the theoretical density using low amount of dopants and lower sintering temperatures (1300 ºC). Less common is the use of CaO, wherein the Ca with high ionic radius (100 pm compared to 75.0 pm and 83.0 pm of the Co+2 and Mn+2, respectively) has low solubility in the
tin oxide matrix, segregating at the SnO2 grain boundaries, which might decrease the grain boundary mobility, leading to a decrease in the average grain size19. The densiication
of tin dioxide is promoted by the oxygen vacancy formation during sintering, which controls the grain boundary mobility and decreases the vapor pressure of tin oxide. Thus, the densiication is controlled by the densifying mechanisms that prevail over the non-densifying ones, as evaporation/ condensation or neck formation between the grains.
In recent studies, the SnO2-MnO2-Nb2O5 varistor system has been found to present good electrical properties20.
Therefore, we chose to carry out an in-depth study using impedance spectroscopy, once the typical varistor parameters can be obtained by dc measurements and this type of analysis only provides the global resistance of the studied sample. Hence, impedance measurements are important because the difusivity of the charge carriers across grain boundaries, trap levels, grains and electrodes has diferent relaxation times when an alternating electrical excitation is applied to the material and, therefore, each resistance can be separated in the frequency domain. The response times are longer for interactions at the electrode-ceramic interface than to the phenomena that occur in the grain boundary region, which in turn are longer than the phenomena that occur inside the grains. In addition, because this technique is sensitive to microstructural variations, it allows a correlation between the electrical and microstructural properties in the studied materials.
In light of the above, the aim of this work is to present a detailed study of dc and ac current responses in Nb2O5 doped SnO2-MnO2 varistor system using I-V and impedance spectroscopy measurements as a tool to separate the diferent resistance contributions present in varistors. Moreover, an attempt to ind evidences for a correlation between the material resistance and the varistor characteristics was performed.
2. Experimental Procedure
The samples were prepared using the solid state reaction method, in which the powders, in the correct stoichiometry, were homogenized using the ball milling process (with yttrium stabilized zirconium balls) in alcohol medium for
24 h. The oxides used were SnO2 (Aldrich), MnO2 (Aldrich) and Nb2O5 (Aldrich), all of them with a purity of 99.9% or more. The composition studied was (99.5-x)SnO2 - (0.5) MnO2 - (x)Nb2O5, with x = 0.05, 0.10, 0.15, 0.20 and 0.25, in molar percentages, hereinafter called SnMnNbx, with their respective x values. The samples were irst compacted in cylindrical discs, 1.0 mm thick and 7.0 mm in diameter, by uniaxial pressing (10 MPa), followed by isostatic pressing at 150 MPa. Next, the samples were sintered at 1305 ºC for 2 hours, with a heating and cooling rate of 10 ºC.min-1, in
air atmosphere.
The sintered samples were structurally characterized by X-ray difraction (XRD, Rigaku, model RINT 2000) using CuKα radiation. The morphological study of samples was conducted by scanning electron microscopy (SEM-FEG -JEOL, model 7500F) and dual beam microscopy (FIB -FEI, model Helios NanoLab 600i), equipped with X-ray energy dispersive spectroscopy (EDS) detector. The average grain size was calculated based on the linear intercept21 method
taken into account at least 200 grains of each composition. In order to take electrical measurements, silver contacts were placed on the parallel polished surfaces of samples, and were heated at 80 °C for 2 hour in air atmosphere to eliminate the organic solvents. The direct current (dc) measurements were performed in a stabilized high voltage source-meter unit (Keithley, model 237), using the voltage range from 0 to 1100 V, with step of 20 V, and a current compliance of 10 mA. Impedance spectroscopy analyses were carried out using a frequency response analyzer (FRA32M - Autolab, model PGSTAT), in the frequency range from 10 mHz to 1 MHz, and amplitude of 500 mV. The results were analyzed by the NOVA 1.10 software and the Equivalent Circuit (EQUIVCRT) program22,23. Based on the electrical
response of materials and the physical interpretation of systems, equivalent circuits were proposed for each varistor composition and the simulated values were compared to the experimental ones in a it at the complex plane.
3. Results and Discussion
After the sintering process, the samples were structurally characterized by X-ray difraction (not shown here), and only the cassiterite phase of SnO2 was observed for all compositions. This result was predictable since the dopants used in this work are in the amount below the detection limit of XRD equipment.
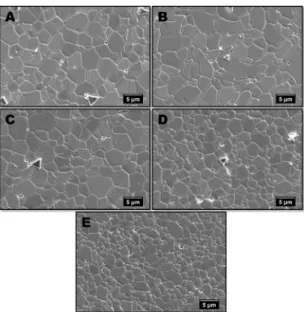
Figure 1. FEG-SEM images of varistor system (99.5-X) SnO2 - (0.5) MnO2 - (X) Nb2O5, with the following X content: A) 0.05%; B) 0.10%; C) 0.15%; D) 0.20% and E) 0.25%.
Table 1. The calculated average grain size for each varistor system studied.
System Grain Size (µm) Relative Density
SnMnNb0.05 5.7 98%
SnMnNb0.10 5.6 98%
SnMnNb0.15 4.7 99%
SnMnNb0.20 3.9 99%
SnMnNb0.25 3.0 95%
images show that samples have some triangle precipitates at triple points of the grain boundaries, and the amount of precipitates also decreases with increasing the Nb2O5 content in the sample.
A detailed study of the precipitates present in the sample SnMnNb0.05 was performed in a dual beam microscope equipped with EDS detector. Figure 2 presents the secondary (SE) and backscattered electrons (BSE) image of the sample where it is possible to observe that the material consists of two distinct phases; the bright grains being composed by a phase with average atomic number higher than the dark triangular precipitates. In order to study in more detail the precipitates that are present at triple points, a milling of 8 microns depth was made in the extension of the grain boundary, tangential to the precipitate, using the Ga+3 ions source of a dual-beam
microscope. Figure 3 presents the SE image of the cross-section showing that the precipitate accompanies the grain boundary in depth. The chemical mapping obtained by EDS proves that precipitates are rich in manganese and oxygen, while grains are mainly composed by tin and oxygen.
At this point, it is worth discussing the importance of microstructure on electrical properties of varistor systems,
Figure 2. SE and BSE SEM images of triangular precipitates at grain boundary of SnMnNb0.05 sample.
Figure 3. SE image and EDS mapping of a precipitate at the grain
boundary. The cut in depth shows the three-dimensional extension of precipitate in the sample.
especially the existence of the precipitates. It is known that for SnO2 based varistors a homogeneous layer of transition metal segregated at the grain boundary region is fundamental to obtain high nonlinear values (α)13; in a similar way to the
ZnO based varistors the presence of bismuth oxide phase segregated along the grain boundary is fundamental for its electrical response24,25. The SEM and the EDS results for
Nb2O5-doped SnO2-MnO2 varistor system present two phases, or two kinds of SnO2-SnO2 grain boundaries, one thin and Mn rich (called type I), and other thick and Mn poor (called type II), and the type I grain boundary is considered desirable to obtain good varistor properties26.
The above discussion is corroborated by the results in Figure 4, where the dc electrical response of the varistors can be observed by the plot of the electric ield as a function of the density of current. All samples present a non-ohmic behavior, but the transition between the resistive states to the conductive one is more abrupt with increasing the Nb2O5 content (which is a qualitative measure of α coeicient). Besides, Figure 4 also shows that the breakdown electric ield is higher as the amount of niobium increases.
Since this work is mainly focused on the electrical properties of the varistor systems, impedance spectroscopy measurements were performed allowing to distinguish the contribution of the grain boundary using equivalent circuits to describe physically and mathematically the varistor system27. The results obtained from the IS technique can
be observed in Figure 5.
Figure 4.DC measurements for all compositions showing that both
the breakdown electric ield and the nonlinear coeicient increases
with the amount of niobium.
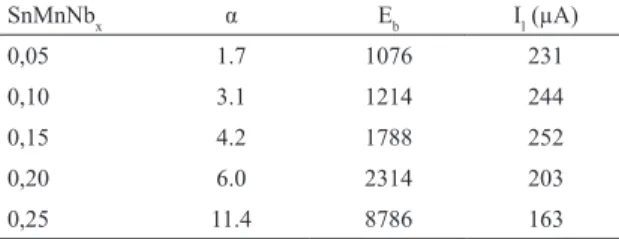
The values of the nonlinear coeicient (α) and the breakdown electric ield are shown in the Table 2 that also presents the leakage current. One can observe that with increasing the concentration of Nb2O5, an increase in the nonlinear coeicient is observed, given the electrons donor characteristic of the Nb2O5 substituting SnO2, increasing the conductivity of the grain. This donor efect can be seen by the reaction represented by the Kroger-Vink notation:
Table 2. Varistor characteristics obtained from the dc measurements.
SnMnNbx α Eb Il (µA)
0,05 1.7 1076 231
0,10 3.1 1214 244
0,15 4.2 1788 252
0,20 6.0 2314 203
0,25 11.4 8786 163
( )
Nb O Nb O e
2 4 Sn 10 Ox 4 2
Sn
2 5 02
+ +
%
-It is also possible to note an increase in the value of the breakdown electric ield that is associated with both the decrease of the average grain size, that produces more grain boundaries in the pellet, and the decrease of precipitates at triple points, which increases the number of efective potential barriers at the grain boundary.
Figure 5. A) Nyquist diagram and B) Imaginary part of resistance
vs. frequency of all studied SnMnNbx samples.
It is noticed from Figure 5 that all systems have two semicircles, in which the low frequency semicircle is related to the grain boundary contribution and the high frequency semicircle is related to the electrons trap level20,28. The exception is the system SnMnNb0,05 which presents only the grain boundary contribution due to the low amount of doping, as clearly observed from Figure 5b29. In addition, Figure 5a also shows that the amount of
niobium inluences the semicircle at high frequency. It is noticeable that increasing the Nb2O5 amount produces a decrease in the high frequency semicircle, becoming almost imperceptible for the SnMnNb0,25 system. This change in the high frequency impedance data is a consequence of the increase of the charge carriers in the SnO2 matrix due to the Nb2O5 addition.
The proposed equivalent circuit for all varistor systems studied (SnMnNbx) contains a resistor in parallel with a capacitor, both relating to the grain boundary contribution, appointed as Rgb and Cgb. For the systems doped with more than 0.05% of niobium it was necessary to add in the proposed circuit, in parallel, a capacitor and a constant phase element (in series), appointed as Ct and CPEt, representing the internal electron trap level. Then, through theoretical simulations using the EQUIVCRT program21,22
it was possible to obtain only the grain boundary resistance of varistor, since the impedance spectroscopy technique allows the separation of the resistive contribution from the grain boundary and from the trap level. The grain boundary resistance obtained from the simulations for all studied systems is shown in Table 3.
resistance of material. In addition, there is evidence of a close correlation between the grain boundary resistance and the nonlinear coeicient value.
4. Conclusion
In this work the morphological and the electrical properties of Nb2O5-doped SnO2-MnO2 varistor systems were studied. Varistors are composed of tin oxide grains and exhibit some Mn-rich precipitates at triple points. It was corroborated that precipitates jeopardize the varistor response due to the formation of non-efective potential barriers. Nevertheless, using impedance spectroscopy, it was possible to observe and describe the grain boundary contribution from each system and likewise a correlation between the varistor grain boundary resistance and the nonlinear coeicient was observed. Consequently, in order to obtain higher values of nonlinear coeicient, it is required to ensure a high level of efective potential barriers at the grain boundaries, increasing its resistance and avoiding the leakage current.
5. Acknowledgements
We would like to thank the funding agencies FAPESP (proc. # 2013/07296-2) and CNPq (proc # 402297/2013-0, #447760/2014-9, #800733/2014-2, #303542/2015-2). SEM and FIB facilities were provided by the LMA-IQ-UNESP. We are thankful to Justin Moon for his help revising the manuscript.
6. References
1. Levinson LM, Philipp HR. The physics of metal oxide varistors.
Journal of Applied Physics.1975;46(3):1332-1341.
2. Leite ER, Varela JA, Longo E. A new interpretation for the degradation phenomenon of ZnO varistors. Journal of Materials Science. 1992;27(19):5325-5329.
3. Matsuoka M. Nonhomic properties of zinc oxide ceramics.
JapaneseJournal of Applied Physics. 1971;10(6):736-746.
4. Mukae K, Tsuda K, Nagasawa I. Non-ohmic properties of ZnO-Rare Earth metal oxide Co3O4. Japanese Journal of Applied Physics.
1977;16(8):1361-1368.
5. Mukae K. Zinc-Oxide varistors with praseodymium oxide.
American Ceramic Society Bulletin. 1987;66(9):1329-1331.
6. Mukae K, Tsuda K, Nagasawa I. Capacitance vs voltage characteristics of ZnO varistors. Journal of Applied Physics. 1979;50(6):4475-4476.
7. Alim MA, Seitz MA, Hirthe RW. Complex-plane analysis of trapping phenomena in zinc-oxide based varistor grain-boundaries.
Journal of Applied Physics. 1988;63(7):2337-2345.
8. Pianaro SA, Bueno PR, Olivi P, Longo E, Varela JA. Electrical
properties of the SnO2 - based varistor. Journal of Materials Science: Materials in Electronics. 1998;9(2):159-165.
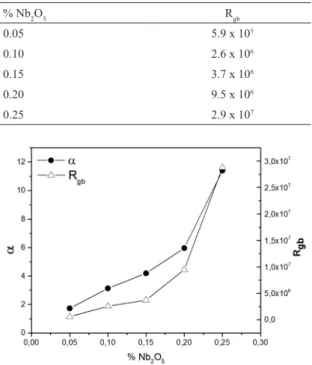
Table 3. Grain boundary resistance through simulations by Equivcrt program for each studied composition.
% Nb2O5 Rgb
0.05 5.9 x 10⁵
0.10 2.6 x 10⁶
0.15 3.7 x 10⁶
0.20 9.5 x 10⁶
0.25 2.9 x 10⁷
( ) dI t
dU t
I U
1 3
$ a
=
QQVV
for higher values of alpha. This close relation between the alpha and the grain boundary resistance is expected for a varistor when the grain boundary is the key factor for the nonlinear relationship presented by these devices.
This tendency can be explained by taking the derivative of the typical varistor equation: I
C U
=S Xa, with respect to I, obtaining:
Figure 6. Nonlinear coeicient (left axis) and grain boundary
resistance (right axis) as function of Nb2O5 content.
Knowing that dI dU
is the ac resistance, given as ix,
increasing the grain boundary resistance (related to ), the nonlinearity coeicient should also increase (1/alpha decreases).
Therefore, to obtain high values of nonlinear coeicient, the material must present a high grain boundary resistance. This makes sense considering the results presented above showing that low amounts of Nb2O5 increase the amount of precipitates at triple points generating more non-efective type II potential barriers at grain boundaries and, thus, low alpha values.
It was shown that by combining the results obtained from diferent characterization techniques we were able to study the SnMnNbx varistor system in more detail separating the grain boundary and trap level contribution from the global
9. Pianaro SA, Bueno PR, Longo E, Varela JA. A new SnO2 -
based varistor system. Journal of Materials Science Letters. 1995;14(10):692-694.
10. Yang SL, Wu JM. Efects of Nb2O5 in (Ba, Ni, Nb)-added
TiO2 ceramic varistors. Journal of Materials Research. 1995;10(2):345-352.
11. Chung SY, Kim ID, Kang SJL. Strong nonlinear current-voltage
behaviour in perovskite-derivative calcium copper titanate.
Nature Materials. 2004;3:774-778.
12. Gupta TK, Carlson WG. A grain boundary defect model for
instability/stability of a ZnO varistor. Journal of Materials Science. 1985;20(10):3487-3500.
13. Bueno PR, Leite ER, Oliveira MM, Orlandi MO, Longo E. Role of oxygen at the grain boundary of metal oxide varistors: A potential barrier formation mechanism. Applied Physics Letter. 2001;79:48-50.
14. Jarzebski ZM, Marton JP. Physical Properties of SnO2 Materials. I. Preparation and Defect Structure. Journal of the Electrochemical Society. 1976;123(7):199C-205C.
15. Jarzebski ZM, Marton JP. Physical Properties of SnO2 Materials.
II. Electrical Properties. Journal of the Electrochemical Society. 1976;123(9):299C-310C.
16. Duvigneaud PH, Reighard D. Activated sintering of tin oxide.
Science of Sintering. 1980;12:287-292.
17. Park SJ, Hirota K, Yamamura H. Densiication of nonadittive
SnO2 by hot isostatic pressing. Ceramics International.
1984;10(3):116.
18. Cerri JA, Leite ER, Gouvêa D, Longo E, Varela JA. Efect
of cobalt(II) oxide and manganese(IV) oxide on sintering of tin(IV) oxide. Journal of the American Ceramic Society.
1996;79(3):799-804.
19. Aguilar-Martínez JA, Durán-Régules A, Glot AB, Hernández MB, Pech-Canulf MI, Castillo-Torres J. Efect of CaO on the
microstructure and non-ohmic properties of (Co,Sb)-doped SnO2 varistors. Revista Mexicana de Física. 2008;54(1):20-24.
20. Orlandi MO, Bomio MRD, Longo E, Bueno PR. Nonohmic
behavior of SnO2-MnO polycrystalline ceramics. II. Analysis of admittance and dielectric spectroscopy. Journal of Applied Physics. 2004;96(7):3811-3817.
21. Shunhua C, Clam D. Characteristic grain size: Part I description and deinition. Journal of Central South University of Technology. 1997;4(1):20-23.
22. Boukamp BA. A nonlinear least squares it procedure analysis
of immitance data of electrochemical systems. Solid State Ionics. 1986;20(1):31-44.
23. Boukamp BA. A package for impedance/admittance data
analysis. Solid State Ionics. 1986;18-19(Pt 1):136-140.
24. Santhanam AT, Gupta TK, Carlson WG. Microestrutural evaluation of multicomponent ZnO ceramics. Journal of Applied Physics. 1979;50(2):852-859.
25. Morris WG, Cahn JW. Adsorption and microphases at grain boundaries in non-ohmic zinc oxide. In: Walter JL, ed. Grain Boundaries in Engineering Materials. Claitors: Baton Rouge; 1975.
26. Bueno PR, Orlandi MO, Simões LGP, Leite ER, Longo E, Cerri JA. Nonohmic behavior of SnO2-MnO polycrystalline ceramics. I. Correlations between microstructural morphology and nonohmic features. Journal of Applied Physics. 2004;96(5):2693-2700.
27. Barsoukov E, Macdonald JR, eds. Impedance Spectroscopy: Theory, Experiment, and Applications. New Jersey: John Wiley & Sons; 2005. 616 p.
28. Orlandi MO, Bueno PR, Longo E. Inluence of thermal
annealing treatment in oxygen atmosphere on grain boundary chemistry and non-ohmic properties of SnO2.MnO polycrystalline semiconductors. Physica Status Solidi (A).
2008;205(2):383-388.