ABSTRACT
RESUMO
Métodos para classificar cultivares de milho em eficiência no uso e na resposta ao nitrogênio
Nos programas de melhoramento de plantas que têm como objetivo obtenção de cultivares mais eficientes e responsivos à quantidade de nitrogênio (N), há interesse em métodos seletivos que sejam de baixo custo, rápida resposta, alta repetibilidade e aplicáveis em grande número de cultivares. Assim, os objetivos deste trabalho foram avaliar técnicas experimentais de campo aplicáveis à rotina de programas de melhoramento para classificar cultivares de milho eficientes e responsivos ao N. Foi realizado um experimento em delineamento de blocos casualizados, e os tratamentos foram arranjados em parcela subdividida com três repetições e cinco doses de N (0, 30, 60, 120 e 200 kg ha-1) em parcelas e seis cultivares de milho em subparcelas. Foram comparados os métodos de eficiência e resposta (ER) com duas doses contrastantes de N, a análise de variância com teste de média e a análise de regressão. Concluiu-se que o método da eficiência no uso e na resposta com base nas duas doses mais contrastantes de N classifica os cultivares
Received: 10/01/2011; Accepted: 30/07/2013.
1 Part of the Master’s dissertation of the first author, submitted to the Graduate Program in Plant Science of Federal University of Viçosa.
2Agronomist Engineers, Masters of Science. Departament of Plant Science, Federal University of Viçosa, Campus Viçosa, Avenida Peter Henry Rolfs, s/n, 36570-000, Viçosa,
Minas Gerais State, Brazil. [email protected]; [email protected] (corresponding author).
3Agronomist Engineers, Doctors of Science. Departament of Plant Science, Federal University of Viçosa, Campus Viçosa, Avenida Peter Henry Rolfs, s/n, 36570-000, Viçosa,
Minas Gerais State, Brazil. [email protected]; [email protected]
4Agronomist Engineer, Doctor of Science. Dow Agrosciences Industria Ltda., Rodovia Anhanguera, s/n, Km 344, Zona Rural, 14680-000, Ribeirão Preto, São Paulo, Brazil.
5Agronomist Engineer, Doctor of Science. Empresa de Pesquisa Agropecuária de Minas Gerais, Avenida José Cândido da Silveira, 1647, Cidade Nova, 31170-000, Belo Horizonte,
Minas Gerais State, Brazil. [email protected]
Cleiton Lacerda Godoy2, Glauco Vieira Miranda3, Rodrigo Oliveira DeLima2, Leandro Vagno de Souza4,
João Carlos Cardoso Galvão3, Izabel Cristina dos Santos5
Methods to classify maize cultivars in use efficiency
and response to nitrogen
1n plant breeding programs that aim to obtain cultivars with nitrogen (N) use efficiency, the focus is on methods of selection and experimental procedures that present low cost, fast response, high repeatability, and can be applied to a large number of cultivars. Thus, the objectives of this study were to classify maize cultivars regarding their use efficiency and response to N in a breeding program, and to validate the methodology with contrasting doses of the nutrient. The experimental design was a randomized block with the treatments arranged in a split-plot scheme with three replicates and five N doses (0, 30, 60, 120 and 200 kg ha-1) in the plots, and six cultivars in subplots. We compared a method examining the efficiency and response (ER) with two contrasting doses of N. After that, the analysis of variance, mean comparison and regression analysis were performed. In conclusion, the method of the use efficiency and response based on two N levels classifies the cultivars in the same way as the regression analysis, and it is appropriate in plant breeding routine.Thus, it is necessary to identify the levels of N required to discriminate maize cultivars in conditions of low and high N availability in plant breeding programs that aim to obtain efficient and responsive cultivars. Moreover, the analysis of the interaction genotype x environment at experiments with contrasting doses is always required, even when the interaction is not significant.
INTRODUCTION
Maize productivity is a function of cultivar, environment and cultivar x environment interaction (Miranda et al., 2009; Fritsche-Neto et al., 2010a). The behavior of each cultivar varies between regions, which can be capitalized upon to maximize productivity (Deitos
et al., 2006; Faluba et al., 2010). Local food security can be increased via the identification of higher-yield cultivars in specific environments such as soils with low nitrogen availability (Miranda et al., 2005; Souza et al., 2010), low phosphorus (Parentoni & Souza Júnior, 2008; Fritsche-Neto et al., 2010b) and low input (Souza et al., 2008a; Souza et al., 2009).
One of the main causes of low maize productivity in Brazil is the use of small quantities of fertilizers, especially nitrogen. Different strategies can be used to mitigate this problem, but usually involve changing the environment by adding nutrients that are low in status or by selecting plants with better nutrient use efficiency (Gallais & Hirel, 2004; Souza et al., 2008b; Rotili et al., 2010). The selection of cultivars with better nutrient use efficiency has been used with different definitions and it is essential when attempting to optimize the cultivar x environment interaction. The response of a cultivar is associated with the availability of nutrients for plant growth, while efficiency is associated with the limiting environment. Fageria & Kluthcouski (1980) observed that the most efficient cultivars produce more grains in relation to other cultivars in conditions of low nutrient availability and the most responsive cultivars are those that increase productivity as the relative availability of nutrient increases.
In soil science, the response of cultivars is traditionally determined by the dose-response experiment, in which the response is determined by the coefficient of regression of grain yield against the dose of nutrients. However, the use of such regressions is not feasible for the evaluation of hundreds of lines that are synthesized each year for a breeding program, because it is time-consuming and costly. Another experimental technique that is widely used to investigate the cultivar x nutrient interaction applies
analysis of variance with the mean test to evaluate the performance of cultivars at two or three doses of nutrients. Nevertheless, this type of analysis often cannot detect differences in the cultivar x environment interaction, despite the presence of significant main effects of cultivars and environments (Fidelis et al., 2007; Parentoni & Souza Júnior, 2008). In abiotic stress plant breeding, there is a focus on experimental and statistical methods that are associated with field investigations that fit in with the breeding routine, with low costs and a fast response and high repeatability of results. The methodology proposed by Fageria & Kluthcouski (1980) suggests that the use of two doses of nutrients is suitable for classifying cultivars in breeding programs as in dose-response experiments.
The objectives of this study were to classify maize cultivars regarding the efficiency and response to nitrogen in a breeding program and to validate the methodology used to identify nutrient-use-efficient cultivars.
MATERIAL AND METHODS
The experiments were conducted at the experimental station of the Department of Plant Science at Universida-de FeUniversida-deral Universida-de Viçosa (UFV) in the municipality of Coimbra, Minas Gerais State (lat 20o 45’ S, long 42o 51’ W, and alt 720 m asl). The experimental design was a randomized block with the treatments arranged in a split-plot scheme with three replications and five nitrogen (N) doses (0, 30, 60, 120 and 200 kg ha-1) in the plots, and six cultivars in subplots. Each plot consisted of 12 rows of 4 m in length, spaced 0.9 m apart and with 0.2 m between plants. The subplots consisted of two rows of 4 m.
The main chemical characteristics of the soil were: water pH = 5.5; P = 5.7 mg dm-3; K =71 mg dm-3; Ca2+ = 2.5 cmolc dm-3; Mg2+ = 1.02 cmol
c dm
-3; Al3+ = 0.00 cmol c dm
-3; H+Al = 3.96 cmolc dm-3; SB = 3.70 cmol
c dm
-3; t = 3.70 cmol c dm-3; CTC = 7.66 cmolc; V = 48.3%.
In fertilized plots the N application was split into 30 kg ha-1 at sowing and the remainder was applied when the plant reached the six-leaf stage. All plots received 80 kg ha-1 of P
2O5 and 80 kg ha -1 K
2O applied in the furrows on the day of sowing. The nutrient sources were the fertilizers similares à análise de regressão e ele é apropriado para uso em programas de melhoramento; há necessidade de identificar os níveis de N requerido para discriminar cultivares de milho em condições de baixo e alto N em programas de melhoramento que objetivam obter cultivares eficientes e responsivos ao N; e que a análise de interação genótipos x ambientes em experimentos com doses contrastantes é sempre necessária, mesmo quando a interação não é signifi-cativa.
simple superphosphate and potassium chloride. Pests, weeds and diseases were controlled. Irrigation was carried out as required to maize crop, based on information from a portable weather station.
The cultivars evaluated were P30F80 (single hybrid responsive for inputs), BR 201 (double hybrid adapted to acid soils), BR 106 (open-pollinated cultivar recommended for different regions of Brazil) and DKB 901 (single hybrid early cycle) which are nitrogen-responsive compared to BRS Sol da Manhã (open-pollinated cultivar selected for environments with low nitrogen) and CMS 39 (population with few cycles of selection) (Alves et al., 2002). The traits evaluated were female flowering (FF), plant height (PH), ear height (EH), grain yield (GY) and nitrogen content. The concentration of total nitrogen in maize leaves was determined according to Malavolta et al. (1997).
Standard statistical analyses were carried out, i.e., analysis of variance for all cultivars, regression analysis of nitrogen doses for each cultivar and correlation with cultivar performance, by using the program Statistical Analysis System (SAS) version 9.1 (SAS Institute Inc., 2003). The Fageria & Kluthcouski (1980) method was evaluated in ten possible combinations of five nitrogen doses in order to identify two nitrogen doses that would classify the cultivars in the same way as the regression analysis. Among the possible genotype classifications for determining the lowest dose (critical level), to identify the efficiency cultivar was grain yield. To establish the highest dose required to determine the superior critical level to responsive cultivar, we considered grain yield, the percentage of cultivar yield potential that reached at least 80%, the results of the regression analysis and the nitrogen content in the maize plant.
After determination of the lower and upper levels, an index (α) was calculated to define the cultivar response. The index α was calculated as follows:
The grain yield of each cultivar at the lower critical level and its corresponding α are represented in the Cartesian coordinate system. The axes intersect at the point defined by the mean productivity at the lower critical level and the average á of all cultivars. These four quadrants represent the efficiency and response of the cultivars. Cultivars belonging to the first quadrant (upper Y axis and right X axis) were classified as efficient and responsive, those in the second quadrant (upper Y and left X) were non-responsive and efficient, those in the third quadrant (lower Y and left X) were non-efficient and non-responsive and those in the fourth quadrant (lower Y and right X) were efficient and non-responsive.
RESULTS AND DISCUSSION
Nitrogen (N) levels and cultivars were significant for all traits, but the cultivar x N doses interaction were not significant for grain yield, plant height and ear height (Table 1). The grain yield of the different cultivars did not differ at doses of zero, 30 kg ha-1 and 120 kg ha-1 (Table 2). At N dose of 60 kg ha-1, only CMS 39 was higher than BRS Sol da Manhã, and at 200 kg ha-1, the BRS Sol da Manhã produced less than all the other cultivars. The cultivar BR 201 had the highest mean grain yield at dose 200 kg ha-1 of N. The non-significance of the cultivar x N doses interaction showed that this method was inadequate even when used with different experimental N doses and cultivars that was differentiated regarding their response to N. Thus, analysis of variance of the test traditionally used to evaluate the performance of the cultivars was not appropriate for abiotic stress plant breeding.
The lack of significance of the cultivar x N doses interaction for the traits of plant height, ear height and grain yield indicated that the differences between the average traits of the cultivars were maintained at all N doses and traditionally the statisticians suggest that the interpretation of interaction is not necessary. However, from the statistical or plant breeding point of view, the interpretation of interaction must be interesting.
Regarding plant breeding, the interpretation of the cultivar x N doses interaction becomes interesting as the more recently released maize cultivars are responsive to increased inputs and are very productive because they were selected in the presence of high inputs (Sawazaki & Paterniani, 2004). However, it was possible to identify differences between the cultivar responses to increased N, even when the analysis of variance detected non-significance, because the differences between cultivars were not large enough in relation to the coefficient of variation usually found for grain yield, which ranges from 8 to 16% in field trials (Scapim et al., 1995).
Although correlation does not imply a cause and effect relationship, it may help to understand the general association between two variables. The correlation for grain yield between N doses was high and significant when the N levels like 0.74 at 0-30 kg ha-1, 0.91 at 60-120 kg ha-1, 0.66 at 60-200 kg ha-1 and 0.71 at 120-200 kg ha-1. All the other correlations were not significant. This shows the similar performance between the cultivars in similar environments.
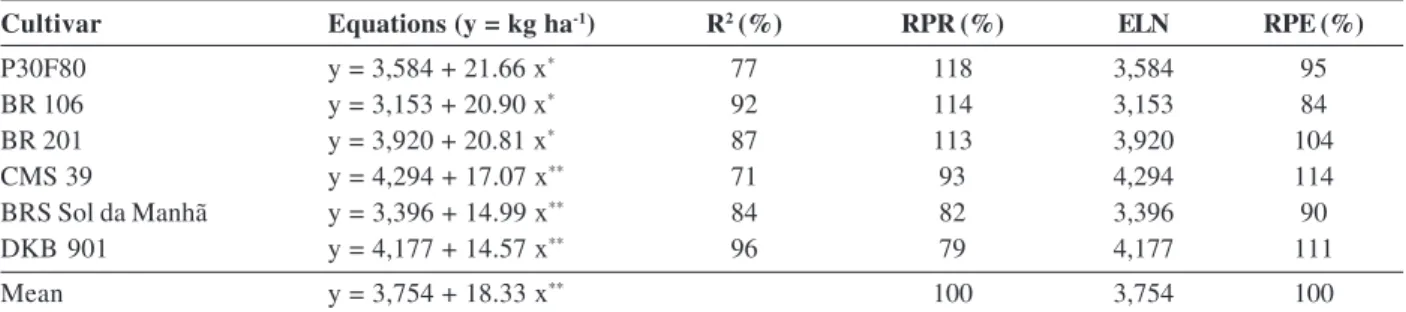
All cultivars were responsive to higher N doses based on the regression analysis, but it was possible to identify those that were more responsive, based on the regression coefficient (Table 3). The estimated regression coefficient (ß1) for the responsive cultivars (P30F80, BR 106 and BR 201) showed ß
1 = 20, which was 34% higher in relation to
the least responsive (BRS Sol da Manhã, CMS 39 and DKB 901) with ß
1 = 15. Thus, for every 12 pounds of N
applied, the most responsive cultivars will produce 60 kg
ha-1 of grain more than the least responsive, corresponding to 1,000 kg ha-1 of grain at a dose of 200 kg ha-1.
The cultivars CMS 39, DKB 901 and BR 201 were considered the most effective at low N doses (zero and 30 kg ha-1) for grain yield and were above the overall average of the cultivars (Tables 2 and 3). The BR 201 was the only cultivar that was considered the most responsive and the most effective at low N doses (zero kg ha-1).
The classification of the efficiency and response to N of cultivars using regression equations was consistent with the preliminary classification. For the methodology proposed by Fageria & Kluthcouski (1980), it is essential to determine the lower and upper critical levels in response to nutrients. These levels can be interpreted as the joint action of different genes in relation to the mechanisms of absorption, translocation and utilization of nutrients (Atlin & Frey, 1989; Souza et al., 2008b; Fritsche-Neto et al., 2010b). Gallais & Hirel (2004) suggested that in low N
Table 1. Mean square of grain yield (GY), plant height (PH), ear height (EH) and female flowering time (FF) of maize cultivars evaluated
Mean square
GY PH EH FF
Blocks 2 4,350,886** 87ns 47ns 2.23ns
Nitrogen doses 4 44,373,675** 3,706** 3,118** 42.22**
Error (a) 8 616,695 125 104 1.58
Cultivars (C) 5 2,707,311** 7,407** 5,204** 97.89**
C x N doses 20 525,722ns 86ns 59ns 0.91*
Error (b) 50 395,274 82 59 0.48
CV (%) 12 5 8 1
ns: not significant; *, **: significant at p < 0.01 and p < 0.05 by the F test, respectively.
Source Variation DF
Table 2. Means of grain yield (kg ha-1), percentage of production potential (PPP) and nitrogen concentration (N, dag kg-1) obtained by maize cultivars in different nitrogen doses evaluated
3,148a1/ 3,964a 2,759a 3,246a 4,046a 3,987a
(39%) (50%) (39%) (46%) (47%) (48%)
N 2.20 2.32 2.10 2.10 1.95 2.25
3,374a 3,817a 3,590a 3,286a 4,612a 3,999a
(42%) (48%) (51%) (50%) (54%) (49%)
N 1.92 2.21 1.92 2.08 1.90 1.88
6,361ab 6,146ab 5,283ab 5,114b 5,393ab 6,802a
(80%) (77%) (75%) (73%) (63%) (83%)
N 2.82 2.62 2.79 2.78 2.42 2.77
6,515a 6,142a 5,516a 5,331a 5,658a 6,230a
(81%) (77%) (79%) (76%) (66%) (76%)
N 2.65 2.68 2.67 2.82 2.53 2.93
7,405ab 8,064a 7,187ab 6,153 7,151ab 7,454ab
(93%) (100%) (100%) (88%) (83%) (91%)
N 3.11 3.29 3.33 3.19 2.99 3.32
1/ Means with the same letter in line are similar, by Tukey test in 5%.
Nitrogen doses
(kg ha-1) P30F80 BR 201 BR 106 BRS Sol da Manhã DKB 901 CMS 39
0 PPP
30 PPP
60 PPP
120 PPP
conditions, the efficiency of use is critical for crop production whereas in high N conditions the absorption efficiency is the most important factor.
The absorption efficiency in conditions of low N availability is associated with a high-affinity transport system and in conditions of high N availability, it is associated with low-affinity transport (Lea & Azevedo, 2006). The utilization efficiency is associated with N metabolism enzymes such as nitrate reductase, glutamine synthetase and glutamate synthase (Hirel et al., 2007). The use efficiency is associated with aminotransferase, which is responsible for the accumulation and transportation of N to the grain (Lea & Azevedo, 2007).
The N level that determines the upper critical level is that at which the grain yield is at least 80% of the productive potential (Fageria & Kluthcouski, 1980). At the N dose of 200 kg ha-1, all cultivars reached over 80% of
their production potential (PP) (Table 2). In addition the N content that is recommended as the ideal (2.75 dag kg-1) for maize was reached by all cultivars at the dose of 200 kg ha-1 (Malavolta et al., 1997).
For abiotic stress plant breeding, determining the lower critical level to select efficiency cultivars is important because the trait heritability is reduced as stress increases (Rumbaugh et al., 1984). Using the methodology of Fageria & Kluthcouski (1980), the lower critical level is characterized by the lowest dose at which the differences between the grain yields are significant according to the mean test: in this study an N dose of 60 kg ha-1 was indicated (Table 2). However, at this dose, four of the six cultivars showed adequate N levels and two of these reached 80% of productive potential.
The dose of 30 kg ha-1 led to a reduction of approximately 50% of the productive potential of the
Figure 1. Efficiency and response to nitrogen of six maize cultivars (See details in Materials and Methods).
Table 3. Regression equation, coefficient of determination (R2), relative percentage of response (RPR), efficiency in low N (ELN) and relative percentage of efficiency (RPE) at dose zero of N to maize cultivars evaluated
Cultivar Equations (y = kg ha-1) R2 (%) RPR (%) ELN RPE (%)
P30F80 y = 3,584 + 21.66 x* 77 118 3,584 95
BR 106 y = 3,153 + 20.90 x* 92 114 3,153 84
BR 201 y = 3,920 + 20.81 x* 87 113 3,920 104
CMS 39 y = 4,294 + 17.07 x** 71 93 4,294 114
BRS Sol da Manhã y = 3,396 + 14.99 x** 84 82 3,396 90
DKB 901 y = 4,177 + 14.57 x** 96 79 4,177 111
Mean y = 3,754 + 18.33 x** 100 3,754 100
cultivars (Table 2). This reduction corresponded to a grain yield of approximately 3,500 kg ha-1, close to the mean obtained by the Brazilian producers who use lower inputs, especially N fertilizers. Another fact that indicates the dose of 30 kg ha-1 is adequate because N concentration in maize leaves is below of 2.75 dag kg-1 by Malavolta et al. (1997) as critical for obtaining satisfactory grain yields. In treatments that received no N fertilizer (below 60 kg ha-1), none of the cultivars reached the critical N leaf concentration, showing that these doses are below those required to satisfactory grain yields.
At doses of 30 kg ha-1 and 200 kg ha-1 (the lower and upper critical levels according to the method of Fageria & Kluthcouski (1980)), cultivars BR 106, P30F80 and BR 201 were classified as responsive and cultivars DKB 901, CMS 39 and BR 201 as efficient (Figure 1). This classification is consistent with that obtained by regression analysis of the cultivars in terms of rates of N used as standard.
There is a dosage difference of 100 kg ha-1 between the highest and the lowest nutrient availability treatments (Miranda et al., 2005; Souza et al., 2008b). The small difference in productivity between the doses defined as the lower and upper critical level may compromise the selection of maize cultivars for the efficient use of N, as it may be appropriate for studies on soil fertility, because grain yield between high and low N environments will be correlated (Atlin & Frey, 1989).
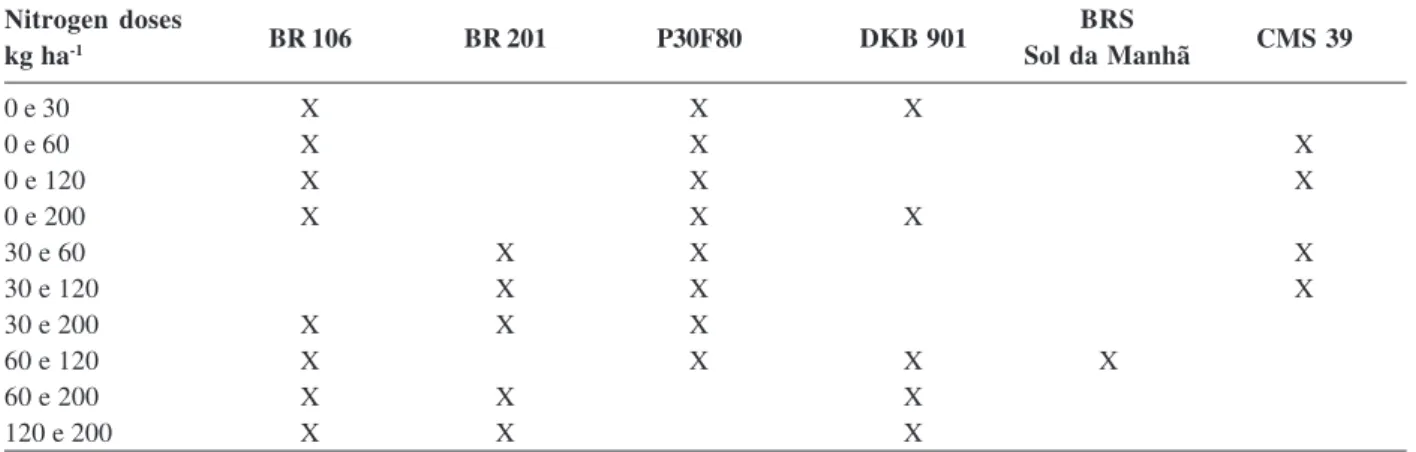
By applying the methodology Fageria & Kluthcouski (1980) for the ten combinations of N rates used, we observed that the cultivar BR 106 and P30F80 were classified eight times as responsive, BR 201 and DKB 901 five times, CMS 39 four times and, BRS Sol da Manhã one time (Table 4). It was also noted that combinations of do-ses when the higher dose was 200 kg ha-1 or when the difference between doses was superior to 100 kg ha-1, the cultivars BR 106, BR 201 and P30F80 were responsive. The DKB 901 is considered an efficient cultivar and only
Table 4. Maize cultivars classified like responsive to nitrogen according with combination of nitrogen doses and methodology of Fageria & Kluthcousk (1980)
0 e 30 X X X
0 e 60 X X X
0 e 120 X X X
0 e 200 X X X
30 e 60 X X X
30 e 120 X X X
30 e 200 X X X
60 e 120 X X X X
60 e 200 X X X
120 e 200 X X X
BRS Sol da Manhã
BR 106 BR 201 P30F80 DKB 901 CMS 39
Nitrogen doses kg ha-1
showed response to N at doses of 200 kg ha-1. The BRS Sol da Manhã was developed in soil with low N availability and was correctly classified by the regression analysis, response and efficiency methodology.
CONCLUSIONS
Use efficiency and response method based on two N levels classifies the cultivars in the same way as the regression analysis and is appropriate in plant breeding routine.
There is a need to identify the N levels required to discriminate maize cultivars in conditions of low and high nitrogen availability in plant breeding programs that aim to obtain efficient and responsive cultivars.
The analysis of the interaction genotype x environment at experiments with contrasting doses is always necessary, even when the interaction is not significant.
ACKNOWLEDGEMENTS
We thank the Foundation for Research Support of Minas Gerais State (Fapemig), the Brazilian Federal Agency for Support and Evaluation of Graduate Education (Capes) and the National Council for Scientific and Technological Development (CNPq) for financial support.
REFERENCES
Alves FG, Ramalho MAP & Souza JC (2002) Alterações nas pro-priedades genéticas da população CMS-39 submetida à seleção massal para prolificidade. Revista Brasileira de Milho e Sorgo 3:89-101.
Atlin NG & Frey KJ (1989) Breeding crop varieties for low -Input agriculture. American Journal of Alternative Agriculture, 4:53-58.
Fageria NK & Kluthcouski J (1980) Metodologia para avaliação das cultivares de arroz e feijão para condições adversas de solo. EMBRAPA/CNPAF. 22p.
Faluba JS, Miranda GV, DeLima RO, Souza LV, DeBem EA & Oli-veira AMC (2010) Potencial genético da população de milho UFV 7 para o melhoramento em Minas Gerais. Ciência Rural, 40:1250-1256.
Fidelis RR, Miranda GV, Santos IC, Galvão JCC, Peluzio JM & Lima SO (2007) Fontes de germoplasma de milho para estresse de baixo nitrogênio. Pesquisa Agropecuária Tropical, 37:147-153.
Fritsche-Neto R, Miranda GV, DeLima RO & Souza HN (2010a) Factor analysis and SREG GGE biplot for the genotype x environment interaction stratification in maize. Ciência Rural, 40:1043-1048.
Fritsche-Neto R, Miranda GV, DeLima RO, Souza LV & Silva J (2010b) Herança de caracteres associados à eficiência de utili-zação do fósforo em milho. Pesquisa Agropecuária Brasileira, 45:465-471.
Gallais A & Hirel B (2004) An approach to the genetics of nitrogen use efficiency in maize. Journal of Experimental Botany, 55:295-306.
Hirel B, Gouis JL, Ney B & Gallais A (2007) The challenge of improving nitrogen use efficiency in crop plants: towards a more central role for genetic variability and quantitative genetics within integrated approaches. Journal of Experimental Botany, 58:2369-2387.
Lea PJ & Azevedo RA (2006) Nitrogen use efficiency 1: Uptake nitrogen from the soil. Annals of Applied Biology, 149:243-247.
Lea PJ & Azevedo RA (2007). Nitrogen use efficiency 2: Amino acid metabolism. Annals of Applied Biology, 151:269-275.
Malavolta E, Vitti GC & Oliveira SA (1997) Avaliação do estado nutricional das plantas: princípios e aplicações. Piracicaba, Potafós. 319p.
Miranda GV, Souza LV, Guimarães LJM, Namorato H, Oliveira LR & Soares MO (2005) Selection of discrepant maize cultivars for nitrogen use efficiency by a chlorophyll meter. Crop Breeding and Applied Biotechnology, 5:451-459.
Miranda GV, Souza LV, Guimarães LJM, Namorato H & Soares MO (2009) Multivariate analyses of genotype x environment interaction of popcorn. Pesquisa Agropecuária Brasileira, 44:45-50.
Parentoni SN & Souza Júnior CL (2008) Phosphorus acquisition and internal utilization efficiency in tropical maize cultivars. Pesquisa Agropecuária Brasileira, 43:893-901.
Perecin D & Cargnelutti Filho A (2008) Efeitos por comparações e por experimento em interações de experimentos fatoriais. Ciência Agrotecnologia, 32:68-72.
Rotili EA, Fidelis RR, Santos MM, Castro Neto MD, Kichel E & Cancellier EL (2010) Eficiência no uso do fósforo de varieda-des de arroz cultivadas em solos de várzea irrigada. Revista Ceres, 57:415-420.
Rumbaugh MD, Assay PH & Johnson DA (1984) Influence of drought stress on genetic variances of alfalfa and wheatgrass seedlings. Crop Science, 24:297-303.
SAS Institute Inc. (2003) Statistical Analysis System user’s guide. Version 9.1, Cary. Statistical Analysis System Institute. 220p.
Sawazaki E & Paterniani MEAGZ (2004) Evolução dos cultivares de milho no Brasil. In: Galvão JCC & Miranda GV (Eds.) Tecnologias de produção do milho. Viçosa, UFV. p.13-53.
Scapim CA, Carvalho CGP & Cruz CD (1995) Uma proposta de classificação dos coeficientes de variação para a cultura do mi-lho. Pesquisa Agropecuária Brasileira, 30:683-86.
Souza ARR, Miranda GV, Pereira MG, Souza LV & Lopes PF (2008a) Agronomic performance of white maize landrace in different environmental conditions. Revista Ceres, 55:497-503.
Souza LV, Miranda GV, Galvão JCC, Eckert FR, Mantovani EE, Lima RO & Guimarães LJM (2008b) Genetic control of grain yield and nitrogen use efficiency in tropical maize. Pesquisa Agropecuária Brasileira, 43:1517-1523.
Souza LV, Miranda GV, Galvão JCC, DeLima RO, Guimarães LJM, Eckert FR & Mantovani EE (2010) Inter-relações de nitrogê-nio e fósforo na capacidade de combinação e na seleção de milho. Revista Ceres, 57:633-641.