Global stability analysis of structures and actions
to control their efects
Análise da estabilidade global das estruturas e ações
de controle dos seus efeitos
a Universidade Federal do Espírito Santo, Centro Tecnológico, Departamento de Engenharia Civil, Vitória – ES, Brasil. Received: 10 Jun 2015 • Accepted: 18 Sep 2015 • Available Online 21 Mar 2016
Abstract
Resumo
In this moment in which civil engineering is undergoing a phase where structural projects have been developed with structural systems composed of diferent and complex elements, some methods and criteria are used for the purpose of evaluating important aspects with regard to global and local stability. Among them, it is necessary to mention the parameters of instability α and γz. In this sense, this work has the objective to present the basic concepts of the instability parameters α and γz in accordance with what is clearly deined in the Brazilian standard ABNT NBR 6118; to present the results of simulations of models in the Brazilian structural software TQS varying the stress of compression in the columns in order to relate these values with the stability parameters.
Keywords: global stability, gama-z, structural analysis.
Nesse momento em que a Engenharia civil vem passando por uma fase onde os projetos estruturais têm sido elaborados com sistemas es-truturais compostos por elementos diferenciados e complexos, alguns critérios e métodos são utilizados com a inalidade de avaliar aspectos importantes no que diz respeito à estabilidade global e local. Entre eles, faz-se necessário citar os parâmetros de instabilidade α e Gama-z. Nesse sentido, este artigo tem o objetivo de apresentar os conceitos básicos dos parâmetros de instabilidade α e Gama-z de acordo com o que é claramente deinido na norma brasileira ABNT NBR 6118; apresentar os resultados de simulações de modelos no software estrutural Brasileiro TQS variando a tensão de compressão nos pilares com a inalidade de relacionar estes valores com os parâmetros de estabilidade.
Palavras-chave: estabilidade global, gama-z, análise estrutural.
F. C. FREITAS a
L. A. R. LUCHI a
W. G. FERREIRA a
1. Introduction
The analysis of global stability of structures has become very im-portant nowadays. Civil Engineering, as well as other branches of Engineering, has experienced major advances in their ields. This can be noticed by the total amount built or about to be built by the diferent companies who operate in construction and design. Not only by the signiicant number of services, this increasing request of Civil Engineering also becomes cause and incentive for the development of new technical production methods aimed at better results.
Major projects are launched to supply the demand, which comes day after day, whether in residential, commercial or industrial con-struction. Behind this demand, technical production brings an in-crease for goods and the requirement for the excellence.
Best practices in design and development projects have been con-sidered in the viability procedures of the projects.
One of the advances is evidenced by the improvement design pro-cedures. Factors previously considered only in special buildings (tall buildings or engineering structures), such as the second order efects and global and local stability of the structures, now become necessary in the evaluation in more joint ventures.
These advances are used by most of the current versions of soft-ware to simulate with greater precision the efects to which the structure is subjected in diferent situations.
The Brazilian regulatory standard “NBR 6118:2014 - Concrete Structures Project – Procedure” establishes, in item 15.5, guide-lines for dismissal of the global second-order eforts. To analyze stability, the standard uses two parameters to estimate the second-order eforts:
a
(alfa) andg
Z (Gama-Z).The parameter
a
, the simpler of the two, is used to evaluate the global stability in the structure, but is not able to estimate the sec-ond-order eforts. This parameter allows classifying a structure as ixed or mobile nodes. Parameterg
Z, on the other hand, by meansof its formulation, allows estimation of the second-order eforts. In this context, this paper is presented, aiming to discuss the main concepts involved in the study of global stability of structures, mak-ing use of the stability parameters
a
andg
Z.2. Brief history of stability parameters:
the beginning
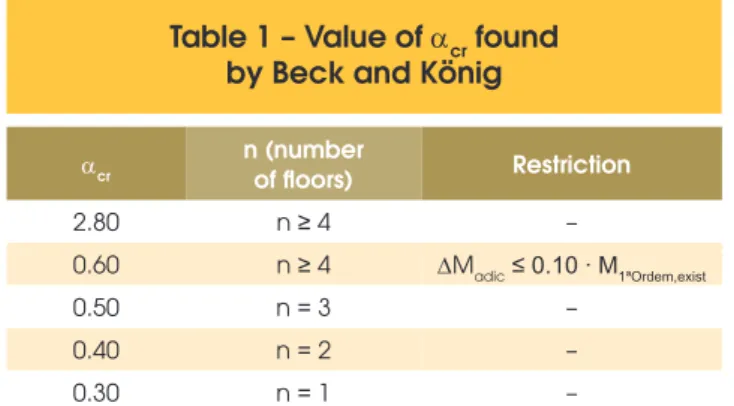
The study on the parameters of stability was started in 1967 by Hurbert Beck and Gert König (1967, cited by Vasconcelos, 1991) after presentation of a doctoral dissertation Germany. This study analyzed the structure of a building with many loors, which were considered the columns braced by rigid walls with a slim struc-ture. Studies led to a complicated solution of the diferential equa-tion with variable coeicients, but after a mathematical simpliica-tion, the equation was reduced to Bessel functions. Based on the solution of this equation, a parameter called “stability coeicient α” was proposed.
This coeicient was able to provide information of what is the dis-placement and deinitions about ixed and mobile nodes of the structure under analysis. By simplifying displacement calculations of the structure, it states that ixed node structures would be those in which the addition of internal forces (existing moments) was less than 10% of the internal forces already present. For these cases, the value of the coeicient α would be below 0.6.
2.1 Diferential equation
Starting from the diferential equation of a straight bar of length L, with constant section and made of a linear elastic material, subject to an axial load P at the ends, one has:
(1)
0
2 2 2=
×
+
a
y
dx
y
d
where y(x) represents the displacement curve of the bar in the transverse direction and
EJ
the lexural rigidity. From the equa-tion of the straight bar, it follows that:(2)
EJ
L
P
a
cr cr 22
=
.
where
a
cr is treated such as a stability coeicient and its value is related to the conditions of support from the bar ends. The value ofa
cr is low when the bar is embedded and high when the bar is biarticulated or mono crimped.2.2 The diferential equation according Beck
e König
The equation proposed by Beck and König (1967, cited by Vascon-celos, 1991) at the time of their studies, was:
(3)
( )
[
( ) ( )
]
EJ
L
w
y
y
¢¢
¢¢
x
+
a
2.
¢
x
×
x
¢
=
.
4when:
(4)
L
x
=
x
In this equation,
w
is the horizontal distributed load across the height L of the building.After some mathematical operations, the equation of the value of
a
found by Beck and König was:(5)
(
)
EJ
L
v
p
cr cr 32
=
+
×
a
where p is the distributed load to which the bracing structure is subjected and
v
is the distributed load at the braced structure. In table 1 the limit values found by Beck and König according with the number of loors are shown.a single column whose geometric characteristics were equivalent to the original. Thereby, it was decided that the sum of the stifness of the bracing structure was equal to the rigidity of a single column. To calculate the equivalent rigidity in cases of bracing columns, the horizontal force acting on the spatial frame should be applied, in order to determine the value of the deformation with the horizontal loads. This deformation must be the same as the one obtained from the equivalent column subject to the same horizontal loads. Once calculated the
a
value, it must be veriied to make sure it does not exceed the limit value. In airmative case, modify the dimensions of the structural elements in order to get below the limit values.Studies of parameters for stability analysis were continued by oth-er authors with intoth-erest in the subject (CEB e ABNT). In 1978, the CEB started using the values
a
lim described by Beck & König, as well as ABNT NBR 9062 (Brazilian code pre-shaped structure). In 1985, Mario Franco (1985) studied again how to obtain the limit values of the stability coeicient for buildings with more than three loors inding values ranging close to 0.6 in structures with wall-like columns, frames and combination frames and wall-like columns. Vasconcelos (1985) found for structures with 1, 2 and 3 pavements values as described in Table 2.In 1986, Augusto C. Vasconcelos took over studies by Beck & König, but this time with the advent of the computer, he could as-sess the same structure previously studied discretized, instead of continuous structure. The results were not diferent for up to three loors, and from four loors the diference between
a
cr and8
.
2
=
a
was decreasing with the increase of the amount of loors. This study resulted in the suggestion of a formula for calculatingcr
a
according to the number n of loors. Follows the formula:(6)
n cr
=
2
.
8
-
1
.
1
×
e
0.22a
In 1990, the CEB decides to drop the considerations on the cal-culation of
a
stability parameter. In this context, Mario Franco and Augusto C. Vasconcelos (1997, Franco, M. and Vasconcelos, AC, cited Vasconcelos, 1991) introduced the irst concept of the ampliication coeicient of the momentg
Z in the state of Rio de Janeiro, as an auxiliary tool in the study of global stability. Through the P-Delta process, come up to the idea ofg
Z.When the structure is requested by the loads, it undergoes a dis-placement altering its original coniguration. From this new con-iguration, new internal forces are created, which in turn generate new displacements. In this continuous process, it is noted that at every step new strains are generated which, compared to the pre-vious results, can be represented by a geometric progression. This progression has the following ratio:
(7)
1M
M
q
=
D
where:
(8)
1
y
P
M
=
×
D
and
y
1 is the eccentricity of irst order, andM
1 it is the irst ordermoment.
Years after the deinition of the moment ampliication
g
Z, severalstudies were conducted on this topic. In the year 1993, the TQS cre-ates the Spatial Frame module in which it begins to use the param-eters of stability
a
andg
Z. Correlations betweena
andg
Z werealso formulated as approaches for practical applications. Table 3 has some of the correlations that were presented in articles and studies.
3. Study of global stability of structures
The study of global stability of the structures has gained a high
Table 1 – Value of
a
crfound
by Beck and König
acr n (number
of floors) Restriction
2.80 n ≥ 4 –
0.60 n ≥ 4 DMadic≤ 0.10 ∙ M1ªOrdem,exist
0.50 n = 3 –
0.40 n = 2 –
0.30 n = 1 –
Source: Origem dos Parâmetros de Instabilidade acr e gz (Vasconcelos, 1991)
Table 2 – Values of
a
crin according
with the number of floors
acr n (floors)
0.50 1
0.55 2
0.60 3
Source: Origem dos Parâmetros de Instabilidade acr e gz (Vasconcelos, 1991)
Table 3 – Correlations of
a
crand
g
zAuthors Correlations
Prof. Mário Côrrea e Prof. Marcio Ramalho
2 Z
1.10 0.33
0.50
g =
−
a +
a
Regina Maria dos Santos Carmo
2 3
Z 0.90 0.52 0.62 0.46
g = + a − a + a
Source: Origem dos Parâmetros de Instabilidade acr e gz (Vasconcelos, 1991);
importance position because it has become common to devel-opment projects in which buildings have been increasingly high, slender and with features aimed at excellent performance, low consumption of materials, structural systems with speed of execu-tion without giving up the structural safety of the guarantee to the ultimate limit state.
Accordingly, the veriication of the global stability can be checked through the global stability parameters, which are described in the standard NBR 6118, in the items 15.5.2 and 15.5.3.
Using these parameters allows us to estimate data on the stability of the structure and estimate the second-order efects in a sim-pliied manner. For this reason, it is necessary to present some concepts related to second-order efects and that should be con-sidered in the project.
3.1 Related concepts to global stability
of structures
3.1.1 Physical nonlinearity
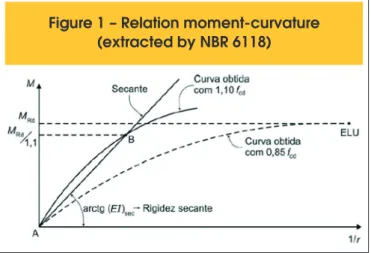
According to NBR 6118, in section 15.3, structural analysis consid-ering the efects of second order shall take into account the efects of physical nonlinearity. The nonlinearity is related to the behavior of the material, which in the case of reinforced concrete can be considered a non-linear material. The efects caused by creep, shrinkage and concrete cracking afect the inal value of concrete elastic modulus, hence the physical non-linearity of concrete. For consideration of these efects, the rule establishes the concept of moment-curvature, shown in Figure 1.
According Moncayo (2011), the advantage in using the moment-cur-vature relationship is due to the fact that is possible to directly obtain the value of rigidity EI, which is used in the structural analysis. In the case of the study of global stability, the NBR 6118 states, in section 15.7.3, that the consideration of the approximated nonlinearity takes as stifness of structural elements the following values:
Slabs:
( )
EIsec=0, 3E Ici cBeams:
( )
EIsec=0, 4E Ici c para 'S S
A ≠A
( )
EIsec=0, 5E Ici c para 'S S
A =A
Columns:
( )
EIsec=0,8E Ici cwhere:
c
I
is the moment of inertia of the gross concrete section, includ-ing, where applicable, the co-operating tables (T section),A’
s is the compression reinforcement when double armor,A
s is the tensile armor,E
ci is the initial modulus of elasticity of the concrete, given byci ck
E =5600⋅ f ;
f
ck is the characteristic compressive strength of concrete in MPa. The approximate stifness values must be used according to the conditions described in paragraph 15.7.3 of NBR 6118.3.1.2 Geometric nonlinearity
The consideration of the efects of geometric nonlinearity is re-lated to changes that may occur in the geometry of the structural elements. Like the physical nonlinearity, it is also determined by analyzing the deformed structure. Specially for high buildings, the consideration of the efects of geometric nonlinearity becomes im-portant because it generates increased internal forces due to verti-cal loads and horizontal displacements.
For the consideration of geometric nonlinearity it is common to use the P-Δ process, where is conducted the study considering the de-formed structure.
3.1.3 Stifness of structural elements
The rigidity of the structural elements has a direct inluence on the overall stability of a structure. In a conventional structure, consisting of columns, beams and slabs, the main elements that will work to ensure stability are the columns and beams. This fact can be seen taking the NBR 6118 approximate stifness values for the slabs, which are lower compared to the stifness of the beams and col-umns. In fact, the slabs will work in another property giving overall stability study: The hard diaphragm. The slabs are considered as rigid elements in their own plane, aligning the displacements at all points of this plane.
Another important consideration to be made is the consideration of hard cores in the buildings. Normally they are formed by large col-umns with “C” shape, and located in the stairs and elevators. This type of structure has a high lexural rigidity in the analysis of stabili-ty and horizontal displacement parameters, contribute signiicantly.
3.2 Global stability parameters
Following studies on the efects of second-order structures, the NBR 6118 code, in chapter 15 - “Instability and second-order ef-fects”, provides guidelines on how to apply test methods and anal-ysis of second-order efects.
For their use, it is considered that it is applied to structures with bars subject to lexion-compression eforts that must disregard the twist. The concepts apply to shells structures, walls and wall-beams. The second order efects are those in which the equilibrium analysis is done using the deformed coniguration.
The code adopts that to disregard the second-round efects the increases caused by these should not exceed 10% in the reactions and the loads of the structure. It should also ensure that the calcu-lated bearing capacity should not be surpassed.
3.2.1 Stability parameters (α)
The structure classiication as the lateral displaceability of the nodes
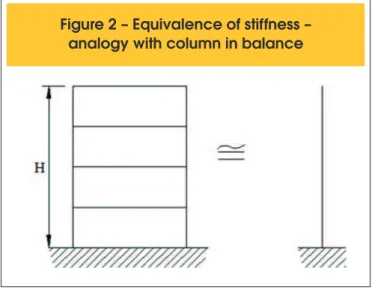
is performed by the Stability parameter a . Above a certain limit value, the structure is classiied as of mobile nodes, and therefore should be considered second-order analysis. It is emphasized that the parameter is not able to estimate the efects of second order. Assuming initially that the bracing structure may be represented by a single column clamped at the base and free at the top, an equivalent
E
jk stifness of the sum of the stifness of the bracingcolumns of the structure (igure 2) and being constant over the height H of the building, we have the following value for the param-eter of instability:
k k
EJ
P
H
×
=
a
In equation 9,
P
k is the sum of all the vertical loads of the structure. It will be a caveat that the amounts to be used are characteristic.(10)
k k
f
d
P
P
P
=
g
×
=
1
.
4
×
(11)
( )
EJ
d=
0
.
7
×
( )
EJ
kThe index “d” indicates design values.
The condition for the structure to be ixed nodes is that
a
<
a
1,thereby
a
1 equal to:(12)
n
×
+
=
0
.
2
0
.
1
1a
if
n
£
3
floors
6
.
0
1=
a
if
n
³
4
floors
The limit value
a
1≤
0
.
6
, when used in structures with less thanfour loors, is generally well applicable to most building structures. However, when the bracing structure is formed exclusively by wall-like columns and frames, the value of
a
1 should be changed. Thenew limit values are described below: -
a
1=
0
.
7
For bracing with wall-like columns;-
a
1=
0
.
6
For mixed bracing (wall-like columns + frames);-
a
1=
0
.
5
For bracing in frames.The equivalent stifness of the bracing elements (framed systems and mixed systems) of the structure is calculated by using the lat-eral characteristic load over the entire height of the building and determining its roof top displacement
δ
.Obtained the deformation on top of the building is done with that for a new column equivalent balance, with constant equivalent stifness, under the action of the same loading, this new column in balance sufer the same displacement at its end cantilevered. Assuming that the load is constant over the entire height of the building, it becomes
(13)
( )
d
×
×
=
8
4H
q
EI
k k where: kq
is the lateral load characteristic;H
is the total height of the building;δ
is the displacement at the top of the building.3.2.2 Coeicient
g
zThe Brazilian code gives the coeicient
g
z assessing thepres-ence or abspres-ence of second-order global eforts in framed struc-tures with at least four loors.
For the determination of its value, it is necessary to make a irst order analysis for each loading case. The formula for
g
z is:(14)
d TOT d TOT ZM
M
, , 1 ,1
1
D
-=
g
where: d TOTM
1, , is the moment of tipping. It is the sum of the moments of all horizontal forces in the considered combination, with design values, in relation to the base structure.d TOT
M
,D
is the sum of the multiplication of the vertical forces act-ing on the structure, in the combination design values considered, for horizontal displacement of the respective points of application. The above values are obtained by irst order analysis.For the structure to be considered as a ixed node structure, the condition is that:
(15)
1
.
1
£
Zg
The condition above being satisied, the structural calculation with ixed nodes can be performed on each compressed element alone.
The element will be with the end linked to the other structural el-ements. According to NBR 6118: 2014, in section 15.6 - “nodes ixed structure Analysis”, under the action of horizontal forces the structure is always calculated as displaceable.
The fact that the structure can be treated as ixed allows to disre-gard only the veriication of the second order global efects. Local second-order efects must be considered.
The code NBR 6118 says that the global analysis of second order provides only internal forces at the ends of the bars and should be performed an analysis of the local second order efects along the axes of the compressed bars.
On the other hand, when the value of
g
Z obtained from a irstorder analysis is higher than
g
Z>
1
.
1
, the structure should becon-sidered of mobile nodes. In this case, the efects of physical and geometric nonlinearity should be necessarily be considered. It is therefore necessary to check the local and global second order efects.
When the value of
g
Z is in the range of1
.
1
<
g
Z≤
1
.
3
, NBR 6118:2014 says that the global second order internal forces can be con-sidered in an approximate way by adopting diferent values of stif-ness for structural elements, which should be the same as shown in item 3.1.1. Finally, the inal solution to the approximate consideration of the global second order internal forces is to increase the horizon-tal forces from the combination of load seen by
Z
0.95
g
, obtainedafter analysis of the irst order structure. This process only applies to
g
Z≤
1
.
3
.In other cases in which
g
Z>
1
.
3
the structure will be of mobilenodes and must be veriied the analysis of second-order efects considering reined methods such as
P
−
D
.4. Structural modeling
To apply the concepts of structural stability, this article will simu-late of a building in a structural modeling software. The CAD/TQS software is one of the tools available in the Brazilian market to professionals involved in the preparation of structural design of
inforced concrete buildings and one of the most widely used. Next will be presented the loor plan of the building used for simula-tion, variations of each model used, the description of vertical and horizontal loads to which the building is subject, the conditions and considerations adopted for structural analysis and presentation of values of
a
andg
Z.4.1 Structural model adopted
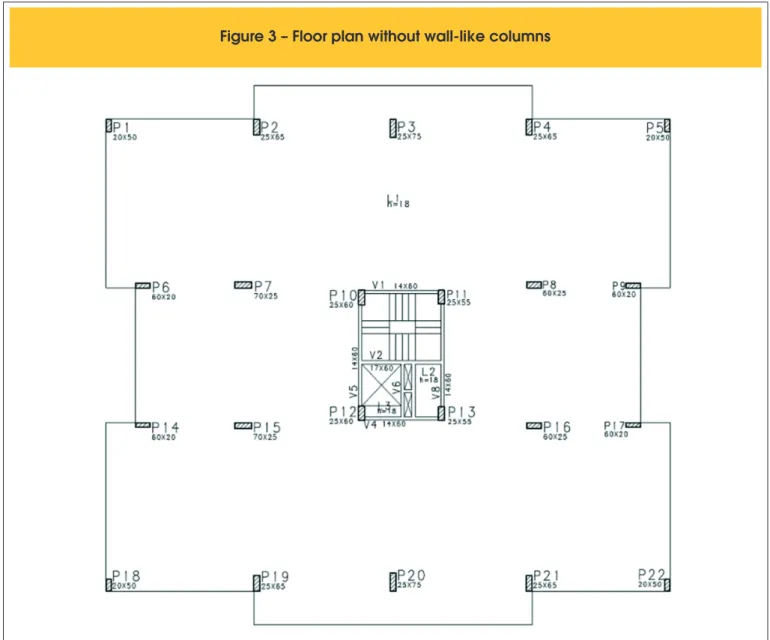
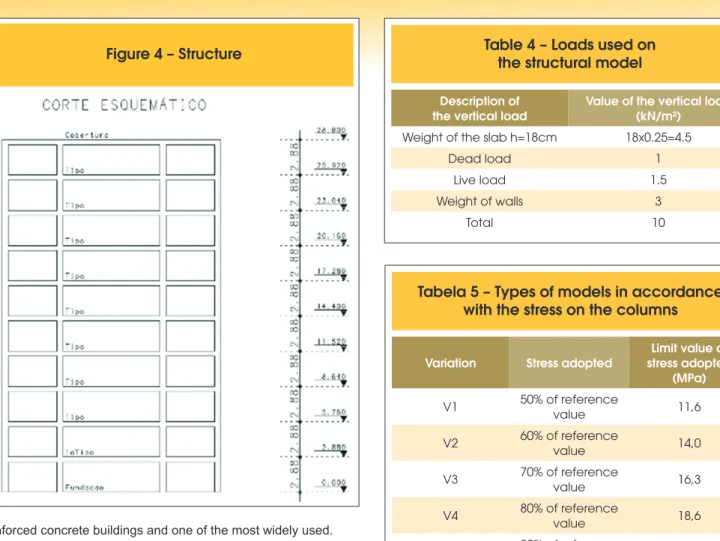
The building consists of 10 loors (Figure 4) in accordance with the loor plan shown in Figures 3 and 5. Were adopted two structural solutions: one without wall-like columns (igure 3) and the other with wall-like columns (Figure 5). This condition was set to
com-pare which are the efects when using wall-like columns.
The CAD / TQS version 17.8 software provides six models for design and structural analysis. In the case of this article “Model VI”, also known as Flexibility Model with Slabs, was adopted. This model is the most appropriate when is used to structural analy-sis of reinforced concrete buildings, because the model considers a three-dimensional space frame consisting of beams, columns and slabs. The model consists of bars, which simulate the slabs, beams and columns.
Table 4 – Loads used on
the structural model
Description of the vertical load
Value of the vertical load (kN/m²)
Weight of the slab h=18cm 18x0.25=4.5
Dead load 1
Live load 1.5
Weight of walls 3
Total 10
Tabela 5 – Types of models in accordance
with the stress on the columns
Variation Stress adopted
Limit value of stress adopted
(MPa)
V1 50% of reference
value 11,6
V2 60% of reference
value 14,0
V3 70% of reference
value 16,3
V4 80% of reference
value 18,6
V5 90% of reference
value 21,0
Table 6 – Preliminary design of Column P1 – Variation V1
Floor Number A.I. C/Pav. C. Pav. C. Acum. b h P.P. Stress
10th Floor 10 11,1 7 77 79 20 50 7 0,0794
9th Floor 9 11,1 10 111 198 20 50 7 0,1976
8th Floor 8 11,1 10 111 316 20 50 7 0,3158
7th Floor 7 11,1 10 111 434 20 50 7 0,4340
6th Floor 6 11,1 10 111 552 20 50 7 0,5522
5th Floor 5 11,1 10 111 670 20 50 7 0,6704
4th Floor 4 11,1 10 111 789 20 50 7 0,7886
3th Floor 3 11,1 10 111 907 20 50 7 0,9068
2nd Floor 2 11,1 10 111 1025 20 50 7 1,0250
1st Floor 1 11,1 10 111 1143 20 50 7 1,1432
The vertical loads considered in the loors below according to Table 4. In order to simplify the study and facilitate the comparison of results between each model, we chose to use surface charges for the masonry load.
4.2 Pre-dimensioning of the columns
The principal objective of this article is to vary the compression stress on the columns in order to relate these values with the sta-bility parameters. For this, the pre-sizing of the columns was de-termined by the method of the areas of inluence on each loor of the building. In accordance with what was previously presented by Table 4, the total load surface is 10 kN/m².
The area of inluence of each pavement was determined by the structural calculation software, but could be obtained manually considering that the distribution of loads occurs simply, i.e., a span between two columns in a deined direction, the inluence of loads in each of these columns, is given until the middle of this span. Reworking this step for the other directions will be obtained an
(16)
MPa
f
ck=
35
The variation of compression stress in the columns is related ac-cording with the criteria that the reference value for design would be:
(17)
MPa
MPa
f
ck35
23
.
3
3
2
3
2
´
=
´
=
The models studied followed stress variations according to Table 5. As an example, Table 6 presents how is determined the prelimi-nary design of column P1, without wall-like columns, following V1 variation:
where:
Pav is the loor considered; A.I. is the Inluence Area in m²;
C/Pav is the Full charge adopted on the pavement (given in Table 4), units in kN/m²;
C. Pav is the Load obtained in the pavement for the column P1 (
C
.
Pav
=
C
/
Pav
×
A
.
I
.
), units in kN; C. Acum: Load accumulatedon the loor, where:
C
.
Acum
=
C
.
Pav
+
P
.
P
.
+
C
.
Acum
pav,superior;b and h are the column section dimensions of the considered loor, in cm;
P.P. is the Weight of the column, obtained by multiplying the cross-sectional area of the column by loor height (2,88 m) and the dead weight of the concrete (25 kN/m³);
Column Stress for each loor is a value obtained by
C
.
Pav
b
×
h
,units in kN/m²;
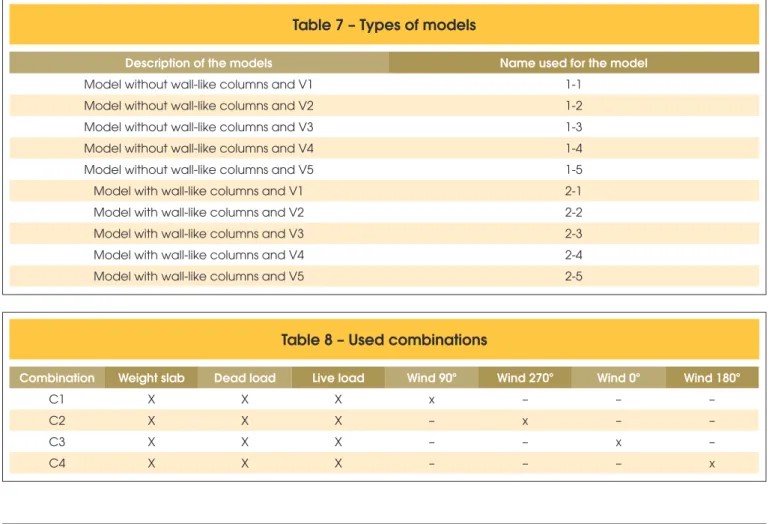
It is observed that the stress in the foundation and irst loor do not exceed the limit value for the V1 range: 11.6 MPa = 1.16 kN/m². To simplify the presentation of the results, were developed the fol-lowing models with the variations V1 to V5 (Table 5), where the dimensions of the columns were pre-determined by each loor plan with and without wall-like columns. Ten diferent models were de-termined in accordance with Table 7.
To obtain the results, the load combinations were considered in models presented in Table 8.
The dead and love loads were increased by
g
f=
1
.
4
and wind loads with coeicientψ
0=
0
,
6
. These values were obtained from theBra-zilian code NBR 6120: 1980 - Loads for Building Structures Design.
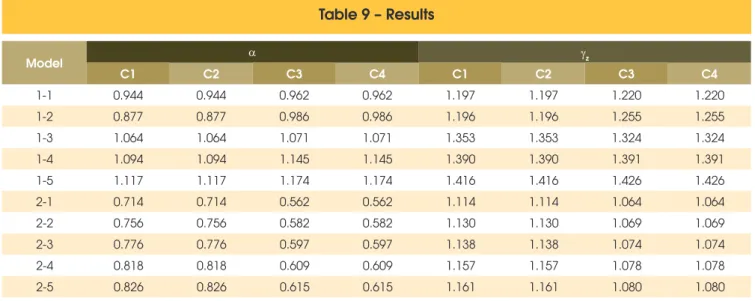
5. Results
The proposed models were processed in the CAD/TQS software,
through three-dimensional frame analysis, and the values obtained of
a
eg
Z are presented on table 9.6. Conclusion
After the presentation of the results using Table 9 and Graph 1, it can be seen that the values of
g
Z obtained for the modelscalcu-lated without wall-like columns are higher compared to models with wall-like columns, which was expected because the presence of the wall-like columns increases the bending stifness of the building. It is also observed that the variation of stress on the columns of the models with wall-like columns results in small diferences of the coeicient
g
Z, with values between 1.064 and 1.161. On modelswithout wall-like columns, the variation of the column stress modify signiicantly the values of
g
Z, making them between 1.197 and1.426. It is possible to conclude, therefore, that the variation of the column stress is not the determining factor in acceptable
g
Zvalues, but the presence of elements that contribute to increase stifness bending. In this case, the author has chosen to use wall-like columns, but alternatives can also be used, wall-like beams with high stifness, walls of reinforced concrete, increase of the columns sections in the direction of less rigidity of the structure.
In this article, the models with wall-like columns have
g
Z valuesbelow the limit, being possible to disregard the second order analy-sis of the structure. It is only needed to perform irst-order analyanaly-sis and increase the internal forces according to the code recommen-dations. In models without wall-like columns, all of them with stress over 70% of the reference value, second-order analysis is needed.
Table 7 – Types of models
Description of the models Name used for the model
Model without wall-like columns and V1 1-1
Model without wall-like columns and V2 1-2
Model without wall-like columns and V3 1-3
Model without wall-like columns and V4 1-4
Model without wall-like columns and V5 1-5
Model with wall-like columns and V1 2-1
Model with wall-like columns and V2 2-2
Model with wall-like columns and V3 2-3
Model with wall-like columns and V4 2-4
Model with wall-like columns and V5 2-5
Table 8 – Used combinations
Combination Weight slab Dead load Live load Wind 90º Wind 270º Wind 0º Wind 180º
C1 X X X x – – –
C2 X X X – x – –
C3 X X X – – x –
Table 9 – Results
Model a gz
C1 C2 C3 C4 C1 C2 C3 C4
1-1 0.944 0.944 0.962 0.962 1.197 1.197 1.220 1.220
1-2 0.877 0.877 0.986 0.986 1.196 1.196 1.255 1.255
1-3 1.064 1.064 1.071 1.071 1.353 1.353 1.324 1.324
1-4 1.094 1.094 1.145 1.145 1.390 1.390 1.391 1.391
1-5 1.117 1.117 1.174 1.174 1.416 1.416 1.426 1.426
2-1 0.714 0.714 0.562 0.562 1.114 1.114 1.064 1.064
2-2 0.756 0.756 0.582 0.582 1.130 1.130 1.069 1.069
2-3 0.776 0.776 0.597 0.597 1.138 1.138 1.074 1.074
2-4 0.818 0.818 0.609 0.609 1.157 1.157 1.078 1.078
2-5 0.826 0.826 0.615 0.615 1.161 1.161 1.080 1.080
In interpreting the values of
a
it is observed that most of the mod-els set up with mobile nodes.Thereby, this article presented the basic concepts of stability pa-rameters α and
g
Z; presented the results of models simulations onthe structural software CAD/TQS varying the compressive stress in the columns for the purpose of relating these values with the stability parameters
a
andg
Z and presented actions that couldbe taken in buildings to minimize the efects of global instability.
7. References
[1] ASSOCIAÇÃO BRASILEIRA DE NORMAS TÉCNICAS (2014). Projeto de estruturas de concreto – Procedimento, NBR 6118, Rio de Janeiro, RJ.
[2] ASSOCIAÇÃO BRASILEIRA DE NORMAS TÉCNICAS (1980). Cargas para cálculo de estruturas de ediicações, NBR 6120, Rio de Janeiro, RJ.
[3] MONCAYO, W. J. Z (2011). Análise de Segunda Ordem Global em Edifícios com Estrutura de Concreto Armado. Master’s degree dissertation, USP. São Carlos, 2011. [4] VASCONCELOS, A. C. (1997). Origem dos Parâmetros de
Estabilidade α e γz - Coletânea de Trabalhos sobre Estabili-dade Global e Local das Estruturas de Edifícios. São Paulo, 1997.
[5] VASCONCELOS, A. C. e FRANCO, M. (1997) – Avaliação Prática dos Efeitos de 2a Ordem em Edifícios Altos – Co-letânea de Trabalhos sobre Estabilidade Global e Local das Estruturas de Edifícios. São Paulo, 1997.
[6] VASCONCELOS, A. C. e FRANÇA, R. C. (1997) - Um méto-do Simpliicaméto-do e Muito Preciso para Avaliação méto-dos Momen-tos de 2a Ordem em Edifícios AlMomen-tos Usuais – Coletânea de Trabalhos sobre Estabilidade Global e Local das Estruturas de Edifícios. São Paulo, 1997.