*e-mail: [email protected]
Carbonation-Related Microstructural Changes
in Long-Term Durability Concrete
Cláudio A. Rigo da Silvaa*, Rubens J. Pedrosa Reisb, Fernando Soares Lameirasc and Wander Luiz Vasconcelosd
a Dep. of Materials Engineering and Civil Construction, Federal University of Minas Gerais,
Rua Espírito Santo, 35, 30160-030 Belo Horizonte - MG, Brazil b Dep. of Civil Engineering, FUMEC, Rua Cobre, 200
30310-190 Belo Horizonte - MG, Brazil
c Nuclear Technology Development Center (CNEN/CDTN)
Av. Mário Werneck, s/n – Cidade Universitária, 31270-901 Belo Horizonte - MG, Brazil d Dep. of Metallurgical and Materials Engineering, Federal University of Minas Gerais
Rua Espírito Santo, 35, 2nd fl., 30160-030 Belo Horizonte - MG, Brazil
Received: September 27, 2001; Revised: July 10, 2002
This paper discusses the effects of carbonation on the microstructure of Portland cement con-crete for long-term durability applications. A class C40 concon-crete (characteristic compression strength between 40 MPa and 44 MPa on the 28th day, according to Brazilian standard NBR 8953) was chosen for the experimental study of the carbonation effects, from which test samples were molded for accelerated test under a 100%-CO2 atmosphere after physical and mechanical characterization. It was observed that carbonation provoked a reduction of 5% to 12% of the concrete open porosity accessible to water. Flexural strength values obtained after the carbonation tests revealed a de-crease of 12% and 25% in relation to the values obtained before tests on the 28th and 91st days, respectively.
Keywords: concrete, carbonation, microstructure, long-term durability
1. Introduction
The increasing concern for reinforced concrete struc-ture durability is justified in many ways: concrete is cheap and relatively easy to obtain anywhere in the world, in com-parison to other building materials; the deterioration of con-crete structures causes great losses to the world economy; reinforced concrete deterioration mechanisms can be better understood and prevented; this is an important field of study which started to be better explored 20 years ago, enabling the production of good concrete with specific physical prop-erties, with the rational use of cement and the addition of minerals, many a time from industrial wastes. In contrast, the concern with world sustainable development has lead to studies and economic and ecological decisions aiming to optimize the use of natural resources in the manufacture of the several types of cement, since cement world
consump-tion has increased unceasingly1.
In the recent years, it has been observed in many parts of the world that one of the major causes of the deteriora-tion of reinforced concrete structures is reinforcement cor-rosion2,3. The durability of the reinforced concrete
reinforce-ment corrosion: it creates a chemical unbalance and lowers the pH of concrete, which facilitates reinforcement depassivation, and also enhances adverse chloride and sulfide reactions.
The action of CO2 progresses from the outside to inside in the form of a carbonation front, although some authors point out that the penetration of carbon dioxide does not necessarily produce a well defined front, and that punctual advances may occur4 Whatever the case, it is necessary to
slow down this advance to the most to obtain durable rein-forced concrete structures. Therefore, for the layer of con-crete on the reinforcement (coating) to be an effective pro-tection it is necessary that it present other characteristics besides appropriate thickness: suitable microstructure den-sity, low porosity and connectivity between the pores, which leads to low permeability5. Such characteristics can be
ob-tained from a concrete which presents low hydration heat, small water/cement ratio, low exudation and plastic shrink-age2.
Most chemical reactions among the aggressive elements and the concrete components occur in the water contained in the pores. Therefore, for an adequate approach of the durability of reinforced concrete structures, it is important to know the material pore structure, the degree of satura-tion of these pores, that is, the volumetric fracsatura-tion of the pores of the material that contain gaseous and aqueous phases, and the evolution of the concentration of the ce-ment constituents which can be attacked with time6,7.
In the case of carbonation, air contains CO2, which re-acts with cement hydrated compounds in the presence of moisture. The carbonation reaction itself is not hazardous to cement, except for the increase in shrinkage, which can occur under certain conditions. The concern about carbona-tion increases when one considers reinforced concrete struc-tures, because a reduction in the pH of the water in the pores of concrete from 12.6-13.5 to values around 9 provokes the depassivation of the reinforcements, exposing them to cor-rosion8-13.
2. Research Significance
The current work presents the results of a study, which aims to clarify the effects of carbonation reaction on the microstructure of concrete. The experimental strategy used was the microstructural characterization of class C40 con-crete, before and after accelerated carbonation tests. The behavior of the material was evaluated by means of the mechanical properties of tensile, by flexural and splitting tests and axial compression. The microstructural parameters considered were porosity, measured by means of two dif-ferent methods; carbonation depth, given by the variation of the material pH (phenolphthalein); and the identification of carbonates by means of electronic scanning microscopy.
The correlation between the microstructure and the proper-ties allowed the evaluation of the action of CO2 in concrete.
3. Experimental Program
The concrete selected, class C40, was made with ce-ment CPII E 32 (composite cece-ment added with 25% slag and 10% limestone), washed sand, coarse gneiss aggregate with maximum 25 mm diameter, and accelerating water-reducing admixture. Tables 1 and 2 show the main charac-teristics of the aggregates and the dosage used. Twenty-eight cylindrical test samples (φ 15 × 30 cm) and 14 prismatic test samples (15 × 15 × 75 cm) were cast according to Bra-zilian standard NBR 5738. Table 3 presents the results of the mechanical tests of axial compression, tensile and
Table 1. Characteristics of Main Aggregates.
Characteristics Fine Coarse
Aggregate Aggregate
Maximum Diameter (mm) 2.4 25
Fineness Modulus 2.62 7.02
Content of Powder Coating 0.35 0.13
Materials (%)
Dry Unitary Weight (kg/m3) 1419 1409
Wet Unitary Weight (kg/m3) 1135 —
Real Specific Weight (kg/m3) 2604 2682
Clay Lumps Content (%) 0.021 —
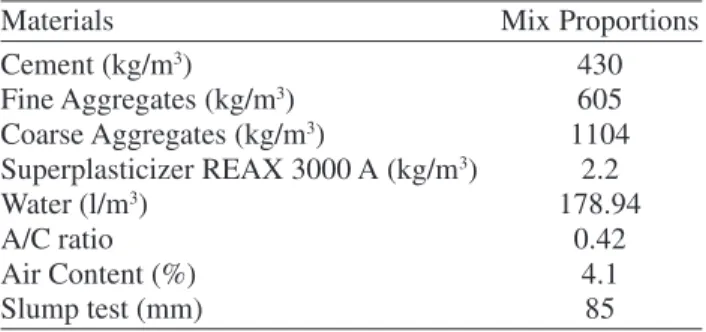
Table 2. Typical Mix Proportions for Strength Group C40 Con-crete.
Materials Mix Proportions
Cement (kg/m3) 430
Fine Aggregates (kg/m3) 605
Coarse Aggregates (kg/m3) 1104
Superplasticizer REAX 3000 A (kg/m3) 2.2
Water (l/m3) 178.94
A/C ratio 0.42
Air Content (%) 4.1
Slump test (mm) 85
Table 3. Mechanical Properties of C40 Concrete.
Tensile Flexural Compressive
Age Strength Strength Strength
(days) (MPa) (MPa) (MPa)
3 2.2 4.7 29.5
7 2.8 5.0 33.8
28 3.9 5.9 41.8
flexural strength up to the age of 91 days.
A special chamber was prepared for carbonation tests, which allowed submitting the test samples to a controlled atmosphere with relative moisture and temperature coin-ciding with those of the laboratory (around 60% and 20 °C, respectively). A composition of 100% CO2 was chosen for the chamber atmosphere in agreement with experiments reported in literature14,15.
4. Test Results
In the first stage, two prismatic test samples – P40CC and P40DC – were submitted to the CO2 atmosphere for 28 days. After the tests, flexural strength and depth of carbona-tion by phenolphthalein in the rupture seccarbona-tion were meas-ured. These data are presented in Table 4.
Open porosity of the concrete samples was measured according to the RILEM16 procedures to obtain the porosity
accessible to water. Eight cubic samples (two of each test sample) with approximately 10 cm corners were cut from four cylindrical test samples (φ 15 × 30 cm) – C40EC, C40FC, C40GC and C40HC. The advantage of this proce-dure is obtaining a concrete sample, which was not carbon-ated in the practice. These samples were initially protected from air with a plastic film, and later kept in oven at 65 °C
for a period equal or superior to three weeks until the mass remained constant. This mass was called dry mass. After reaching this condition, the sample was submitted to vacuum for 24 h, and later kept submersed in water for another 24 h for hydrostatic and saturated mass measurements. The fol-lowing parameters, presented in Table 6, were calculated based on these values17:
a) Porosity: ratio between the volume of pores accessi-ble to water and the apparent volume of the sample; b) Real volumetric mass (Dr): volumetric mass of the
impermeable material, i.e., the ratio between dry sam-ple mass and impermeable material volume;
c) Apparent volumetric mass (Da): ration between dry sample mass and its apparent volume.
Of the eight samples mentioned above, six were sub-mitted to a 100%-CO2 atmosphere for 25 days. The two re-maining samples – C40EC2 and C40FC1 – were kept in air for control. After the accelerated carbonation test period, the RILEM procedure was repeated to obtain the porosity accessible to water for the eight samples. The results are also shown in Table 6.
From the carbonated samples, mortar involving the thick aggregate portions was taken for mercury porosimetry us-ing an AutoPore III 9420 (Micromeritics) capable of reach-ing pressures in the order of 414 MPa. The mortar portions were taken near the sample surface, and an A index was added to the sample name, and from the central region of the sample, added with a B index. Figure 2 shows the mer-cury intrusion curves for the two carbonated samples (C40EC1 and C40GC2) and of a control sample (C40EC2). The parameters obtained from the mercury porosimetry are presented in Table 7.
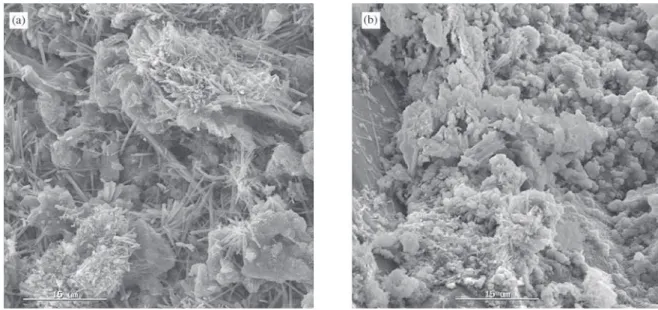
Figures 3 and 4 show aspects of the microstructure of the concrete analyzed. The hydration products were formed normally and the microstructure was compact and with few voids (Fig. 3). Some carbonates were identified as light particles and with smooth surface (Fig. 4).
Table 4. Flexural Strength and Depth of Carbonation.
Flexural Strength
Specimen (MPa) Depth of Carbonation (mm)
P40CC 5.2 Below Surface, without air contact: 0
Lateral Faces: 1-3
Surface with air contact: 8-10
P40DC 5.1 Below Surface, without air contact: 0
Lateral Faces: 2
Surface with air contact: 2-3
Figure 1. Flexural Strength of C40 Concrete.
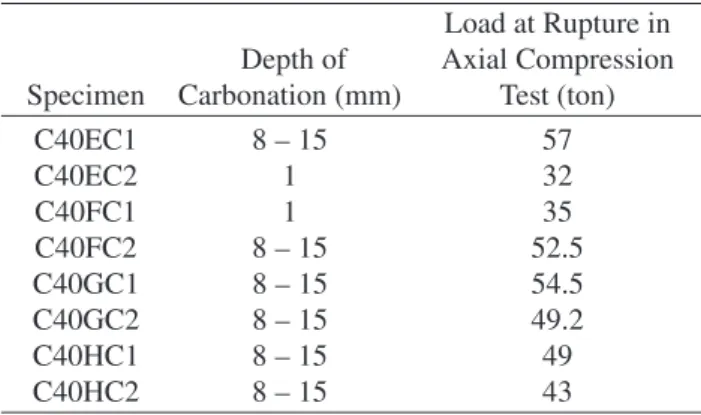
Table 5. Mechanical Properties of Concrete After Carbonation Test.
Load at Rupture in Depth of Axial Compression Specimen Carbonation (mm) Test (ton)
C40EC1 8 – 15 57
C40EC2 1 32
C40FC1 1 35
C40FC2 8 – 15 52.5
C40GC1 8 – 15 54.5
C40GC2 8 – 15 49.2
C40HC1 8 – 15 49
5. Discussion
The carbonated concrete seems to present diminished flexural strength. This can be observed in Fig. 1 and also in the comparison of Tables 3 and 4. The values of flexural strength decreased by 12% and 25% in relation to the val-ues in the previous 28 and 91 days, respectively. At least one of the prismatic test samples (P40CC) had larger val-ues of carbonation depth on the surface, which means that the face was not protected by the metallic mold used in cast-ing the test sample. It seems reasonable that the unprotected
face of the test sample would be more porous than the oth-ers.
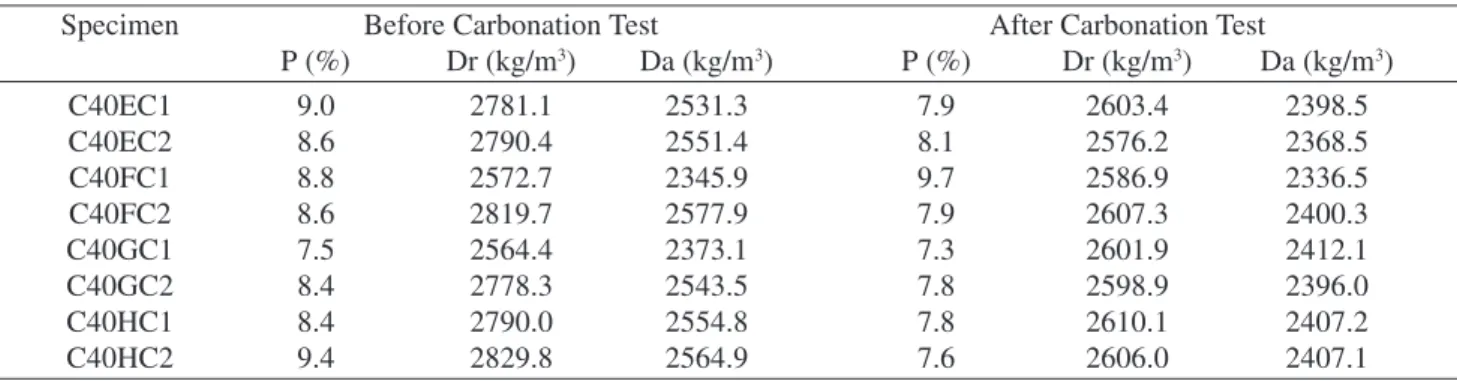
The cubic carbonated samples stood loads significantly higher (22% to 78% higher) than the control sample up to rupture did, as shown in Table 5. These results are a confir-mation that, considering only simple concrete, carbonation can be beneficial, improving some of the properties of con-crete. Measurements of porosity accessible to water (Ta-ble 6) show that carbonation makes concrete more compact, since 5% to 12% of the open porosity was closed. This can be one of the reasons, which explain the increase in me-chanical strength.
Mercury intrusion curves of carbonated samples devel-oped in a more irregular way and presented a total intrusion volume lower than those of control samples, indicating that the pore structures were really closed. The parameters used in this analysis (Table 7) were described in a previous work18.
The open porosity of all are comparable, and the results of C40GC2A and C40GC2B, a little smaller than those of the others, are in agreement with the tendency already observed in the measurements of porosity accessible to water.
The pore surface area, threshold diameter, average and derived distribution diameter values in the end of the intru-sion highlight the significant differences between the car-bonated region (surface) and the non-carcar-bonated region of the samples. The surface area of the pores is always larger Table 7. Parameters Obtained with Mercury Intrusion Porosimetry.
Open Pore Surface Retention Threshold dV/dD at
Porosity Area Factor R Diameter Final Intrusion Dm
Specimen (%) (m2/g) (%) (µm) (m2/g) (µm)
C40EC1A 13.0 11.6 77.5 0.0144 0.9081 0.1238
C40EC1B 11.8 7.6 75.2 0.0144 1.579 0.2745
C40EC2A 13.4 4.8 54.8 0.1443 0.776 0.2123
C40EC2B 12.5 4.2 56.5 0.1441 0.9793 0.2695
C40GC2A 8.9 4.5 71.9 0.0144 0.000 0.1322
C40GC2B 9.2 4.1 71.2 0.027 1.357 0.2767
Table 6. Porosity Accessible to Water, Before and After Carbonation Test.
Specimen Before Carbonation Test After Carbonation Test
P (%) Dr (kg/m3) Da (kg/m3) P (%) Dr (kg/m3) Da (kg/m3)
C40EC1 9.0 2781.1 2531.3 7.9 2603.4 2398.5
C40EC2 8.6 2790.4 2551.4 8.1 2576.2 2368.5
C40FC1 8.8 2572.7 2345.9 9.7 2586.9 2336.5
C40FC2 8.6 2819.7 2577.9 7.9 2607.3 2400.3
C40GC1 7.5 2564.4 2373.1 7.3 2601.9 2412.1
C40GC2 8.4 2778.3 2543.5 7.8 2598.9 2396.0
C40HC1 8.4 2790.0 2554.8 7.8 2610.1 2407.2
C40HC2 9.4 2829.8 2564.9 7.6 2606.0 2407.1
at the surface than inside the sample, even for the control sample, which may be due to the fact that the superficial regions are continually subject to interactions with the at-mospheric elements, including natural carbonation of the control samples (originating from air contact). The thresh-old diameter, inflexion point of the intrusion curve (corre-sponding to the maximum in the dV/dD curve) of the car-bonated samples is smaller than that of the control sample. Some authors19,20 suggest that the threshold diameter
corre-sponds to the smallest diameter of the pores, among the largest pores, which would constitute a percolation path into the sample. Therefore, the sharp decrease in the threshold diameter is an indicator of the closing of the pores as a re-sult of carbonation. The average pore diameter (Dm) of the inner regions of the samples was practically the same, but the differences appear in the averages calculated for the surface regions, for which Dm is significantly smaller for the carbonated samples (about 60% smaller) as a result of the closing of the microstructure.
The carbonated samples present a pore structure more crooked than that of the reference sample. This conclusion, which already seemed to be indicated by the irregular intru-sion curve, is confirmed by the significantly higher value of the retention factor (R), defined as being the ratio between the retained mercury volume after the first intrusion-extru-sion cycle and the total volume of mercury introduced18.
The slope of the tangent in relation to the intrusion curve near the point of maximum pressure (dV/dD in the end of the intrusion) indicates the existence of fine pores in the microstructure into which mercury did not succeed to enter
and which must be identified and described by other tech-niques such as nitrogen adsorption, which was not used in this work. In conclusion, the smaller this slant, the smaller the existing fraction of fine pores. It can be noted from the values presented that the measures of this tangent obtained in the most superficial regions were always smaller than those of the inside of the sample, including of the reference sam-ple (C40EC2), which would indicate a possible effect of the natural carbonation. However, the decrease in dV/dD in the end of the intrusion between the surface and the inside is much sharper for carbonated samples, reaching even the zero tangent for sample C40GC2, evidencing that carbonation promoted the closing of the fine pores to a large extent.
A last aspect, which must be considered in the analysis of mercury porosimetry results, is the morphology presented by the intrusion curves. Figure 2 reveals that the two curves related to the control sample (C40EC2) are practically over-lapped, indicating that the pore size distribution coincides for the surface and the inside of the sample. Now, the car-bonated samples present a much diverse behavior. Practi-cally along all the distribution of the two samples analyzed, the superficial region, therefore which suffered carbonation, had always a mercury intrusion value lower than that of the inner region. In this way, carbonation seems to promote the closing of the pore structure in all the distribution of the sizes presented by the structure.
The microstructure observed in the concrete samples by SEM can be classified as compact, presenting few pores and few fissures. In general, the microstructure was uni-form. In Fig. 3, some cement hydration products can be
observed, such as some ettringite agglomerates (Fig. 3a) and C-S-H particles mixed with portlandite (Fig. 3b). Car-bonates were also identified in some micrographs and are presented in Fig. 4.
6. Conclusions
The main conclusions of this work are summarized be-low:
1. The values of flexural strength obtained after the car-bonation test show a decrease of 12% and 25% in re-lation to the values previously obtained on the 28th
and 91st days, respectively. The carbonated concrete
seems to present a decrease in its flexural strength. 2. The carbonated samples submitted to the
compres-sion test reached rupture with loads significantly higher (22 a 78%) than the control samples did. 3. Carbonation provoked a reduction of 5% to 12% of
the open porosity of concrete.
4. The analysis of the results of the mercury porosimetry showed clearly the closing of the structure of the pores of the material as a result of the carbonation effect:
a) The pore surface area is always larger in the sur-face than inside the sample, even for control sam-ples;
b) The threshold diameter of the carbonated sam-ples is an order smaller than that of the control sample;
c) The average diameter of pore distribution (Dm) of the superficial regions is significantly smaller in carbonated samples (about 60% smaller);
d) The significantly higher value of the retention factor (R) of the carbonated samples seems to point to a pore structure more crooked than that of the reference sample, which already seemed indicated by the irregular intrusion curve; e) The slope (dV/dD) measurement in the end of
the intrusion curve in the most superficial regions were always smaller than those inside the sam-ple, including that of the reference sample (C40EC2), which would indicate for this sample a possible natural carbonation effect. However, the decrease in the value of dV/dD in the end of the intrusion between the surface and the inside is much sharper for carbonated samples, even reaching the zero tangent for sample C40GC2, demonstrating that the carbonation promoted the closing of a large part of these finer pores. f) Carbonation seems to promote the closing of the
pore structure in all the size distribution presented by this structure.
5. The microstructure observed in the C40 concrete sam-ples can be classified as compact, presenting few pores and fissures.
Acknowledgments
The authors thank FAPEMIG financial support.
References
1. Mehta, P.K. In: Proceedings of II Intern. Conference on
High-performance Concrete and..., Gramado, RS, p. 1-14, 1999.
2. Swamy, R.N. In: Proceedings of Second CANMET/ACI Intern. Conference on High-performance Concrete, ACI SP-186, p. 765-788, 1999.
3. DaSilva, T.J.; Roca, P. In: Proceedings of Second CANMET/ACI Intern. Conference on High-performance Concrete, ACI SP-186, p. 525-533, 1999.
4. Parrott, L.J. Magazine of Concrete Research, v. 46, n. 166, p.23-28, 1994.
5. Rigo da Silva, C.A.; Lemos, F.L.; Vasconcelos, W.L.; Lameiras, F.S. In: 43o Congresso Brasileiro de Cerâmica, Florianópolis, SC, 1999.
6. Papadakis, V.G.; Vayenas, C.G.; Fardis, M.N. ACI Mate-rials Journal, v. 88, n. 2, p. 186-196, 1991.
7. Mehta, P.K.; Monteiro, P.J.M. Concreto: estrutura, propriedades e materiais, Editora Pini, SP, Brasil, 581 p., 1994.
8. Neville, A.M. Propriedades do Concreto, Editora Pini, SP, Brasil, 828 p., 1998.
9. Rafai, N. et al., Cement and Concrete Research, v. 21, n. 2/3, p. 368-377, 1991.
10. Kazmierczak, C.S.; Lindenmeyer, Z. In: Proceedings of Intern. Congress on High-performance and..., Florianópolis, SC, p. 402-413, 1996.
11. Papadakis, V.G.; Vayenas, C.G.; Fardis, M.N. ACI
Ma-terials Journal, v. 88, n. 4, p. 363-373, 1991.
12. Kobayashi, K.; Suzuki, K.; Uno, Y. Cement and Con-crete Research, v. 24, n. 1, p. 55-61, 1994.
13. Deloy, F.X. In: Proceedings of International Seminar, Brasília, DF, p. 1-11, 1997.
14. Helene, P.R.L. In: Proceedings of II Intern. Conference on High-performance Concrete and..., Gramado, RS, p. 1-30, 1999.
15. Guimarães, A.T.C.; Dias, C.R.R.; Recena, F.A.P.; Helene, P.R.L. In: Proceedings of II Intern. Conference on High-performance Concrete and..., Gramado, RS, p. 1-18, 1999.
16. RILEM Commission 25 PEM, Test n. I.1 – Porosity accessible to water, Matériaux et Construction, RILEM, v. 13, n. 75, p. 177-179, 1980.
17. Rigo da Silva, C.A.; Reis, R.J.P.; Vasconcelos, W.L.; Lameiras, F.S. In: Anais do V Encontro Nacional de Aplicações Nucleares, Rio de Janeiro, RJ, p. 1-6, 2000.
18. Rigo da Silva, C.A.; Vasconcelos, W.L. In: I Simpósio Brasileiro de Estruturologia, Belo Horizonte, MG, p. 1-10, 1998.
19. Katz, A.J.; Thompson, A.H. Physical Review B, v. 34, n. 11, p. 8179-8181, 1986.