*e-mail: [email protected], [email protected]
Compression Tests of Castor Oil Biopolymer
Amauri Bravo Fernedaa*, Romeu Rony Cavalcante da Costaa*, Volnei Titab, Sérgio Persival Baroncini Proençac, Jonas de Carvalhoa, Benedito de Moraes Purquerioa
a
Department of Mechanical Engineering, School Engineering of São Carlos,
University de São Paulo
b
Department of Materials, Aeronautical and Automobilist Engineering,
School Engineering of São Carlos, University de São Paulo
c
Department of Structures Engineering, School Engineering of São Carlos,
University de São Paulo
Received: March 13, 2006; Revised: July 31, 2006
Many methods have been developed to test and evaluate the mechanical properties of the biopolymer from castor oil employed in implants and osteo-repositions, among other things. Most of the methods are performed under quasi-static and cyclic loads (creep and relaxation tests) and under high strain rate, uniaxial compression conditions. This paper presents and discusses the development and applicability of a simple load-application apparatus, devised to reduce shear and barrelling effects on specimens and allow for conventional strain around 45%. Besides contributing valuable information on the mechanical behavior of the castor oil polyurethane, the results of this research point to multiple biomedical applications for this material.
Keywords: compression test, mechanical behavior, biopolymer, castor oil
1. Introduction
The castor oil polyurethane (PU) have been used in many ap-plications, such as in dental implants1, wood adhesives2, concrete agglomerates3, bone defect illing4, bone cement5, hip prostheses6, electrical insulators7; vegetal iber composite matrixes8, and intra-patellar socket gloves9.
Despite its versatility, the main applications and researches on the castor oil PU lie in the medical ield. Researchers, such as Ohara et al.10 and Ignácio et al.11 studied the biocompatibility of this PU employed as bone cement in rabbits. The absence of adverse reactions found by these authors indicated its biocompatibility in living organisms. The research carried out by Ignácio et al.12 also brought important contributions to orthopedic surgery. In his study PU cylinders enriched with calcium carbonate to obtain porosity and radiodensity were implanted in rabbits’ legs. The results evidenced the biocompatibility, osteoconductivity and osteoinduction properties of this PU and attested to the mechanical strength of the implant. Later research indicated the possible utilization of this PU in cranium plastic surgeries, jaw prostheses, and contention plates for disc hernia13.
The physical-chemical characteristics of this PU were discussed by Plepis14 and Claro Neto15. The latter and Silvestre Filho6 reported some preliminary results about its mechanical properties in the elastic phase. However, because of its increasing applications, there seems to be the need for further research on the mechanical behavior of this PU.
There is a long-standing interest in obtaining consistent compres-sion test results because of the inherent dificulties in maintaining uniaxial loads. Attempts to reduce the Saint Venant effect—i.e., the barreling effect yielding in the interface between the load platen and the specimen—can be found in several papers. For example, Boyce and Arruda16 used thin Telon sheets between the specimen and the load platen of the test device to prevent barreling. According to the authors inserting one or two Telon sheets suficed to eliminate
bar-reling. On the other hand, Odon and Adams17 afirmed that two types of specimens were necessary: some with a length/diameter ratio (l/d) equal to 2 for strength measurements whereas others with a 2.75 ratio for modulus measurements to avoid boundary effects.
In order to prevent instabilities (e.g., shear, buckling and bar-reling) in polymers at high strain values, Ravi-Chandar and Ma18 employed a conined-specimen compression technique. Although this procedure is capable of eliminating instabilities (i.e., barreling) produced during the test, it does not allow the measurement of strains directly on specimens. Moreover, as this procedure generates friction between the compression device and specimens’ body, inaccurate data may be produce.
Khan and Zhang19 compressed specimens between plates made of VascoMax C-35 steel treated to obtain maximum hardness. A high-vacuum silicone lubricant was used to reduce friction between the surfaces of specimens and load platens. Frachon20 made use of graphite sheets between load platens and specimens to eliminate undesirable effects (heterogeneity) generated by friction and a non-uniaxial state of tensions.
In summary, it is not simple to carry out compression testing on castor oil polymer because it involves several variables that have to be controlled. Nevertheless, because of increasing applications and research on this material, it is fundamental to study its mechanical properties consistently. In this direction, this work irst investigates its performance under compression, i.e., its mechanical properties, including its elastoplastic behavior. Then it seeks to determine the implications of performing these tests on this biopolymer (i.e., bar-reling, shear and buckling).
2. Materials and Methods
2.1. Materials
2.1.1. Biopolymer
The biopolymer was composed of a 1:0.7 mixture of two compo-nents: pre-polymer and polyol, known as 329 L and 471 respectively. This material is sensitive to relative air humidity—in the form of components as well as mixture. The maximum humidity value is 40%: at higher values there is excessive generation of bubbles during po-lymerization of the polyurethane resin, which damages the specimens’ quality since bubbles become points of stress concentration.
2.1.2. Lubricants
Surfaces between specimens and load platens were lubricated with HYSPIN AWS 68 CASTROL oil or MARCAI industrial lu-bricant.
2.1.3. Platens
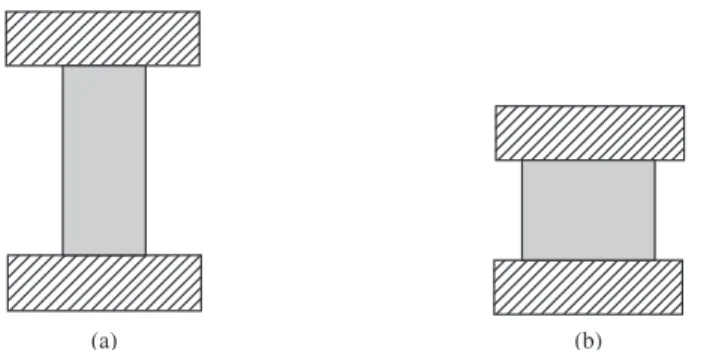
Many researchers have sought ways to end or mitigate friction occurring between load platens and specimens. This study opted for tackling the problem of roughness and surface hardness of platens by using lubricants easily found at warehouses, i.e., Castrol oil (AWS 68 Hyspin) and Vaseline lubricant (Marcai). In this way the roughness of platens was regulated until satisfactory results were obtained, i.e., signiicant decreases in barreling approaching the theoretical strain (Figure 1). The roughness was such as to promote lubrication and expansion of specimen diameter.
2.1.4. Molds
Specimens were manufactured through open moulds made of translucent silicone (4644 VANTICO), which provided them with excellent dimension accuracy. In order to obtain the desired mould shape, a carbon-steel matrix was manufactured on a lathe and recti-ied. Rectiication was performed to obtain a model with adequate surface inish (with roughness Ra = 0.2 mm).
2.1.5. Specimens
Specimens used in this work were molded in a temperature and humidity controlled environment (22 °C and 40%, respectively). It is important to note that the material had an appropriate pot life for the volume handled. According to Claro Neto15, not all crossed links occur during polymerization, i.e., they can go on occurring indeinitely, and an increase in the temperature can prompt their occurrence. Thus, specimens were polymerized in a micro-controlled kiln at 80 °C for 3 hours. This was done to promote residual polymerization as well as to reproduce the sterilization process to which this material is subject prior to implantation. Finally, specimens were faceted to ensure that transversal sections of the base and top were parallel and both perpendicular to their gyration axis.
After dimensional adjustment, strain gages were afixed using an appropriate adhesive made of cyanoacrilate resin: CC-36KYOWA (KYOWA, 2004b)23. The employed strain gages were biaxial (KFEL-2-120-D34) and uniaxial (KFEL-2-120-C1), which can measure strains up to 15%24. To collect data via strain gages, a Hottinger Baldwin Messetechnik GmbH (HBM) acquisition system (MGCplus model with AB22A/AB32) was used.
2.2. Methods
The compression tests followed ASTM D695-9625 speciications, which suggest that specimens have section ratio of 2:1 length/trans-versal—25.4 mm length and 12.7 mm diameter in this case. The test rate for the above speciications was 1.3 ± 0.3 mm/min. However, after some preliminary tests, 0.8 ± 0.05 mm/min proved to be the most adequate velocity for the evaluated material. At least 5 specimens were used in each type of test.
Tests were divided according to their characteristics: • Monotonic tests;
• Cyclic creep tests with loading/unloading; and • Cyclic stress relaxation tests with loading/unloading. Specimens for the cyclic tests were equipped with strain gages placed longitudinally and transversally. Results were divided into two groups:
• Cyclic tests to evaluate the phenomenon of creep; and • Cyclic tests to evaluate the phenomenon of stress relaxation.
2.2.1. Monotonic tests
Monotonic tests were performed to investigate some properties of the polymer under compression as well as its performance as a func-tion of loading and strain level. Tests were performed at 0.8 mm/min and were veriied the elastic-viscoplastic effects, bearing in mind that the behavior of the material is susceptible to the strain rate. Thus, specimens were loaded continuously until a pre-established level of displacement or fracture was reached.
The properties observed in this test were:
• The elasticity modulus (Ec) under compression, i.e., the initial inclination of the stress-strain curve, which depicts the lin-early viscoelastic behavior for many polymers up to the 0.5% strain26;
• The yield stress under compression; and • The elastic strain limit under compression.
2.2.2. Cyclic creep tests
Creep can be observed when the material is kept under constant stress for a long time, which increases strain at a decreasing rate dur-ing this period (see Figure 3). The amount of strain increases as stress increases26. Most materials display this phenomenon; in metals, it can be easily detected at high temperatures, and in polymers, at room temperature. This phenomenon may be recoverable, depending on
(a) (b)
Figure 1. Behavior theoretically expected for compression test: a) before
the nature of internal strain processes. Note that creep cannot occur with a true elastic material, because the level of strain is reached at once and remains constant throughout time.
In this study cyclic creep tests were performed under controlled loading. During these tests specimens were loaded as follows:
1. Loading was carried out at 37.5 N/s until a pre-established force value was reached;
2. This level of force was kept constant for 295.5 s. Then specimens underwent creep because the strain value changed despite the level of force remaining the same;
3. After the aforementioned time elapsed a new loading process began at same initial velocity;
4. Steps 1, 2 and 3 were repeated until completing the desired number of cycles;
5. After this number of cycles, unloading was performed at 37.5 N/s until specimens reached a speciic force value, shown in Figure 2; and
6. Specimens were kept at this force value for a given period of time in order to observe the phenomenon of recovery.
2.2.3. Cyclic stress relaxation tests
Stress relaxation can be usually observed as a decrease in stress when the material is kept at a constant level of strain. Likewise, this phenomenon cannot take place with a true elastic material since the stress level remains constant in this case (see Figure 3).
In this work, controlling the displacement of the device crosshead performed cyclic stress relaxation tests. This test was performed in the same way as the procedure for the cyclic creep test, but under displacement control at 0.8 mm/min instead of loading control. Hence, the crosshead stopped at speciic displacement levels instead of force levels, as it occurred in the cyclic creep test, so as to maintain a constant strain.
3. Results and Discussion
3.1. General aspects
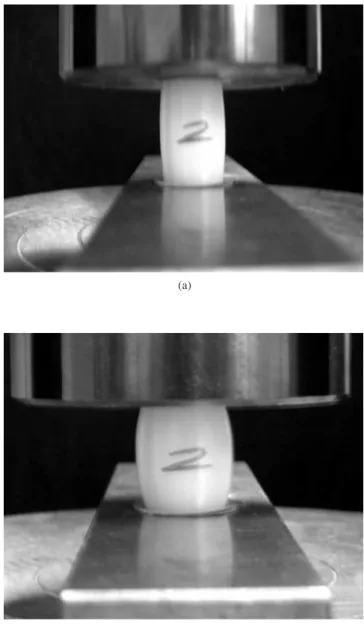
As the load platens of the equipment could not maintain the uniaxial stress state, they promoted shearing of specimens during the preliminary tests. This, combined with the fact that specimens were not long enough, caused barreling (Figure 4). This problem may be averted through diverse procedures. Basically, more effec-tive lubrication can lead to more successful testing, as suggested by Boyce and Arruda16.
0 1 2 3 4 5
Sp 11 Sp 12 Sp 13
Load (N)
Displacement (mm) 6000
5000
4000
3000
2000
1000
0
Figure 2. Load-displacement with creep cycles. Loading, unloading and
re-loading cycles.
S
I
t
I
t e
S
R
t
R
t e
Stress X time curve Stress X time curve Creep
Stress Relaxation
Figure 3. Schematic representation of output (R) to input (I) for creep and
stress relaxation27.
(a)
(b)
Figure 4. Specimen behavior with sandpaper between platens and specimen:
In this work, lubrication with commercial oils (e.g., AWS 68 Hypin Castrol oil and Marcai Vaseline lubricant) was the chosen procedure to deal with the roughness and surface hardness of load platens. The roughness of platens was improved through rectiica-tion until they produced minimum-barreling values. This roughness was directed so as to be a means of lubrication, thus facilitating the diametrical expansion of specimens, as shown in Figure 5. In this sense, the platens were rectiied so as to produce a surface with the
roughness desired, i.e., a roughness that fostered the spreading of the lubricant from center to periphery of platens. The above procedure and the setup used in this test represented an important step in the search for accurate measurements.
3.2 Monotonic tests
Stress and strain values are usually measured from initial area and length values of specimens, given by Equations 1 and 2, known as engineering stress and strain, respectively.
A F 0
v= (1)
L L
0
f= D (2)
Where,
F – the value of the force perpendicular to the transversal section of specimens;
Ao – the initial transversal area value of specimens; and Lo – the initial length of specimens.
Since original dimensions of specimens are constantly chang-ing durchang-ing tests at great strains, it is necessary to refer to present values. Hence, true stress σtrue and true strain εtrue values should be estimated using:
(1 ) A
F true
v = = v +f (3)
L dL
L L
( )
ln ln 1 true
L L
f 0
f
0
f =
#
= = +f(4)
Where,
A – the instantaneous transversal area value of specimens; and Lf – the instantaneous length of specimens.
It is important to remark that Equation 3 is obtained by preserving the volume throughout the strain process, i.e., ALf = AoLo. However, the volume of polymers varies during plasticizing, and in this case, according to Williams26, the yield stress adopted may be that measured when the force peak is reached (Point A). For the polymer in question the force peak occurred near 5% of the engineering strain (Figure 6). This igure shows that after reaching this strain point the material undergoes plasticizing; it irst softens and later begins to harden. (a)
(b)
(c)
Figure 5. a) at the beginning of the test; b) during the test with approximately
45% true strain; and c) comparison between a specimen before the test and a specimen after the test.
0 5 10 15 20 25 30 35 40 45 50
Speed test, v = 0.8 mm/min
True stress calculated with Strue = Syc(1 + Ec ) Point A
T
rue stress (MP
a)
True strain (%) 130
120
110
100
90
80
70
60
50
40
30 20
10
0
Figure 7 shows a comparison among the three ways to estimate stress found in this text (Equations 1, 5, 6) and a comparison between the two ways to obtain monotonic compression data at 0.8 mm/min. It may be noticed that the curves in the elastic phase are practically the same, but for greater strains (in the plastic phase) the curves are quite different from that estimated instantaneously. Hence, the yield stress (σytrue) value shown in the true stress-strain curve differs from that exhibited by the engineering stress-strain curve, because the latter regards the volume as constant, whereas the former estimates the stress through the instantaneous area.
A F true
v = (5)
σtrue = σ(1 + ε) (6)
Note that the volume is considered to be constant when calculat-ing through Equation 6, whereas for Equation 5 the force and area are considered to be instantaneous.
Uniaxial and biaxial strain gages were used to avoid the inlu-ence of equipment accommodation during compression testing and to obtain consistent data (Figure 8).
Data from the strain gages placed transversally to measure cir-cumferential strain enable the calculation of the instantaneous area and, consequently, true stress. The same happens for specimens with biaxial strain gage. Figure 9 shows the stress-strain curve obtained from this equipment, which shows a yield stress (σy) value equal to 46 MPa for test velocity (v) 0.8 mm/s.
Equipping specimens with strain gages avoids effects caused by accommodation between load platens and specimens, thus provid-ing data that represent the real situation at the measurement point. The initial Young modulus value 1.56 GPa was obtained through this procedure.
3.3. Cyclic tests
The following results are from tests in which specimens under-went several loading, unloading and reloading cycles at 0.8 mm/min. In this way, it was possible not only to evaluate force-displacement and stress-strain curves, but also stress-time and strain-time curves.
3.3.1. Cyclic creep tests
Figure 10 shows stress-time and strain-time curves, where strain and stress are estimated through Equations 3 and 4, respectively,
- 15 - 10 - 5 0 5 10 15 20 25 30 35 40 45 50 3
2
1
3-Conventional Stress was calculated with Sc = F/A0
2-True Stress was calculated with Strue = Syc*(1 + Ec) 1-True Stress was calculated with Strue = F/Ai
Stress (MP
a)
Strain (%) Measured with strain gage Measured with LVDT 140
130 120 110 100 90 80 70 60 50 40 30 20 10 0
Figure 7. Conventional Stress vs. True Stress-strain curves: quasi - static,
speed test = 0.8 mm/min.
(a)
(b)
Figure 8. Placement of strain gages: a) uniaxial strain gages placed
longitu-dinally and transversally; and b) biaxial strain gages.
0 1 2 3 4 5 6 7 8 9 10
Syc = 46 MPa
Sp 1 (v = 0.8 mm/min) - strain gages
T
rue stress (MP
a)
True strain (%) 50
45
40
35
30
25
20
15
10
5
0
True stress-strain E = 1.56 GPa
which consider that the volume remains the same during the whole strain process. The data in the graph shown in Figure 13 were ob-tained by LVDT, which provides values of non-localized strain in specimens.
However, whenever these curves were determined directly from geometrical variation of specimens obtained with the aid of strain gages, the data presented values of localized strain, which allowed the observation of other behavior of true stress (see Figure 11). It is important to remark that in this test it was possible to maintain force only instead of stress. Hence, as the instantaneous area of specimens increases the true stress decreases, which may be veriied through the use of the irst part of Equation 3, i.e., σtrue = F/A.
3.3.2. Cyclic stress relaxation tests
It may be observed that during unloading and reloading, the stress-strain curve cycles display an inclination similar to the initial inclination. However, as the equipment did not have a strain control system, it is possible to see in Figure 14 that even with relaxation there is an increase in strain, which may be attributed to the visco-plasticity of the material.
Figure 12 shows true stress-strain curve with loading, unload-ing and reloadunload-ing cycles. It may be observed that durunload-ing unloadunload-ing and reloading, the stress-strain curve cycles display an inclination similar to the initial inclination. However, since the equipment did not have a strain control system, Figure 12 shows Points a, d, g, j and m where relaxation begins, i.e., the points where the equipment crosshead remained still for approximately 10 minutes awaiting stress relaxation. Thus, Segments “ab”, “de”, “gh” exhibit a decrease in stress and a recovery of the material as it relaxes. In Segment “ab” the material is under non-linear viscoelastic regimen; in Segment “de” it is in the softening state under visco-elastoplastic regimen; and in Segment “gh” it is in a transition region between softening and hardening. In Segments “jk” and “mn” the material is in the hardening state due to its molecular chains being virtually aligned. This can be seen in Figure 13, which illustrates the aligning behavior of molecular chains.
Figure 13 demonstrates that in Phase A the idealized polymeric structure has not deformed yet. In Phase B there is some molecular sliding, which deforms the molecule structure thus promoting its organization in Phase C. Finally, in Phase D the structure will be
0 500 1000 1500 2000 2500
T
rue strain (%)
T
rue stress (MP
a)
Time (s) Cyclic 295.5 s
60 55 50 45 40 35 30 25 20 15 10 5 0 20 18 16 14 12 10 8 6 4 2 0 True stress - Time
True strain - Time
Figure 10. Stress-time and strain-time curves for creep obtained with eq.
εv = ln(1 + ε) and σv = σ(1 + ε).
0 500 1000 1500 2000 2500
True stress - Time
T
rue stress (MP
a)
Time (s) True strain - Time
Cyclic 295.5 s
T
rue strain (%)
60 55 50 45 40 35 30 25 20 15 10 5 0 20 18 16 14 12 10 8 6 4 2 0
Figure 11. Stress-time and strain-time curves for creep obtained with strain
gages L L ln f 0 v
f = and A
F v v= .
0 1 2 3 4 5 6 7 8 9 10 11 12 13 14 15 16 17 18 19 20
T
rue stress (MP
a)
True strain (%) 45 40 35 30 25 20 15 10 5 0 o n m l k j i h g f e d c b a + + + + + + + + + + + + + + +
Figure 12. Stress-strain curves with cycles for stress relaxation.
A B C D
thoroughly rearranged and aligned in relation to the loading. This aligning process of molecular chains alters the internal structure and causes the elasticity modulus of the material to vary. Hence, plastic deformation in polymers occurs not with molecular rupture, but with molecular orientation, i.e., the molecules slide into positions parallel or perpendicular to the molecular chain axis27. In addition, the harden-ing process occurs in different ways for uniaxial tension loadharden-ing and uniaxial compression loading. During the former loading uniaxial orientation of polymeric chains takes place whereas planar molecular orientation occurs during the latter loading16. Thus, it is possible to compare the phases in Figure 13 to the segments in Figure 14, i.e., Segments “ab”, “de”, “gh” represent Phase B, and Segments “jk”, “mn” can be seen between Phases C and D.
Figure 14 shows stress-time and strain-time curves for the same tests. The curves indicate that there was a decrease in stress (true stress-time curve), which characterizes the phenomenon of stress relaxation. This phenomenon is more evident when the yield limit is surpassed and there is a higher level of stress relaxation in the mate-rial, as shown in Segment 22-23 of Figure 14. It is also possible to observe in Figure 14 that in the irst segment (Segment 1-2), there is a lower level of stress relaxation for the same period of time than as compared to other cycles, because the material is under viscoelastic regimen whereas in Cycles I until IV. It is important to note that there has been a recovery of the material during the relaxation period as well as an increase in stress relaxation. In Cycles V until VIII the recovery of the material in the relaxation period is not so apparent as in previous cycles, but the stress relaxation level remains high.
Figure 15 shows a stress-strain curve where there are two loading, unloading and reloading cycles. It should be noted that before unload-ing some time was allowed to elapse so as to permit stress relaxation. Figure 15 also shows the occurrence of a permanent strain after unloading, which characterizes a residual or plastic deformation.
It is also important to remark that the irst cycle begins near the compression yield stress, i.e., when the specimen reaches 5.8% true deformation. Nonetheless, it is possible to observe the presence of a small residual strain (about 0.5%). In turn, the second relaxation cycle begins at 7.6% true strain (above yield stress), which causes residual deformation after unloading to be much higher (about 2%).
Since viscoelastic phenomena (creep and relaxation) are a func-tion of time, it is interesting to show stress-time and strain-time curves for both cycles. Figure 16 shows that the phenomenon of relaxation is very marked at the outset of yield as well as in the plasticization phase of the material.
4. Concluding Remarks
The use of new platens together with the lubricant caused satisfac-tory strains during the tests and minimized barreling, which evidences the eficacy of the platens. It is important to remark that manufactur-ing the platens was a quick, practical and inexpensive solution, since the employed material can be easily found and is of common usage. It should also be conclude that the machine was easy to set up to perform the tests and needed no special lubricants.
Using the platens developed, the specimens reached axial strain at around 45% during the monotonic compression tests as measured by the machine crosshead equipped with LVDT. On the other hand, the strain gages were capable of measuring around 17% strains, as this value was the scale bottom for these devices. Thus, this distinc-tion between these measurements is suitable to the purpose of each measurement. Thus, the measurements with 45% strain express the test quality, not the quality of the collected data—i.e., how much the specimen deformed without displaying shearing and barreling. This observation is valid because the measurements were not done
0 1000 2000 3000 4000 5000 6000
2 1 VIII VII VI V IV III II I 23 22 T
rue Strain (%)
T
rue Stress (MP
a) Time (s) Stress Strain 45 40 35 30 25 20 15 10 5 0 18 17 16 15 14 13 12 11 10 9 8 7 6 5 4 3 2 1 0
Figure 14. Stress-strain-time curves with cycles for stress relaxation.
0 1 2 3 4 5 6 7 8 9
Relaxation 1st Cycle
2nd Cycle
T
rue stress (MP
a)
True strain (%) 50 45 40 35 30 25 20 15 10 5 0
Figure 15. Stress-strain curve for two cycles.
Figure 16. Stress-time and strain-time curves for two cycles.
0 50 100 150 200 250 300 350 400 450 500 550 600 650
T
rue strain (%)
T
rue stress (MP
a) Time (s) 50 45 40 35 30 25 20 15 10 5 0 14 13 12 11 10 9 8 7 6 5 4 3 2 1 0 True stress -Time
True strain -Time
the specimens at strain levels around 17% in the absence of shearing and barreling.
The basic properties obtained by means of strain gages are: modulus of elasticity equal to 1.56 GPa, based on the curve in Figure 9 and conirmed by the response given in Figure 13 in the unloading region. The yield stress value was 46 MPa and the Poisson coeficient was approximately 0.44.
The test velocity was 0.8 ± 0.05 mm/min established after observ-ing the material behavior after a series of preliminary tests where the characteristics of the visco-elastoplastic response of the material were veriied. In this way the loading levels for their respective cycles were established. The cyclic tests were done based on the history of the monotonic tests in which the material behavior can be seen—i.e., the linear and non-linear visco-elastic regimen up to the irst stress peak characterizing the boundary between visco-elasticity and visco-elas-toplasticity, the latter with softening and/or hardening. Then, based on these data loading proiles were delineated for each kind of test.
The results with the loading, unloading and reloading cycles dem-onstrated that the unloading tendency lines coincide with the curve inclination found in the visco-elastic regimen. In case unloading was maintained, there would be permanent strain. If unloading were kept, permanent deformation would occur. This mechanical behavior was evidenced by results from relaxation time tests. Despite the fact that the machine in question was not equipped with strain or strain rate control, just control force or displacement. The tests were adequate to assess the properties of the material as well as demonstrating the feasibility of performing them with just platens with directed recti-ication—idealized to enable the diameter expansion of specimens, satisfactorily accomplished as aforementioned.
Therefore, the material has been characterized for use under compressive loading and the platens were shown to be appropriate to perform compression tests on this material.
References
1. Vianna DL. Estudo comparativo da resistência mecânica da poliuretana
derivada de óleo vegetal submetida à ensaios de tração. [MSc
Disserta-tion]. Ribeirão Preto: University of São Paulo; 1997.
2. Jesus JMH, Calil Júnior C, Chierice GO. Adesivo a base de óleo de ma-mona para madeiras. Proceedings of the XIII Congresso Brasileiro de
Engenharia e Ciência dos Materiais; 1998; Curitiba, Brazil; Curitiba;
1998. p. 2063-2971.
3. Silva IJ. Contribuição ao estudo da utilização da resina poliuretana a
base de óleo de mamona na construção civil. [MSc Dissertation]. São
Carlos: University of São Paulo; 1998.
4. Ignácio H. Avaliação da poliuretana da mamona nas formas compacta e
porosa no preenchimento de falha óssea: Estudo experimental em cães.
[Doctorate Thesis]. Ribeirão Preto: University of São Paulo; 1999. 5. Pascon EA. Projeto biocompatibilidade dos materiais endodônticos:
Bio-compatibilidade da resina poliuretana derivada da mamona. [Doctorate
Thesis]. Ribeirão Preto: University of São Paulo; 1999.
6. Silvestre Filho GD. Comportamento mecânico do poliuretano derivado de óleo de mamona reforçado por fibra de carbono: contribuição para o
projeto de hastes de implante de quadril. [MSc Dissertation]. São Carlos:
University of São Paulo; 2001.
7. Murakami CR. Aplicações das resinas poliuretanas derivadas do óleo
de mamona, como materiais isolantes elétricos. [Doctorate Thesis]. São
Carlos: University of São Paulo; 2002.
8. Silva RV. Compósito de resina poliuretano derivado de óleo de mamona
e fibras vegetais. [Doctorate Thesis]. São Carlos: University of São Paulo;
2003.
9. Bonini S. Estudo comparativo da resistência transversal, resistência à compressão, dureza superficial e comportamento visco-elástico da resina
poliuretana em relação à resina acrílica usada para prótese dental.
[Doctorate Thesis]. Ribeirão Preto: University of São Paulo; 2004.
10. Ohara GH, Kojima KE, Rossi JC, Telles M, Soares TVC, Salomão C, Sanda M. Estudo experimental da biocompatibilidade do polímero po-liuretano da mamona implantada intra-óssea e intra-articular em coelhos.
Acta Ortopédica Brasileira. 1995; 3(2):62-68.
11. Ignácio H, Mazzer N, Barbieri CH, Chierici G. Estudos sobre a aplicabi-lidade médica da poliuretana derivada da mamona. Resenha Ortopédica. 1996; 6(2):10-12.
12. Ignácio H, Mazzer N, Barbieri CH, Chierici G. Uso da poliuretana derivada do óleo de mamona para preencher defeitos ósseos diaisários segmentares do rádio. Revista Brasileira de Ortopedia. 1997; 32(10):815-822.
13. Ara CA. Fijacion cervical con polimero vegetal. Revista de Neurocirurgia. 1999; 2(3):103-107.
14. Plepis AMS. Caracterização térmica e viscoelástica de resinas
poliu-retanas derivadas de óleo de mamona. [Doctorate Thesis]. São Carlos:
University of São Paulo; 1991.
15. Claro Neto S. Caracterizações físico-química de um poliuretano derivado
de óleo de mamona utilizado para implantes ósseos. [Doctorate Thesis].
São Carlos: University of São Paulo; 1997.
16. Boyce MC, Arruda EM. An experimental and analytical investigation of the large strain compressive and tensile response of glassy polymers.
Polymer Engineering and Science. 1990; 30(10):1288-1298.
17. Odom EM, Adams DF. Development of an improved compression specimen geometry for unreinforced polymers. Journal of Testing and
Evaluation. 1994; 22(2):104-110.
18. Ravi-Chandar K; Ma Z. Inelastic Deformation in Polymers under Multi-axial Compression. Mechanics of Time-Dependent Materials. 2000; 4(4):333-357.
19. Khan A, Zhang H. Finite deformation of a polymer: experiments and modeling. International Journal of Plasticity. 2001; 17:1167-1188. 20. Frachon A. Modélisation et Simulation Numérique de la Compression en
Matrice de Poudres Métalliques. [Doctorate Thesis]. Grenoble: Institut
National Polytechnique de Grenoble; 2002.
21. Wu JZ, Dong RG, Schopper AW. Analysis of effects of friction on the deformation behavior of soft tissues in unconined compression tests.
Journal of Biomechanics. 2004; 37:147-155.
22. An YG, Vegter H. Analytical and experimental study of frictional behavior in through-thickness compression test. Journal of Materials Processing
Technology. 2005; 160(2):148-155.
23. Kyowa. Adesivo CC-36 – Manual de instruções. Código: IM-G-052b ’99.10. Tokyo: Kyowa Electronic Instuments Co., Ltd; 2004.
24. Kyowa. Strain gages: A complete lineup of high performance strain
gages and accessories; Catalogue code number 101E-U1. Tokyo: Kyowa
Electronic Instuments Co., Ltd; 2004.
25. ASTM (American Society for Testing and Materials) D695-96.
26. Williams JG. Stress analyses of polymers. London: Longman Group Limited; 1973.