*e-mail: [email protected]
An Investigation of Hot Deformation Response of Particulate-Reinforced
Magnesium + 4.5% Titanium Composite
B. K. Raghunatha, R. Karthikeyana*, M. Guptab
a
Department of Manufacturing Engineering, Annamalai University, Annamalai Nagar,
Chidambaram, Tamilnadu, 608002, India
b
Department of Mechanical Engineering, National University of Singapore,
10 Kent Ridge Crescent, Singapore, 119260, Singapore
Received: September 22, 2005; Revised: March 31, 2006
The deformation response of magnesium based metal matrix composite was investigated by means of hot compression tests. The flow curves were obtained in the temperature and strain rate range of 300-500 °C and 0.001-1 s-1 respectively in order to obtain the processing maps of the studied material and interpreting them on
the basis of the dynamic material model. Micro-structural characterization studies conducted on the deformed composite samples, using optical and scanning electron microscopy, revealed a recrystallized grain morphology, debonding of Titanium particles, particle breakage and cracking of the matrix. The observations were performed in order to describe the behavior of the material under hot forming operation in terms of material damage and micro- structural modification.
Keyword:magnesium composite, disintegrated melt deposition, processing maps, hot workability
1. Introduction
The development of metal matrix composites (MMCs) has been one of the major innovations in materials engineering. Metal matrix composites provide an opportunity to combine the metallic properties of matrices with the ceramic properties of the reinforcing phases lead-ing to a composite material with greater modulus, strength, wear resist-ance, and thermal stability. These materials are attractive for advanced structural, aerospace, automotive, and industrial applications1.
Hot formability studies have revealed the deformation behavior of the discontinuously reinforced magnesium matrix composites are more sensitive to processing variables such as temperature and strain rate than the unreinforced alloys. This is due to the presence of hard particles in the soft matrix, which causes plastic flow localization at the particle-matrix interfaces2. Moreover, grain boundary sliding
occurring at the high temperatures above 470 °C and low strain rates below 0.001 s-1 can lead to the formation of wedge-shaped cracks at
grain boundaries that are initiation sites for damage and affect the mechanical properties of the component. Thus a proper selection of the forming conditions is necessary to produce sound components3.
Besides hot working simulations through either hot compres-sion or torcompres-sion tests, necessary to obtain the constitutive parameters for numerical analysis, an alternative approach to the definition of optimum hot-working conditions is offered by processing maps. A ‘processing map’ is the super-imposition of a ‘power-dissipation map’ with an instability parameter on a process variable space of 1 s-1 and 500 °C.
In the plastic forming process the Dynamic Material Model4
considers the work piece as a dissipator of the power supplied by a particular source. The total power dissipated P is calculated to be:
(1)
where σ is the instantaneous flow stress that is the material’s response to the applied strain rate (.e) to reach a given strain e. The first integral defined as G content represents the main power input dissipated in the form of a temperature rise. The second integral, defined as J
co-content, represents the power dissipated by metallurgical processes such as recovery, recrystallisation and phase transformation, and the harmful effects cavity formation and particle damage. The efficiency of power dissipation (η) represents the relative rate of internal entropy production during hot deformation and characterizes the dissipative microstructures under different temperature and strain rate conditions is directly calculated by interpolating the data obtained from the mechanical tests.This parameter was used to instruct power-dissipa-tion maps5 which permits an identification of the region of optimum
workability, defined as the region of high power dissipation. However, since the damage mechanisms such as wedge cracking, correspond to high values of power dissipation efficiency, the results obtained by analyzing the maps require a detailed microstructural investiga-tion to be validated.
A further point has been the introduction of instability maps6.
Which defines metallurgical instability during plastic flow these are based on the principles of irreversible thermodynamics of large plastic flow, which considers the variation in entropy produced by the change in strain. The instability criteria formulated on this basis defines the temperature versus strain rate maps which identifies the regions of unstable flow. Typical manifestations of unstable flow are a) adiabatic shear bands, b) localized shear, c) Luders bands, etc.
The use of power dissipation efficiency and instability maps7 is a
2. Experimental Procedures
The Mg-Ti composites were processed and manufactured by using the disintegrated melt deposition technique, which is briefly explained by Gupta et al.1. The composite was extruded and provided
by National University of Singapore.
Isothermal hot compression tests were conducted using FIE servo controlled universal testing machine with a maximum load capacity of 100 KN.
The hot deformation of the composite material was investigated by hot compression tests at temperatures of 300-500 °C and in the strain rate range 0.001 – 1s-1. The flow stress curves were obtained by
using the classical equations for hot compression tests8. Light
micro-scopy (LM) was used to evaluate micro-structural evolution in terms of grain size and shape behavior for all the hot forming conditions. Scanning electron microscopy observations were performed in order to evaluate damage to the material in terms of (a) particle fracture and (b) decohesion between the matrix and the particle. Specimens deformed in compression were sectioned parallel to the compression axis and the cut surface was prepared for metallographic examina-tion using standard techniques. The specimens were etched using Nital + Methanol reagent and light micrographs taken using polarized light. A resistance heating split furnace having SiC heating elements was used to surround the platens and specimen. The specimens were coated with a borosilicate glass paste which acted both as a lubricant and as a protective coating. The testing temperatures ranged from 300-500 °C in intervals of 50 °C and at constant true strain rates of 0.001, 0.01, 0.1, and 1 s-1. The specimens were deformed to half the
height in each case to impose a true strain of about 0.5.
3. Results and Discussion
The load-stroke data obtained in compression were processed to obtain true stress-true plastic strain curves using the standard equa-tions9. The flow stress data obtained at the different temperatures,
strain rates, and strains were corrected for adiabatic temperature rise, by linear interpolation between ln σ and l/T, where σ is the flow stress and T the test temperature (Table 1). A cubic spline fit between ln σ and lne., was used to obtain the flow stress at smaller temperatures and strain rate intervals and strain rates sensitivity m using the constitutive equation
σ = Ke.m (2)
where e. is the strain rate, and K is a constant. As described by Prasad et al.9, two dimensional power dissipation maps at different strains
were generated by plotting the efficiency of power dissipation (η). Where η is given by
1 2 m
m
h= + (3)
Regimes of flow instabilities were established using the con-tinuum instability criterion given by
(4)
In this inequality, the left hand side represents the dimension-less instability parameter ξ(e),. a negative value of which indicates unstable flow behavior.
3.1. Flow curves
The shape of stress-strain curves is considered to contain some information related to the mechanisms of hot deformation10. For
example, flow-softening type of stress-strain behavior with an initial peak stress oscillation is taken to suggest dynamic recrystallisation (DRX). However, similar behavior can also be due to flow instability.
Likewise, DRX can occur in cases where the behavior is steady state11.
The occurrence of the flow softening by the mechanism of dynamic recovery is reported to be predominant, although there is also some evidence of dynamic recrystalization (DRX). At sufficiently high temperature, DRX is initiated at some critical stress (σc) attained at critical strain (ec).
As a flow-softening phenomenon, DRX leads to a decrease in flow stress with increasing strain. It does not occur immediately after the critical stress has been attained. Beyond this critical point, the stress continues to increase until the softening due to the progress of DRX balances the continuing strain hardening in the uncrystallized parts of the material. This balance is manifested by the peak stress (σp) attained at the strain (ep)12. The major experimental difficulty in
detecting the onset of DRX is that attainment of the critical stress does not reveal itself in the flow curve. Although the flow stress peaks in constant strain rate deformation are good indications that DRX is well underway; they do not provide information about the onset of DRX.
The flow curves obtained for Mg composite deformed in com-pression at 400 °C at different strain rates ranging from 0.001 s-1 to
1.0 s-1 are presented in Figure 1a. At higher strain rates of 1.0 s-1 with
increasing strain, the flow curve exhibits an initial rapid increase to a peak value of 100 MPa and reaches a steady state independent of further strain. This behavior of the flow curve is an indication of DRX or flow instability. This can be confirmed by material modeling and micro-structural observations. The flow stress increased with an increase in strain rate. The flow stress is significantly low & reaches a value of 34 MPa at lower strain rate 0.001 s-1 where as the work
hardening is relatively high. Hence, the flow stress is found to increase with increase in strain. At the lower strain rates, the deformation is isothermal but at high strain rates it is adiabatic12. The steady state
Table 1. Flow stress values for Mg + 4.5%Ti composite at various strains,
strain rate and temperatures.
Strain rate s-1 Strain Flow stress (in MPa) of different
temperature
300 °C 350 °C 400 °C 450 °C 500 °C
0.001 0.1 70 57.4 34.3 23.8 11.2
0.2 53.9 56.7 28 19.6 11.2
0.3 67.2 59.5 32.9 22.4 11.2
0.4 67.9 59.5 35 23.1 11.2
0.5 68.5 56 34 23 11.2
0.01 0.1 82.6 65.8 44.1 31.5 23.8
0.2 80.5 60.9 39.2 30.1 21.7
0.3 88.2 72.1 43.4 32.9 24.5
0.4 82.6 68.6 44.1 32.9 25.2
0.5 80.8 68 43.8 35.3 26.1
0.1 0.1 120.4 98.7 61.6 46.9 32.9
0.2 102.2 88.9 62.3 46.2 27.3
0.3 121.8 100.1 71.4 51.1 30.8
0.4 123.2 107.1 67.2 49 32.2
0.5 122.2 103 61 44 34.3
1 0.1 144.2 114.8 94.5 74.13 48.3
0.2 138.6 121.1 94.5 72.8 44.1
0.3 152.6 121.1 107.8 82.6 51.8
0.4 151.2 122.2 103.6 79.8 50.4
flow curve at the lower strain rate and temperature represents dy-namic recovery. Dydy-namic recrystallization is associated with single peak or multi peak flow curves at comparatively higher strain rates and temperature13.
The true stress-true strain at the different temperatures and at 0.001 s-1 strain rate is shown in Figure 1b. The true stress increases
to a peak value of 70 MPa and then falls to a value of 62 MPa (11% reduction) suggesting flow softening has occurred at 300 °C. The flow stress decreased with an increase in temperature suggesting flow hardening is more pronounced at the lower temperature. This flow hardening is due to the combined effect of dislocation and grain growth reported by Xia et al.14 and Veh et al.8.
Ryan and McQueen observed that the presence of a stress peak in a constant strain rate flow curve leads to an inflection in the stress dependence of the strain hardening rate, is given by: θ = (∂σ/∂e). On the basis of considerations of irreversible thermodynamics, the inflec-tions in (θ-σ) plots of Mg/Ti composite were shown in Figure1c.The strain hardening rate decreases as temperature increases, the critical
True strain
T
rue stress (MP
a)
100
90
80
70
60
50
40
30
20
10
0 0.05 0.1 0.15 0.2 0.25 0.3 0.35 0.4 0.45 0.5 1/s
0.1/s
0.01/s
0.001/s
(a)
34 46 47 49 51
True stress, MPa
Strain hardening rate (ln
Q
), MP
a
300
250
200
150
100
50
0
400 Degree 450 Degree
(c)
True strain
T
rue stress (MP
a)
0 0.05 0.1 0.15 0.2 0.25 0.3 0.35 0.4 0.45 0.5 80
70
60
50
40
30
20
10
0
300 °C
350 °C
400 °C
450 °C
500 °C
(b)
0.1 0.2 0.3 0.4
True strain
Strain hardening rate(ln
Q
), MP
a 400 Degree, 0.1/s
450 Degree, 0.1/s 6
5
4
3
2
1
0
(d)
Figure 1. Flow curves of Mg composite for different: a) Strain rates at a constant temperature of 400 °C; and b) Temperature and at constant strain rates 0.001 s-1.
Strain hardening rate plots for Mg/4.5%Ti composites, effect of temperature on: c) Strain hardening rate; and d) critical strain at the onset of DRX.
stress is 49 MPa and 46 MPa at 400 °C and 450 °C respectively. It serves as an indication for DRX in the corresponding hot working conditions.
The ln θ-e plot should also exhibit an inflection at the onset of DRX are shown in Figure 1d critical strain is 0.2 and 0.3 at 450 °C and 400 °C respectively. Hence, DRX is initiated at 49 MPa and attained at 0.3, which is known as critical stress and critical strain.
3.2. Interpretation of processing maps
Several atomistic mechanisms that cause micro-structural damage during hot working are modeled by Raj with the aim of calculating the limiting conditions of temperature and strain rate for their occurrence. The processing maps can be interpreted on the basis of the broad prin-ciple of atomistic mechanisms represented in Raj maps15. According
these two damage processes is termed as being safe for hot working. The upper strain rate limit for this regime is set by the formation of adiabatic shear bands. In the safe regime, two processes namely a) dynamic recovery occurs at lower strain rates and temperatures and b) dynamic recrystallisation occurs at higher temperatures and strain rates. The different domains exhibited by the power dissipation maps can be identified on the basis of the corresponding efficiency varia-tions of micro-structural features16.
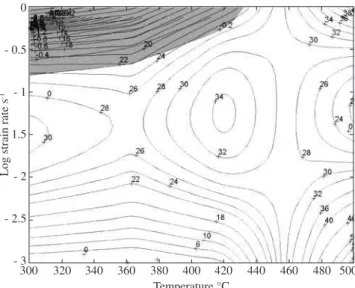
The power dissipation map obtained at a strain of 0.3 is shown in Figure 2, which is an iso-efficiency contour map exhibiting the varia-tion of efficiency of power dissipavaria-tion as a funcvaria-tion of strain rate and temperature. The processing map exhibits the following features.
1. A domain occurring in the temperature range 350-450 °C and in the strain rage range 0.01-0.1 s-1 with a peak efficiency of
34% at 430 °C and at 0.01 s-1;
2. A change in curvature of the contours occurring at 300-450 °C and in the strain rate range 0.001-0.01 s-1 and similar type of
contour found at strain rate range 0.1 to 1 s-1; and
3. The instability map was developed based on the continuum criterion gives by Equation 4 the regions of map where ξ((e). is negative represents unstable flow. The variation of instability parameter ξ((e). as a function of temperature and strain rate at a strain of 0.3 shows a negative value at 300-420 °C and in the strain rate range 0.1-1 s-1 specified as shaded region in
the map.
4. Micro Structural Behavior
The flow stress behavior of the metal-matrix composites is gov-erned by two main processes: a) the transfer of load from the ductile matrix to the hard particles; and b) the micro-structural transforma-tions such as recrystallization or damage phenomena. In this case the material presents decohesion at the matrix-particles interfaces or particle cracking. When the material is able to dissipate the provided power either through load transfer or metallurgical transformation, it does not reach a level high of damage16-18.
According to Srivatsan et al.19, damage induced by crucial
strain-ing of the MMCs can be described to the conjoint influences of (1) Damage associated with the discontinuous reinforcements, such as separation of the reinforcing from the matrix (2) lattice damage
such as dislocation and point defects in conjunction with residual stress effects.
Gourdet and Montheillet20 stated that light metal alloys exhibit
very high rates of dynamic recovery, which is generally expected to completely inhibit dynamic recrystallization. However, the formation of new grains during hot deformation of the light metal alloy has been frequently reported. Three types of dynamic recrystallization are likely to produce such a microstructure i) discontinuous dynamic recrystallization (DDRX), i.e. the classical recrystallization, which operates by nucleation and grain growth; ii) continuous dynamic recrystallization (CDRX), which involves the transformation of low angle boundaries into high angle boundaries; and iii) geometric dynamic recrystallization (GDRX), generated by the fragmentation of the initial grains. Discontinuous dynamic recrystallization, which is commonly observed in low stacking fault energy metals, remains exceptional in light metal alloys.
Sivakesava and Prasad21 stated that Mg-Li-Al alloy does not
exhibit dynamic recrystallization (DRX) even in a wide tempera-ture–strain rate range. This may be due to the high rate of diffusion, which will not permit the formation of DRX nuclei because of an annihilation of dislocations by faster recovery processes. However, Cho et al.22 who worked on Al, Mg alloys have observed DRX and
concluded that the DRX grain size increases with a decrease in the Zener – Hollomon parameter, i.e., at the high temperature and low strain rate.
Figure 3 shows microstructure of as-cast magnesium composite, in which Ti particles are distributed through the Mg Matrix. Micro-structure analysis shows a recrystallized Micro-structure at 400 °C and 0.1 s-1 in Figure 4. This is the result of nucleation and grain growth,
where grains are formed around the reinforcing particle, the DRX microstructure revealed dynamically recrystallized grains. The grain boundaries were irregular and wavy in nature. Hence, this domain represents the DRX process.
Similar Dynamic recrystallization was also observed at 450 °C at a strain rate of 0.1 s-1 which is shown in Figure 5. DRX has been
considered in terms of a) rate of interface nucleation and b) the rate interface growth. Rate of interface formation depends on the rate of dislocation generation and the probability of their recovery, result-ing in the formation of sub-grains which on continued deformation, forms a large angle grain boundary that can migrate. The formation of a interface is enhanced due to the high rate of generation of
dislo-Figure 2. Power efficiency and dissipation map calculated at strain value of
e = 0.3: the shaded area represents the zone of unstable flow predicted by
Equation 4.
Figure 3. Microstructure of as-cast Mg + Ti composite.
0
- 0.5
- 1
- 1.5
- 2
- 2.5
- 3
Log strain rate s
-1
cations caused by the hard particles. This causes the formation and presences of fine substructures.
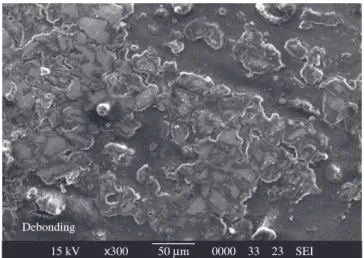
During testing of Mg + 4.5%Ti at 400 °C and 1.0 s-1 it is evident
the particle debonding is due to interfacial failure. Magnesium matrix is seen sticking to the surface of the particle. A gap between the matrix and the particle is also seen. This implies that the bonding between the particles and the matrix is weak which is shown in Figure 6. It is observed that at 300 °C and 1.0 s-1, the Mg + 4.5%Ti revealed fractured
Ti particles, which has microscopic cracks in it. These cracks might lead to the fracture of the titanium particle. This is shown in Figure 7. At the lower temperature 300 °C and at high strain rate 1.0 s-1 the
particles lead to greater stress concentration and breakage.
5. Conclusions
The hot deformation characteristics of Magnesium + 4.5%Ti composite have been studied in the temperature range 300-500 °C, and in the strain rate range 0.001-1 s-1 using processing maps. The
following conclusions are drawn from this investigation:
1. The composite exhibits Dynamic recrystallization at 400 °C and 0.1 s-1 which are the optimum condition for hot working
of the material;
2. The behavior of flow curve at 400 °C and at 0.1 s-1 with single
peak curve indicates Zone of Dynamic recrystallization;
3. Processing Map indicates DRX zone in the temperature range 360-450 °C and at strain rate 0.01-0.1 s-1 and instability zone
in the temperature range 300-420 °C and at strain rate 0.1-1 s-1; and
4. At temperature range of 300 °C to 420 °C and at strain rate 0.1 to 1 s-1 the material exhibits flow instability manifesting as
particle debonding, matrix cracking and particle cracking.
Acknowledgment
The authors from Annamalai University are grateful to All India Council For Technical Education for sponsoring the research under TAPTEC scheme (F.Nº: AICTE/TAPTEC/8020/RDII) and National University of Singapore for having supplied the composite mate-rial.
References
1. Soon LP, Gupta M. Synthesis and recylability of a magnesium based composite using an innovative disintegrated melt deposition technique. Journal of Material Science Technology. 2002; 18(5):92-98.
2. Xia XX, Sakaris P, McQueen HJ. Hot Deformation, Dynamic Recovery
and Recrystallization Behavior of Aluminium 6061-SiCp Composites.
Journal of Materials Science and Technology. 1994; 16(8):487-496.
Figure 5. Microstructure in the DRX domain of 0.1 s-1 and at 450 °C.
Mg
Ti
20 µm
Figure 7. SEM image of particle breakage observed at 300 °C, 1.0 s-1.
Figure 4. Microstructure in the DRX domain of 0.1 s-1 and at 400 °C. Figure 6. SEM image of debonded particle observed at 400 °C, 1.0 s-1.
Debonding
3. Cerri E, Spigarelli S, Evangelista E, Cavaliere P. Hot deformation and
processing maps of a particulate reinforced 6061Al+20%Al2O3 composite.
Journal of Material Science and Engineering. 2002; A324:157-161.
4. Sellars CM, Tegart WJMcG. Relation between strength and structure in
hot deformation. Journal of Material Science and Engineering. 1966;
63:731-746.
5. Venugopal S, Mannan SL, Prasad YVRK. Influence of state of stress on the processing map for hot working stainless steel type AISI 304L:
Compression Vs Torsion. Journal of Material Science and Engineering.
1993; 160:63-69.
6. Cavaliere P, Cerri E, Leo P. Hot working and processing maps of a
par-ticulate reinforced 2618/Al2O3/20p metal matrix composite. Journal of
Composites science and Technology. 2004; 64:1287-1291.
7. Semiatin SL, Jones JJ. Formability and workability of metals: plastic
insta-bility and flow localization. Metals Park, OH: ASM. 1984; 17(3)156-162.
8. Veh MS, Weng WP, Chuang TH. Plastic Flow Behavior during the Forging
of Al/10%Al2O3 (P) Composite. Journal of Metals and Material
Transac-tions A. 2000; 31:1310-1317.
9. Prasad YVRK, Sasidhara S, editor(s). Hot working guide: a compendium
of processing maps, Warrendale. PA: ASM; 1999; p. 125-157. 10. Ganesan G, Raghukandan K, Karthikeyan R, Pai BC. Formability study on
Al/SiC composites. Journal of Materials Science Forum. 2003;
437:227-230.
11. Radhakrishna bhat BV, Mahajan YR, Prasad YVRK. Effect of Volume
Fraction of SiCp Reinforcement on the Processing Maps for 2124 Al
Matrix Composites. Journal of Metallurgical and Materials Transactions
A. 2000; 31:629-639.
12. Poliak EI, Jonas JJ. Initiation of Dynamic Recrystallization in Constant
Strain Rate hot Deformation. ISIJ International. 2003; 43:684-691.
13. Venugopal S, Mannan SL, Prasad YVRK. Optimization of Hot
Work-ability in Stainless Steel Type AISI 304L using Processing Maps. Journal
of Metallurgical and Materials Transactions A. 1992; 23:3093-3103.
14. Xia XX, Hugh J, Queen Mc, Sakaris P. Hot Deformation Mechanism in
a 10% Al2O3 Particle Reinforced 6061 Al Matrix Composite. Journal of
Scripta Metallurgica Materialia. 1995; 32:1185-1190.
15. RAJ R. Development of a processing map for use in warm-forming and
hot-forming process. Journal of Metallurgical and Materials Transactions
A. 1981; 12A:1089-1097.
16. Ganesan G, Raghukandan K, Karthikeyan R, Pai BC. Development of
processing map for 6061 Al/SiCp composite material. Journal of Material
Science and Engineering A. 2004; 369:230-235.
17. Cerri E, Spigarelli S, Evangelista E, Cavaliere P. An analysis of hot
formability of the 6061+20%Al2O3 composite by means of different
stability criteria. Journal of Material Science and Engineering A. 2002;
327:144-154.
18. Hoffmanner AL. The use of workability test results to predict processing
limits, metal forming; inter relation between theory and practice. New York: Plenum Press. 1961:349-391.
19. Srivatsan TS, Soboyego WO, Lederich RJ. Tensile Deformation and
Fracture Behavior of a Ti-Alloy MMCs. Journal of Composites A. 1997;
28:365-376.
20. Gourdet S, Montheillet F. An Experimental Study of the Recrystallization
Mechanism during Hot Deformation of Aluminium. Journal of Material
Science and Engineering A. 2000; 283:274-288.
21. Sivakesavam O, Prasad YVRK. Characteristics of Super plasticity Domain in the Processing Map for Hot Working of As-Cast Mg–11.5Li–1.5Al
Alloy. Journal of Material Science and Engineering A. 2002;
323:270-277.
22. Cho JR, Bae WB, Hwang WJ, Hartely P. A Study on Hot Deformation
Behavior and Dynamic Recrystallization of Al-5% Mg Alloy. Journal of