Structural Evolution and Electrical Properties of BaTiO
3Doped with Gd
3+Juan Pablo Hernández Laraa, Miguel Pérez Labraa*, Francisco Raúl Barrientos Hernándeza, Jose Antonio
Romero Serranob, Erika Osiris Ávila Dávilac, Pandiyan Thangarasud, Aurelio Hernández Ramirezb
Received: August 19, 2016; Revised: January 10, 2017; Accepted: February 02, 2017
BaTiO3 doped with Gd3+ (Ba
1-xGdxTi1-x/4O3) was synthesized using the solid-state reaction method
with x = 0.001, 0.003, 0.005, 0.01, 0.05, 0.1, 0.15, 0.20, 0.25, 0.30, and 0.35 Gd3+ (wt. %). The powders
were decarbonated at 900 °C and sintered at 1400 °C for 8 hours. The tetragonality of the synthesized Gd3+-doped BaTiO
3 particles was analyzed. XRD patterns and Raman spectra revealed that the crystal
phase of the obtained particles was predominately tetragonal BaTiO3; the intensity of the Raman bands at 205 cm−1, 265 cm−1, and 304 cm−1 decreased when Gd3+ was increased. A secondary phase (Gd
2Ti2O7)
was found when the Gd3+ content was higher than 0.15 wt. %. The capacitance of the sintering pellets
was measured at 1 kHz; these values were used to calculate the relative permittivity, the maximum permittivity values were recorded for the samples with x = 0.001, 0.005, and 0.1.
Keywords: Gd3+, BaTiO
3, Dielectric
* e-mail: [email protected]
1. Introduction
BaTiO3 (BT) is a ferroelectric material with a characteristic tetragonal distortion of the cubic perovskite structure. The ferroelectric (tetragonal) phase gets converted to paraelectric (cubic) phase at the Curie temperature (Tc) at ~ 120 °C for single-crystals. However, Tc for polycrystalline BT will shift to lower values due to the metastable cubic phase at temperatures below 120°C. The ferroelectric distortion is facilitated by the large size of the Ba cation. The ferroelectric property owes its origin to a displacement of the Ti atoms and
the efect is very sensitive to interatomic distances (lattice
parameter). Among the most important properties that can be presented to highlight both its chemical and mechanical stability is its ferroelectric properties at room temperature considering its use as a polycrystalline ceramic1. BT is widely
used in the manufacture of piezoelectric devices, electro-optical elements, ceramic capacitors, and resistors due to its high dielectric constant and semiconducting properties when
they are modiied using aliovalent or isovalent dopants2.
The high dielectric constant allows smaller capacitive
components, thus ofering an opportunity to reduce the size
of electronic devices3,4. The understanding of how these
particular crystalline structures evolve from the tetragonal perovskite structure might provide a way to engineer more compounds with hexagonal structure.
It is known that an appropriate amount of doping into the BT can improve the structural, optical, and electrical properties of the system4-7. Doping has been studied by several
authors7,8 and it was shown, for example, that the positive
temperature coeicient of resistivity (PTCR) efect in BaTiO3
doped with donors (when the substitution occurs at Ba sites)
can be signiicantly increased by adding small amounts of
dopants. This additional doping leads to an increase of the
ρmax/ρmin ratio (ρ is the electric resistivity) which is the
most important feature to be applied. Even more, the dopants
can inluence the temperature of the ferroelectric phase transition (Tc). The investigation of the dopants’ efects plays
a decisive role in understanding the nature and in optimizing the properties of BaTiO3 ceramics. Manjit Borah9 report the
structural, optical and dielectric characterization of solid state derived, pseudo-cubic nanoscale barium titanates with gadolinium (Gd3+) as substitutional dopant. It was found
that the dielectric constant showed a decreasing tendency with doping content when the Gd-doping level was varied between 0 –7 %.
As a lanthanide element, Gd exhibits unusual metallurgical
properties, apart from its signiicant use in magnetic resonance
imaging (MRI). The inclusion of Gd into the pseudo-cubic host lattice of BT is rarely found in the literature. The main goal of this work was the investigation of structural evolution and electrical properties of BaTiO3 ceramics doped with
a Academic Area of Earth Sciences and Materials, Autonomous University of Hidalgo State, Road
Pachuca- Tulancingo Km 4.5 Mineral de la Reforma Zip Code 42184, Hidalgo México
b Metallurgy and Materials Department, ESIQIE-IPN. UPALM, Zacatenco, Zip Code 07738, México c Mechanical Engineering Department, Technological Institute of Pachuca, Road México-Pachuca km.
87.5 Pachuca de Soto Zip Code 42080, Hidalgo, México
d Circuito interior s/n Facultad de Química Edif. F Lab. 114 Ciudad Universitaria UNAM México D. F.
Gd3+ varied within 0.001, - 0.35 Gd3+ (wt. %) using the
solid-state reaction method.
This method is an important technique in the preparation of polycrystalline solids. A solid state reaction, also called dry reaction mixture of oxides, is a chemical reaction in which no solvents are used. The advantages of this method (compared to other techniques) are mainly economic and, hence, large scale production is frequently based on solid-state reactions of mixed powders.
2. Experimental
Samples of BT doped with Gd3+ were prepared according
to the formula Ba1-xGdxTi1-x/4O3 using the solid-state reaction method by grinding BaCO3 (Sigma-Aldrich, CAS No. 513-77-9, 99.9%), TiO2 (Sigma-Aldrich, CAS No. 13463-67-7, 99.9%), and Gd2O3 (Sigma-Aldrich, CAS No. 278513-25G, 99.9%) in an agate mortar, with acetone as a control medium and x = 0.001, 0.003, 0.005, 0.01, 0.05, 0.1, 0.15, 0.20, 0.25, 0.30, 0.35 Gd3+ (wt. %)
The precursor powders (BaCO3, TiO2 and Gd2O3) were dried at 200 °C, before weighing. The powder mixture was placed in an alumina boat then decarbonated at 900 °C overnight, and later was reground for 10 min in an agate mortar. After that, the powder mixtures were sintered in a
platinum crucible at 1400 °C for 8 hours using a mule furnace
(Thermolyne model 46200). The purity of the products was
monitored by X-ray difraction (Difractometer Inel Equinox 2000 Cu Kα, radiation of λ =0.15418nm).
Once the powders were obtained for each composition pellets were manufactured for each composition. The powder mixtures were regrounded again and later compacted using
uniaxial pressing at 250 MPa in an 8-mm stainless steel
die to produce green pellets of 3 mm thickness. The pellets were sintered at 1400 °C for 5 hours in air atmosphere with heating and cooling rates of 5 °C/min. They were grounded with silicon carbide abrasive paper, polished with slurry of alumina and later cleaned in an ultrasonic bath. The morphology studies were performed in a JEOL 6300 SEM, 15kV, WD 8.1mm. Electrical measurements were performed on an LC Meter Analyzer (ELC-3133A LCM Escort), at 1 KHz. Additionally, Raman studies were carried out for
each powder samples using a Perkin Elmer Spectrum Gx
spectrophotometer, (Überlingen, Germany), with neodymium laser (1064 nm) excitation.
3. Results and discussion
3.1 X-Ray difraction
Owing to the diference in efective ionic radii between
gadolinium and titanium (r(Gd3+) = 1.00 Å, r(Ti4+) = 0.605
Å)10 the lattice will expand to some extent.
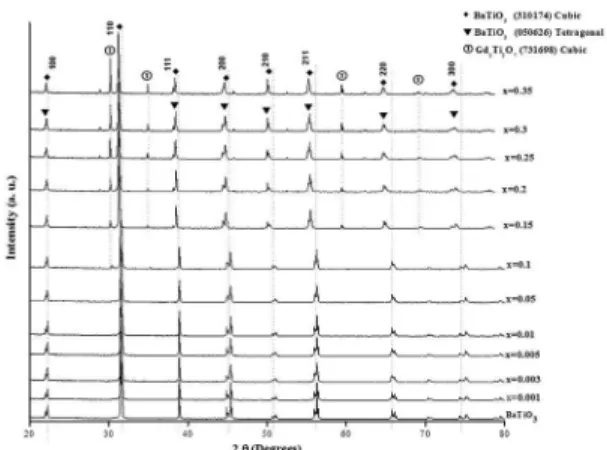
This may be one of the reasons why the XRD relections shift to lower angles (Figure 1 and Figure 2) at 2θ = 65.7 and x ≥ 0.15 after sintering at 1400 °C, this is similar to
reported by Barrientos et al.11.
It can be seen from Figure 1 that the difractograms show a double peak at 2θ ≈ 45, indicating the presence of tetragonal ferroelectric phase (JCPDS 050626) for the difractograms
when Gd3+ content 0.001 ≤ x ≤ 0.3. This phase disappears for
the sample with Gd3+ content x = 0.35, however, a secondary
phase (Gd2Ti2O7) (JCPDS 731698) was found when the Gd3+ content was higher than 0.15, as observed in the peak
2θ ≈ 32. The Gd2Ti2O7 phase was identiied for 0.001 ≤ x
≤ 0.35. Parida et al.12 studied a series of Gd
2Ti2O7/GdCrO3
composites prepared by the solid state combustion method using Gd(NO3)3, TiO2, Cr2O3 as metal sources and urea as a
fuel. Parida et al. have found the Gd2Ti2O7 phase, whereby the
main peaks matched the secondary phase found in this work.
3.2 Raman Spectroscopy
Raman spectroscopy (RS) was used to study the phase transition of Gd3+-doped BaTiO
3 ceramics. RS is a spectroscopic
technique used to observe vibrational, rotational, and other low-frequency modes in a system7. Figure 3 shows the Raman
spectra for BaTiO3 doped with several Gd3+ concentrations
prepared by the solid-state reaction. The graphs show the characteristic Raman peaks at room temperature of BaTiO38,13,14 located at 205 cm-1 (E(TO + LO), A1(LO)),
265 cm-1 (A1(TO)), 304 cm-1 (B1, E(TO + LO)), 513 cm-1
(A1(TO), E(TO)) and 717 cm-1 (A1(LO), E(LO)). Similar
bands were observed in BaTiO3 based ceramics by Suchanicz et al.13 and Pokorny et al.14. An extra band was observed
at 833 cm-1 whose intensity was proportional to the Gd3+
concentration. This high-frequency mode (above 700 cm-1)
can be caused by the vibrations resulting from the shift of oxygen and also correlated to present of oxygen vacancies, Suchanicz et al.15. On the other hand, was observed that this
extra band occurs when Gd3+ content was Gd 0.01≤ x ≤ 0.35,
which was coherent with the appearance of the secondary phase Gd2Ti2O7 (see Figure 1). Barrientos et al.11, in a study
of the structural evolution of hexagonal phase Ba8Ti3Nb4O24 by adding Nb2O5 to perovskite BaTiO3, associated the appearance of an extra band around 743 cm-1 and 830 cm-1
with the presence of the secondary phase Ba8Ti3Nb4O24,
equally identiied by XRD. When the dopantconcentration in BaTiO3 is enough to cross through the tetragonal–cubic phase transition point, all the active Raman modes in the
tetragonal phase (P4 mm) are inactive in the perfect cubic phase (Pm3 m) according to forbidden Raman selection rules.
However, the broad A1 (TO) band at 513 cm-1 persisted into
the cubic phase above Tc, which was attributed to intrinsic disorder in the cubic phase, and it becomes broad and weak with increasing Gd3+ content16. A dramatic change at low
Figure 1: XRD difractograms for Ba1-xGdxTi1-x/4O3 powders sintered
at 1400 °C for 8 h for diferent values of x.
Figure 2: XRD difractograms for Ba1-xGdxTi1-x/4O3 powders sintered
at 1400 °C for 8 h for diferent values of x. Zoom at 64–67°
Figure 3: Raman spectra of powders sintered at 1400 °C, 0 ≤ x ≤ 0.3.
Raman peak around 304 cm-1 showed a decrease in intensity.
This diminution was attributed to the decrease of tetragonality of BT ceramics. The phase transformation was observed in DRX results when Gd3+ content was x ≥ 0.35 (Figure 1) and
dielectric measurements.
3.3 Electric Properties
Platinum paste was painted on opposite surfaces of the
pellets to form electrodes; a thin platinum strip was applied to the platinum electrodes to act as a contact. Figure 4 shows the results of relative permittivity (k) obtained at 1 kHz for
the compositions prepared in the range of 0 ≤ x ≤ 0.35. The
maximum permittivity values were recorded for the samples with x = 0.001, 0.005, and 0.1. It has been reported9 that
the dielectric constant showed a decreasing tendency with doping content and with increasing frequency for pseudo-cubic nanometric barium titanate doped with gadolinium (Gd3+) where the doping level was varied between 0–7 %.
However, it was also determined that in the low-frequency
region, the loss tangent (tan δ), which is the combined result
of orientational polarization and electrical conduction, was found to be quite high in the doped samples as compared to their un-doped counterpart. In this study only results obtained at 1 kHz were reported.
The maximum value of k was registered for the sample with x = 0.001 (10474.35). The main Curie peak shift from 112 °C to 76 °C indicated that the cubic phase was becoming more stable. Furthermore, the compositions x = 0.25, x = 0.2, x = 0.3 and x = 0.35 showed Curie temperature values of 83 to 65 °C with permittivity values of 5319, 4364, 3529, and 3174 respectively. However, the low intensity and width of the peaks indicated a mixture of phases.
3.4 Morphology and microstructure
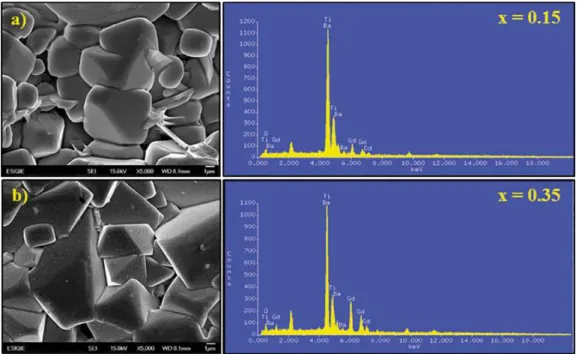
Figure 5 shows SEM- EDS images of Gd3+-doped BaTiO 3
sintered at 1400 °C for the samples with x = 0.15 and x = 0.35, which consisted of rounded grains with a wide grain-size distribution visually observed from SEM images; grain sizes of 1.8– 8.4 mm for x = 0.15 (Figure 5a), and 3.2–11.2 mm for x = 0.35 (Figure 5b). The presence of Gd can be observed in the EDS spectrum. The SEM images of the samples indicated that Gd3+ does not drastically inluence
the microstructure.
Figure 5: SEM-EDS micrographs of BaTiO3, doped with diferent Gd
3+. a) x= 0.15, and b) x= 0.35.
All of the samples revealed comparable grain sizes. A relatively homogeneous microstructure with higher amounts of inter-granular porosity was also observed; this may due to the behavior of Gd3+ in the BaTiO
3 ceramics.
In the detailed image (Figure 6), this characteristic can be observed11.
A summary of semiquantitative compositions obtained by SEM-EDS for all samples is shown in Table 1. The EDS investigations showed that the ceramics BaTiO3 + x wt. % Gd3+ (0.001 ≤ x ≤ 0.35) contained Ba, Ti, O, and Gd elements
near their surfaces. No other elements were detected. It was noted that the content of Gd increased as x increased. On the contrary, with x content increasing, the Ba and Ti contents decreased. This can be explained by the amphoteric behavior of BaTiO3 17, e.g. BaTiO
3 behaves as
Figure 6: SEM micrograph detail of Gd3+ doped BaTiO 3, x = 0.15.
Table 1: Semiquantitative chemical compositions (SEM-EDS) of
powders sintered at 1400 °C, 0 ≤ x ≤ 0.35 (wt.%).
Sample Wt. (%)
Ba Ti O Gd
BaTiO3 68.46 25.31 6.22 0
x = 0.001 65.64 23.98 10.31 0.07
x = 0.003 61.41 21.93 16.41 0.25
x = 0.005 61.87 20.13 17.66 0.34
x = 0.010 58.03 20.51 20.74 0.72
x = 0.050 54.38 21.15 21.75 2.72
x = 0.100 50.81 22.74 13.03 13.42
x = 0.150 48.68 19.33 15.85 16.14
x = 0.200 46.64 19.22 9.83 24.31
x = 0.250 41.01 19.14 12.83 27.02
x = 0.300 38.88 19.01 12.37 29.74
x = 0.350 36.02 19.11 10.92 33.95
an acceptor when the Ti site is substituted or as donor when the substitution occurs at the Ba site.
Yongping et al.17 reported that the thermodynamic
conditions, such as the partial pressure of oxygen in the sintering atmosphere and temperature, play an important part in the distribution of rare earth elements with amphoteric behavior in the A or B sites of BaTiO318,19.
4. Conclusions
BaTiO3 doped with Gd3+ (Ba
1-xGdxTi1-x/4O3) with x
and electric measurements. A double peak at 2θ ≈ 45 was conirmed by XRD, indicating the presence of a tetragonal ferroelectric phase for the difractograms when the Gd3+
content was 0.001 ≤ x ≤ 0.3. This phase disappeared for
the sample with Gd3+ content x = 0.35. A secondary phase
(Gd2Ti2O7) was found when the Gd3+ content was higher
than 0.15, as was observed in XRD at 2θ ≈ 32. Gd2Ti2O7
phase was identiied for 0.001 ≤ x ≤ 0.35. The Raman results
showed the characteristic Raman peaks of the tetragonal ferroelectric phase of BaTiO3 located at 205 cm-1 (E(TO +
LO), A1(LO)), 265 cm-1 (A1(TO)), 304 cm-1 (B1, E(TO +
LO)), 513 cm-1 (A1(TO), E(TO)), and 717 cm-1 (A1(LO),
E(LO)). The maximum permittivity values were recorded for the samples with x = 0.001, 0.005, and 0.1. The extra
band observed 0.01≤ x ≤ 0.35 (833 cm-1) was coherent with
the appearance of the secondary phase (Gd2Ti2O7) observed equally by DRX.
The incorporation of Gd3+ ions into the BT system could
greatly manifest dielectric properties and can ind immense
scope in electronic elements including ceramic capacitors.
5. Acknowledgment
The authors are grateful to CONACyT-México for the
inancial support.
6. References
1. Jona F, Shirane G. Ferroelectric Crystals. Mineola: Dover
Publications; 1993.
2. Rae A, Chu M, Ganine V. Barium Titanate: Past, Present and
Future. In: Nair KM, Bhalla AS, eds. Dielectric Ceramic Materials. Westerville: The American Ceramic Society; 1999.
3. Jin S, Xia H, Zhang Y, Guo J, Xu J. Synthesis of CaCu3Ti4O12 ceramic
via a sol-gel method. Materials Letters. 2007;61(6):1404-1407.
4. Ali AI, Ahn CW, Kim YS. Enhancement of piezoelectric and ferroelectric properties of BaTiO3 ceramics by aluminum doping.
Ceramics International.2013;39(6): 6623-6629.
5. Abdelmoula N, Khemakhem H, Simon A, Maglione M. Structure
reinement, dielectric, pyroelectric and Raman characterizations
of Ba1−xLax(1−y)/2Euxy/2Nax/2TiO3 solid solution. Journal of Solid State Chemistry. 2006;179(12):4011-4019.
6. Yang Y, Liu K, Liu X, Liu G, Xia C, He Z, et al. Electrical properties and microstructures of (Zn and Nb) co-doped
BaTiO3 ceramics prepared by microwave sintering. Ceramics International. 2016;42(6):7877-7882.
7. Ueoka H. The doping efects of transition elements on the PTC
anomaly of semiconductive ferroelectric ceramics. Ferroelectrics. 1974;7(1):351-353.
8. Hiroshi Ikushima and Shigeru Hayakawa. Electrical Properties
of Ag-Doped Barium Titanate Ceramics. Japanese Journal of Applied Physics. 1965; 4 (5): 328-336
9. Borah M, Mohanta D. Efect of Gd3+ doping on structural,
optical and frequency-dependent dielectric response properties of pseudo-cubic BaTiO3 nanostructures. Applied Physics A. 2014;115(3):1057-1067.
10. Shannon RD. Revised efective ionic radii and systematic studies
of interatomic distances in halides and chalcogenides. Acta Crystallographica Section A. 1976;32(5):751-767.
11. Hernández FRB, Hernández IAL, Yáñez CG, Flores A, Sierra RC,
Labra MP. Structural evolution of Ba8Ti3Nb4O24 from BaTiO3
using a series of Ba(Ti1−5xNb4x)O3 solid solutions. Journal of Alloys and Compounds. 2014;583:587-592.
12. Parida KM, Nashim A, Mahanta SK. Visible-light driven
Gd2Ti2O7/GdCrO3 composite for hydrogen evolution. Dalton Transactions. 2011;40(48):12839-12845.
13. Suchanicz J, Świerczek K, Nogas-Ćwikiel E, Konieczny K, Sitko D. PbMg1/3Nb2/3O3-doping efects on structural, thermal,
Raman, dielectric and ferroelectric properties of BaTiO3 ceramics.
Journal of the European Ceramic Society. 2015;35(6):1777-1783.
14. Pokorný J, Pasha UM, Ben L, Thakur OP, Sinclair DC,
Reaney IM. Use of Raman spectroscopy to determine the site occupancy of dopants in BaTiO3. Journal of Applied Physics. 2011;109(11):114110.
15. Suchanicz J, Klimkowski G, Karpierz M, Lewczuk U, Faszczowy
I, Pękala A, et al. Inluence of Compressive Stress on Dielectric and Ferroelectric Properties of the(Na0.5Bi0.5)0.7Sr0.3TiO3 Ceramics.
IOP Conference Series: Materials Science and Engineering. 2013;49(1):012038.
16. Gardiner DJ, Graves PR, eds. Practical Raman Spectroscopy. Berlin, Heidelberg, New York: Springer-Velarg; 1989.
17. Yongping P, Wenhu Y, Shoutian C. Inluence of rare earths on electric properties and microstructure of barium titanate ceramics. Journal of Rare Earths. 2005;25(Suppl 1):154-157.
18. Zhi J, Chen A, Zhi Y, Vilarinho PM, Baptista JL. Incorporation of
Yttrium in Barium Titanate Ceramics. Journal of the American Ceramic Society. 1999;83(5):1345-1348.