borate glass was studied using the Photoluminescence spectrum. Determination and diferentiation of the
various vibrational modes were done using FTIR spectroscopy studies. Raman spectroscopy of Pr2O5 doped borate glass was also carried out. Thermal analyses of the glasses were done using the TGA/ DTA and DSC analysis. The dielectric properties such as dielectric constant, the dielectric loss and AC conductivity of the Pr2O5 doped borate glass were studied in the diferent frequencies and temperature.
Keywords: Pr2O5, XRD, Photoluminescence, FTIR, FT-Raman studies and Dielectric studies
1. Introduction
Rare earth ions have numerous attractive spectroscopic properties in glasses in connection with laser research1,2,
related applications3 and basic research4. The trivalent
rare earth ions are easily incorporated in glasses. Pr3+
doped glasses have transition in the visible region. Some spectral studies have been reported for Pr3+ doped borate
and phosphate glasses earlier5-16. Recent studies reported17
on the applications of Pr3+ doped borophosphate glasses.
In many optical devices like blue up-converters (3P 0 – 3H
4), solid-state lasers emitting visible ( 1D
2 – 3H
4) or
near-infrared light (1G 4 –
3H
5) praseodymium – doped
glasses are proved to be efective. In the present work,
we report the structural properties of the Pr2O5 doped
borate glasses that were determined by X-ray difraction
(XRD) analysis and FTIR and FT-Raman analysis. It was
conirmed that the prepared glasses were amorphous. The
bonding parameters of the glasses were analyzed by using
FTIR and FT Raman analysis and were conirmed to be
ionic in nature. The optical properties were characterized by using the photoluminescence studies. The electrical properties of Pr2O5 doped borate glasses were studied. Since being a member of Lanthanide, Prasuedomium
shows eicient luminescence in triplet state. Hence, the
prepared borate glass can be used for some applications like optical data reading, colour display etc.
2. Experimental Procedure
2.1. Preparation of Glass Samples
The Pr2O5 doped borate glass of composition [60.5B2O3+xLi2CO3 +xZno+xSr2O3 +xH6NO4P+x 1Y2O3
+ x 1 Pr2O5, (x in molecular % ranging from 10 to 50 and x 1 in molecular % of 0.5] was prepared by melt quenching method. The appropriate quantities of B2O3, Li2CO3, ZnO, Sr2O3, Y2O3 and Pr2O5 were weighed and
mixed together with a morter, to get ine powders. All
powders were taken in 99.99 % of purity. The batches were placed in a porcelin crucible and melted in electric furnace at 1300○C. After inishing the melting process, it transferred to a second furnace which maintained at 400 ○C for annealing. The annealing process continued for 3-4 hrs and the sample was gradually cooled under room temperature. The prepared glasses were polished
for performing diferent characterization.
3. Results and Discussion
3.1. XRD characterization
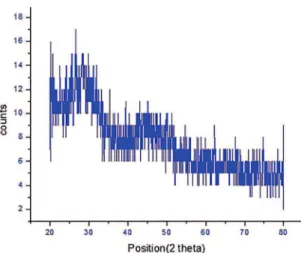
The X-ray difraction pattern of the prepared borate
glasses were recorded in the range of 20°- 80°. The results showed that the XRD pattern of the sample exhibited broad
difusion at lower scattering angles. It indicates the presence
of long range structural disorder, which is characteristic of
amorphous nature as shown in Figure 1. A broad difuse scattering at diferent angles instead of crystalline peaks are exhibited conirming a long range structural disorder
which is the characteristic of amorphous network.
3.2. Optical Properties
Figure 1: X-ray difraction pattern of the Pr2O5 (x=10 % and x 1 =
0.5 %) doped borate glasses.
wavelength etc. Figure 2 shows the excited spectrum of praseodymium doped borate glass . Weak features were displayed between 200 and 320 nm and single, strong band centered at 361 nm which indicates the lowest 4f-5d transition of Pr3+. In accordance with
previous studies of Pr3+, it happened due to the charge
transfer of Pr3+- O 2
- transition at shorter wavelengths18.
Figure 2: The excited spectrum of Pr2O5 (x=10 % and x 1 = 0.5
%) doped borate glass
The excited Pr3+ ions decay from 3P
j to ground
state by emitting radiations in visible or UV spectrum. Emission peaks were observed at 375 nm, 413 nm, 436 nm and 496 nm for an excitation of 260 nm shown in
igure 3. The observed reading agrees well with previous
studies19. These lines correspond to transitions like 3P 2
– 3H 4,
3P 0
-3H
4. It is found that, at a peak of wavelength
496 nm, the luorescence intensity gradually decreases
.The transition 3P 0
-3H
4 can execute Laser action with
blue colour. Hence the prepared glass can be used as a
blue up converter in Fibre Optic communication ield.
Figure 3: Emission spectrum of Pr2O5 (x=10 % and x 1 = 0.5 %) doped borate glass.
3.3. Spectral Analysis
3.3.1 FTIR analysis
Infra-red spectrum of borate glass doped with Pr2O5 in the range of 500 - 4500 cm – 1 is shown in Figure
4. In this region bands are connected with vibrations of borate network. Borate ring deformation (662 cm -1), BO
3 bending (791 cm
-1), stretching vibration of
tetrahedral BO4 group (950-1200 cm-1) are included
along with two absorption bands due to stretching of trigonal and tetrahedral BO4 (1200-1400 cm-1) and
the bending modes of OH groups (1700 cm-1). In this
spectrum, bending vibration occurs at lower frequencies than stretching vibration. The other absorption bands which are observed indicate weak transitions. The second broad band shows four lines appearing at 955, 1180, 1376 and 1159 cm-1, due to the P-O symmetric
(νs) and asymmetric (νas) stretching vibrations. The intensity of these lines increases with Pr2O5 content.
Figure 4: IR spectrum of Pr2O5 (x=10 % and x 1 = 0.5 %) doped
Figure 5: Raman spectrum of Pr2O5 (x=10 % and x 1 = 0.5 %) doped borate glass
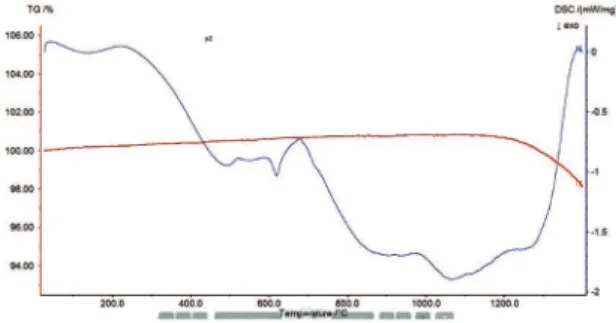
3.3.3. hermal analysis
Thermogravimetric analysis is a technique to assess the stability of various substances. Figure 6 shows the simultaneously recorded thermogravimetric analysis
(TGA) and diferential thermogravimetric analysis (DTA)
curve for Pr2O5 doped borate glass. The amorphous
nature of the glasses was conirmed using the TGA and
DTA curves. .The endothermic peaks corresponding to the glass transition (Tg) and exothermic peaks due to the crystallization (Tp) are observed. It allows concluding that melt - quenched samples are glasses. No appreciable weight loss was detected in the TGA measurements in the glass sample. The weight loss of
the irst step corresponds to water released in the sample
and other steps correspond to the decomposition of the samples which is shown in Figure 6. The lack of sharp
endothermic and exothermic peaks evidently speciies
the formation of homogeneous glass. Figure 7 shows
the diferential thermal analysis of the glasses under
investigation. The glass exhibits change due to the glass transition temperature Tg at 218˚C. It is also observed that, during higher temperature an exothermic peak Tc
formed at 677˚C due to the crystal growth, which is followed by a single sharp endothermic efect, due to the melting of the glass, as symbolized by Tm at 1200˚C.
Figure 7: DSC of Pr3+(x=10 % and x 1 = 0.5 %) doped borate glass.
3.4. Dielectric Studies
The dielectric properties of the Pr2O5 doped borate glass was measured using HIOKI 3532 - 50 LCR meter in the frequency ranging from 50 Hz to 5 MHz. The
frequency dependence of dielectric constant at diferent
temperatures is shown in Figure 8 (a). The dielectric constant decreases very rapidly at low frequencies and
then slowly, as the frequency increases and inally, it
becomes almost a constant at higher frequencies. The high value of dielectric constant at low frequencies may be associated with the establishment of polarizations namely; space charge, orientational, electronic and ionic polarization. Its low value at higher frequencies
is attributed due to the loss of signiicance of these
polarizations gradually. At high frequencies, normally orientation and space charge polarization exists. This behavior can be attributed to the applied electric
ield, which assists electron hopping between two diferent sites in glasses. The jump frequency of the
charge carrier becomes large and comparable with the
frequency of the applied ield at high temperatures.
At low frequency the charge carriers hop easily out of the sites with low free energy and tend to accumulate at sites with high free energy barriers. Hence a net polarization is developed and gives an increase in the dielectric constant and dielectric loss. However at high frequency, the charge carriers will not be able to rotate
suiciently, so their oscillation will begin to lay behind ield resulting in a decrease of dielectric constant and
Figure 8: (a & b) Dependence of dielectric constant/dielectric loss on various frequencies and temperatures
becomes smaller than the frequency of the applied
ield at low temperatures. The periodic reversal of the applied ield occurs so rapidly that excess charge carriers jumping in the ield direction is nil. The polarization
due to charge piling up at higher free energy barrier sites disappears, which causes a decrease in the values of the dielectric constant and the dielectric loss20-22. At
low frequencies all the mechanism of polarizations are active and with increasing frequency the contribution
from diferent polarizations start decreasing. As the
frequency increases the dipoles do not comply with
the varying external ield therefore decreasing the
value of dielectric constant at low frequency region. From Figure 8 (b), it is observed that the dielectric
loss decreases with increase in frequency at diferent
temperatures. The low value of dielectric loss suggests that the glasses are of moderately good quality. Thus the low value of dielectric loss at higher frequencies is important for extending the applications towards photonic, electro-optic devices.
The frequency dependence of the ac conductivity for various temperatures is shown in Figure 9. It is observed that the conductivity increases with increasing frequency. At a given temperature the conductivity is directionally
proportional to frequency conirming polaran hopping. From the igure we can observe that conductivity increases as the
temperature increases23. This increase in conductivity is
attributed to the reduction in the space charge polarization at higher frequencies. The poly-dispersive behaviour exhibited is proved by the frequency dependence of the
Figure 9: Variation of conductivity with frequency for glass.
ac conductivity. Further as the frequency decreases more and more charge accumulation occurs at the interface between electrode and electrolyte, and hence there is a drop in conductivity at low frequencies.
4. Conclusion
Pr2O5 doped borate glasses were prepared by the conventional melt quenching method. The XRD spectrum revealed that the Pr2O5 doped borate glasses were amorphous in nature. Photoluminescence properties of Pr2O5 doped borate glass were analyzed which proves that the prepared glass can be used as a blue up converter in Fibre Optic communication
ield. FTIR and FT Raman studies were carried out
of Pr2O5 doped borate glass. The disorder in the glass matrix results in the broadening of the obtained peaks. Thermal analyses of the glasses have been done to see the structure of the glasses. The variations of the dielectric constant, the dielectric loss and AC conductivity with frequency and temperature for Pr2Odoped borate glass were analyzed. The dielectric studies revealed that both the dielectric constant and the dielectric loss
decreased with an increase in the frequency at diferent
temperatures. The low value of dielectric loss suggests that the glasses are of moderately good quality. Also the low value of dielectric loss at higher frequencies is important for extending their applications towards photonic, electro-optic devices.
5. Acknowledgements
of Pr ions in phosphate glass. Chinese Optics Letters. 2015;13(10):101602.
6. Zhang F, Bi Z, Huang A, Xiao Z. Luminescence and Judd–Ofelt analysis of the Pr3+ doped luorotellurite glass. Journal of Luminescence. 2015;160:85-89.
7. Martins VM, Azevedo GA, Andrade AA, Messias DN, do Monte AFG Dantas NO, et al. Spatial and temporal observation of energy transfer processes in Pr-doped phosphate. Optical Materials. 2014;37:387-390.
8. Plaza JL, Aragó C. Characterisation of pure and Pr doped BiB3O6 glasses prepared under diferent thermal conditions. Journal of Alloys and Compounds. 2015;623:178-185.
9. Park JM, Kim HJ, Limsuwan P, Kaewkhao J. Luminescence property of rare-earth-doped bismuth-borate glasses with
diferent concentrations of bismuth and rare-earth material. Journal of the Korean Physical Society. 2012;61(2):248-253.
10. Pisarski WA, Pisarska J, Lisiecki R, Grobelny ł,
Dominiak-Dzik G, Ryba-Romanowski W. Luminescence spectroscopy of rare earth-doped oxychloride lead borate glasses. Journal of Luminescence. 2011;131(4):649-652.
11. El-Okr M, Farouk M, El-Sherbiny M, El-Fayoumi MAK, Brik MG. Spectroscopic studies of the Pr3+-doped
borovanadate glass. Journal of Alloys and Compounds. 2010;490(1-2):184-189.
Zamkov AV. Temperature dependencies of intensities of f–f transitions in Pr3+ and Dy3+ in glasses. Journal of Non-Crystalline Solids. 2002;306(2):120-128.
17. Sharma YK, Tandon SP, Surana SSL. Laser action in praseodymium doped zinc chloride borophosphate glasses. Materials Science and Engineering: B. 2001;77(2):167-171.
18. Belsky AN, Krupa JC. Luminescence excitation mechanisms of rare earth doped phosphors in the VUV range. Displays. 1999;19(4):185-196.
19. PrajnaShree M, Wagh A, Raviprakash Y, Sangeetha B, Kamath
SD. Characterization of pr6o11 doped zinc luoroborate glass. European Scientiic Journal. 2013;9(18):83-92.
20. Sindhu S, Sanghi S, Agarwal A, Seth VP, Kishore N. Efect of
Bi2O3 content on the optical band gap, density and electrical
conductivity of MO•Bi2O3•B2O3 (M = Ba, Sr) glasses. Materials Chemistry and Physics. 2005;90(1):83-89.
21. Szu SP, Lin CY. AC impedance studies of copper doped silica glass. Materials Chemistry and Physics. 2003;82(2):295-300. 22. Murugasen P, Shajan D, Sagadevan S. A study of structural,
optical and dielectric properties of Eu2O3 doped borate glass. International Journal of Physical Sciences. 2015;10(20):554-561. 23. Shajan D, Murugasen P, Sagadevan S. Analysis on the structural,