DOI: http://dx.doi.org/10.1590/1516-1439.298214
Materials Research. 2015; 18(2): 288-291 © 2015
*e-mail: [email protected]
1. Introduction
Barium titanate (BaTiO3) is a traditional piezoelectric material that has been proposed for use in the microelectronics industry after studies revealed that its properties can be changed by controlling grain size1,2 and by doping with rare earth ions3. EMR spectroscopy is a convenient method for studying these impurities within the BaTiO3 structure. In this work, we study the effect of gadolinium concentration on the EMR spectrum of Gd3+ in polycrystalline BaTiO
3. The importance of this investigation is twofold. First, once the effects of gadolinium concentration on the spectrum are known, it becomes possible to use EMR results to study, rapidly and non-destructively, the crystallinity and degradation of BaTiO3. Second, knowledge of the range of the exchange interaction between Gd3+ ions is essential for a better understanding of the magnetic properties of gadolinium-doped barium titanate.
1.1. Crystal structure of strontium titanate
At room temperature, barium titanate (BaTiO3) crystallizes in the perovskite structure4 conforming to the space group P4mm(99). There are two distinct cation sites, one with twelve nearest neighbor oxygen ions, occupied by Ba atoms, and one with six nearest neighbor oxygen atoms, occupied by Ti atoms.
1.2. EMR of barium doped barium titanate
Analysis of the EMR spectrum of single-crystal gadolinium doped barium titanate5 shows that trivalent gadolinium ions substitutionally replace strontium ions in the lattice. The spectrum can be itted to the Hamiltonian
2,0 2,0 4,0 4,0 H.S
= + +
H gβ b Y b Y (1)
w i t h g = 1 . 9 9 5 , b2 , 0 = −293,6 × 10⁻⁴c m−1 a n d b4,0 = 4.0 × 10⁻⁴ cm–1.
1.3. EMR of dilute solid solutions
The theory of dipolar broadening in diluted solid solutions was developed in Kittel & Abrahams6 and extended in de Biasi & Fernandes7 to take exchange interactions into account. The main results of the theory can be summarized as follows:
(I) the lineshape is a truncated Lorentzian;
(II) the peak-to-peak irst derivative linewidth may be expressed as
ΔHPP = ΔH0 + ΔHd = ΔH0 + C1fe (2) where ΔH0 is the intrinsic linewidth, ΔHD is the dipolar broadening, C1 is a constant and fE is the concentration of substitutional ions of the paramagnetic impurity not coupled by the exchange interaction, which can be expressed as
c
( ) e= (1− )
z r
f f f (3)
where f is the impurity concentration, z(rC) the number of cation sites included in a sphere of radius rC, and rC the effective range of the exchange interaction. (III) the intensity of the absorption line is
I = C2fe (4)
where C2 is a constant.
The analysis above is based on the assumption of two ion populations, one with no exchange, which is responsible for the normal paramagnetic line, and another which, due to exchange, is either EPR silent (if the coupling is antiferromagnetic) or gives rise to a much broader line (if the coupling is ferromagnetic).
Electron Magnetic Resonance of Diluted Solid Solutions of Gd
3+in BaTiO
3Ronaldo Sergio de Biasia*, Maria Lúcia Netto Grillob
aSeção de Engenharia Mecânica e de Materiais, Instituto Militar de Engenharia – IME,
CEP 22290-270, Rio de Janeiro, RJ, Brazil
bInstituto de Física, Universidade do Estado do Rio de Janeiro – UERJ,
CEP 20550-013, Rio de Janeiro, RJ, Brazil
Received: May 26, 2014; Revised: February 20, 2015
Electron magnetic resonance (EMR) spectra of gadolinium-doped barium titanate (BaTiO3) have been studied at room temperature for gadolinium concentrations between 0.20 and 2.00 mol%. The results suggest that the Gd3+ ions occupy substitutional sites, replacing the Ba2+ ion, that the electron magnetic resonance linewidth increases with increasing gadolinium concentration, and that the range of the exchange interaction between Gd3+ ions is about 0.98 nm, of the same order as that of the same ion in other host lattices, such as strontium titanate (SrTiO3), strontia (SrO), quicklime (CaO), magnesia (MgO) and zircon (ZrSiO4). The fact that the electron magnetic resonance linewidth of the Gd3+ ion increases, regularly and predictably, with Gd concentration, shows that the Gd3+ ion can be used as a probe to study, rapidly and non-destructively, the crystallinity and degradation of BaTiO3.
2015; 18(2) Electron Magnetic Resonance of Diluted Solid Solutions of Gd3+ in BaTiO 289
3
2. Experimental Procedure and Results
2.1. Sample preparation
The gadolinium doped samples used in this study were prepared from high purity BaTiO3(Aldrich, 99,9%) and Gd2O3(Reacton, 99.99%) powders by grinding them together and then iring the mixture for 24 h at 1200 °C in air. The gadolinium concentrations and reagent masses are shown in Table 1. Actual Gd concentrations were determined using the Inductively Coupled Plasma (ICP) technique. Room temperature X-ray diffraction patterns (Figure 1) of the samples matched, within experimental error, the pattern8 of BaTiO3. No other phases were detected.
2.2. Magnetic resonance measurements
All magnetic resonance measurements were performed at room temperature and 9.50 GHz using a Varian E-12 spectrometer with 100 kHz ield modulation. The microwave power was 10mW and the modulation amplitude was 1 mT. The magnetic ield was calibrated with an NMR gaussmeter.
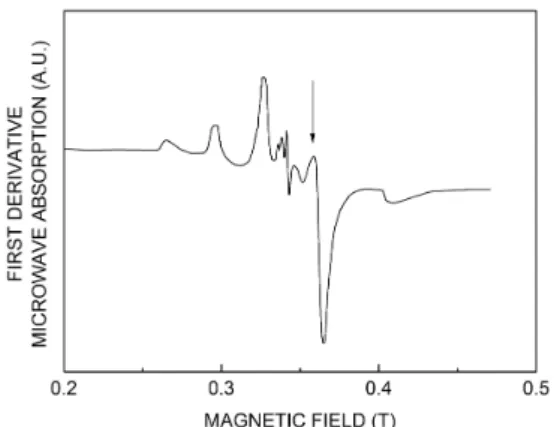
The spectrum of a sample of BaTiO3 doped with 0.6 mol% Gd is shown in Figure 2. It closely matches the spectrum reported by Takeda & Watanabe9 for powdered Gd-doped BaTiO3. In principle, linewidth data can be extracted from any of the lines in the powder spectrum. We chose the line indicated by an arrow in Figure 2. The results are shown in Table 2 for several gadolinium concentrations.
3. Discussion
The theoretical concentration dependence of the peak-to-peak linewidth ΔHpp, given by Equation 2, is shown in Figure 3 for ΔH0 = 3.3 mT and eight different ranges of the exchange interaction. The values of rC and z(rC) for the irst eight coordinate spheres are listed in Table 3, where n is the number of the order of each coordinate sphere (n = 1 includes no neighboring sites, and so on). The values of z(rC) are those appropriate to the lattice of BaTiO3; the values of rC were calculated from the lattice constants at room temperature as measured by X-ray diffraction8, a = 0.3990 nm, c = 0.4035 nm. The experimental data are also shown in
Table 1. Gadolinium concentrations and reagent masses for the samples used in this work.
f(mol%)
m
Gd O2 3 (g)m
BaTiO3 (g)0.20 0.0031 1.9969
0.40 0.0062 1.9938
0.60 0.0093 1.9907
0.80 0.0125 1.9875
1.00 0.0156 1.9844
1.50 0.0234 1.9766
2.00 0.0312 1.9688
Figure 1. X-ray diffraction pattern of a BaTiO3 sample doped with
0.2 mol% Gd. The indices were taken from JCPDS no. 81-2203.
Table 2. Experimental results for the Gd3+-BaTiO
3 system
(T = 300 K, ν = 9.50 GHz).
f (mol%) ΔHpp (mT)
0.20 4.52
0.40 5.58
0.60 6.08
0.80 6.49
1.00 6.54
1.50 6.80
2.00 6.15
Figure 2. EMR spectrum of a BaTiO3 sample doped with 0.6 mol% Gd.
Figure 3. Concentration dependence of the peak-to-peak linewidth,
ΔHpp, in Gd-doped BaTiO3. The circles are experimental points; the
Biasi & Grillo
290 Materials Research
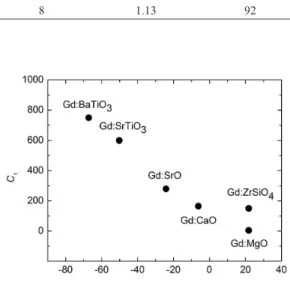
concentration, expressed by the parameter C1, from 4.5 for MgO to 750 for BaTiO3. In order to investigate the question further, we plot in Figure 4 the coeficient C1 of Equation 2 as a function of the difference Δr = rGd−rh, where rGd the ionic radius of Gd3+ and r
h is the ionic radius of the host lattice cation (the ionic radii were taken from Shannon15) for the Gd-doped compounds shown in Table 4. The results suggest that C1 changes, in a systematic way, with the ionic radius misit Δr.
4. Conclusions
The study of the EMR spectrum of Gd3+ in BaTiO 3 shows that the peak-to-peak linewidth increases with Gd concentration. This increase is attributed to dipolar broadening and is consistent with a model based on the exchange interaction and on the misit between the ionic radii of the doping impurity and the host cation.
The fact that the linewidth increases in a predictable way with Gd concentration suggests that gadolinium can be used as a probe to study the crystallinity and degradation of barium titanate.
Acknowledgements
The authors thank CNPq for inancial support. Figure 4. Dependence of the coeficient C1 on the ionic radius misit
Δr = rGd – rh. Gd:ZrSiO4 data are from de Biasi & Grillo10; Gd:SrTiO 3
data are from de Biasi & Grillo11; Gd:SrO data are from de Biasi
& Grillo12; :CaO data are from de Biasi & Grillo13; Gd:MgO data
are from de Biasi & Grillo14.
Table 3. Values of rc and z(rc) for BaTiO3.
n rc (nm) z(rc)
1 0.00 0
2 0.40 6
3 0.56 18
4 0.69 26
5 0.80 32
6 0.89 56
7 0.98 80
8 1.13 92
Table 4. Values of n, rC, z(rC), a, C1 and Δr for the Gd3+ ion in
several host lattices.
Host n rc
(nm)
z(rc) a
(nm)
C1 Δr
(pm)
Reference
ZrSiO4 15 1.17 122 0.655 150 21.8 10
BaTiO3 7 0.98 80 0.399 750 −67.2 this work
SrTiO3 7 0.96 80 0.390 600 −50.2 11
SrO 7 0.89 86 0.516 280 −24.2 12
CaO 6 0.83 86 0.481 165 −6.2 13
MgO 5 0.60 54 0.421 4.5 21.8 14
References
1. Huan Y, Wang X, Fang J and Li L. Grain size effect on
piezoelectric and ferroelectric properties of BaTiO3 ceramics.
Journal of the European Ceramic Society. 2014; 34(5):1445-1448. http://dx.doi.org/10.1016/j.jeurceramsoc.2013.11.030.
2. Gong H, Wang X, Zhang S, Wen H and Li L. Grain size effect on
electrical and reliability characteristics of modified fine-grained
BaTiO3 ceramics for MLCCs. Journal of the European Ceramic
Society. 2014; 34(7):1733-1739. http://dx.doi.org/10.1016/j. jeurceramsoc.2013.12.028.
3. Glinchuk MD, Bykov IP, Kornienko SM, Laguta VV, Slipenyuk AM, Bilous AG, V’yunov OI and Yanchevskii OZ. Influence of
impurities on the properties of rare-earth-doped barium-titanate ceramics. Journal of Materials Chemistry. 2000; 10:941. http:// dx.doi.org/10.1039/a909647g.
4. Kwei GH, Lawson AC, Billinge SJL and Cheong SW. Structures
of the ferroelectric phases of barium titanate. Journal of Physical Chemistry. 1993; 97(10):2368-2377. http://dx.doi.org/10.1021/ j100112a043.
5. Rimai L and deMars GA. Electron paramagnetic resonance of trivalent gadolinium ions in strontium and barium titanates.
Physical Review. 1962; 127(3):702-710. http://dx.doi.org/10.1103/ PhysRev.127.702.
6. Kittel C and Abrahams E. Dipolar broadening of magnetic resonance lines in magnetically diluted crystals. Physical Review. 1953; 90(2):238-239. http://dx.doi.org/10.1103/PhysRev.90.238.
7. de Biasi RS and Fernandes AAR. The ESR linewidth of dilute
solid solutions. Journal of Physics C: Solid State Physiscs.
1983; 16(28):5481-5489. http://dx.doi.org/10.1088/0022-3719/16/28/015.
Figure 3. The experimental results it the theoretical curve for n = 7, which corresponds, according to Table 3, to a range rC = 0.98 nm for the exchange interaction.
In Table 4 we show the pertinent parameters for the dipolar broadening ΔHD of the Gd3+ FMR spectrum in BaTiO
2015; 18(2) Electron Magnetic Resonance of Diluted Solid Solutions of Gd3+ in BaTiO 291
3
8. Kwei GH, Lawson AC and Billinge SJL. Structures of the
Ferroelectric Phases of Barium Titanate. Journal of Physical
Chemistry. 1993; 97(10):2368-2377. http://dx.doi.org/10.1021/ j100112a043.
9. Takeda T and Watanabe A. Two sets of E. S. R. of Gd3+
in BaTiO3 ceramic semiconductor. Journal of the Physical
Society of Japan. 1964; 19(9):1742. http://dx.doi.org/10.1143/ JPSJ.19.1742.
10. de Biasi RS and Grillo MLN. Influence of gadolinium
concentration on the EMR spectrum of Gd3+ in zircon. Physica
B: Condensed Matter. 2009; 404(20):3368-3370. http://dx.doi. org/10.1016/j.physb.2009.05.016.
11. de Biasi RS and Grillo MLN. Electron magnetic resonance of diluted solid solutions of Gd3+ in SrTiO3. Materials Chemistry
and Physics. 2011; 130(1-2):409-412. http://dx.doi.org/10.1016/j. matchemphys.2011.07.002.
12. de Biasi RS and Grillo MLN. Influence of gadolinium
concentration on the ESR spectrum of Gd3+ in SrO. Journal
of Alloys and Compounds. 2002; 337(1-2):30-32. http://dx.doi. org/10.1016/S0925-8388(01)01941-7.
13. de Biasi RS and Grillo MLN. Influence of gadolinium
concentration on the ESR spectrum of Gd3+ in CaO. Solid
State Communications. 2002; 124(4):131-133. http://dx.doi. org/10.1016/S0038-1098(02)00479-9.
14. de BiasiRS and Grillo MLN. Influence of gadolinium
concentration on the ESR spectrum of Gd3+ in MgO. Journal
of Physics and Chemistry of Solids. 2004; 64(6):1207-1209. http://dx.doi.org/10.1016/j.jpcs.2003.12.003.
15. Shannon RD. Revised effective ionic radii and systematic studies of interatomic distances in halides and chalcogenides.