Authors
Maria Valéria Pavan1 Glauco Eduardo Saura2 Henri Augusto Korkes2 Karen Moreno Nascimento2 Nelson Domingues Madeira Neto2 Ronaldo Dávila2 Cibele Isaac Saad Rodrigues2 Fernando Antonio Almeida3
1Unidade de Hipertensão e Diabetes do Hospital Santa Lucinda da Pontifícia Universidade Católica de São Paulo – PUC/SP. 2Faculdade de Ciências Médicas e da Saúde da PUC/SP.
3Cornell University Medical College – USA; Faculdade de Ciências Médicas e da Saúde da PUC/SP.
Submitted on: 08/19/2011 Approved on: 10/07/2011
Correspondence to:
Fernando Antonio de Almeida Rua Ilda do Amaral Cussiol, 155 – Isaura
Sorocaba – SP – Brazil Zip code 18047-594 E-mail: [email protected]
Financial support: Programa Institucional de Iniciação Cientíica da PUC/ SP-CNPq.
This study was undertaken at the Faculdade de Ciências Médicas e da Saúde da PUC/SP.
The authors report no conlict of interest.
R
ESUMOIntrodução: Um dos maiores desafios no manejo da hipertensão arterial é o ad-equado controle pressórico. Para se alcan-çar esse objetivo tem se difundido a medi-da residencial medi-da pressão arterial (MRPA) com aparelhos automáticos. Entretanto, parte da comunidade médico-científica ainda discute sua validade, acreditando que as medidas pressóricas domiciliares podem ser incorretas. Objetivo: Avaliar a correspondência entre as medidas si-multâneas da pressão arterial (PA) pelo método auscultatório convencional e mé-todo digital automático, habitualmente utilizado na MRPA. Métodos: Através de uma conexão em “Y” acoplamos um manguito a um aparelho digital au-tomático validado (ONROM 705IT) e a um esfigmomanômetro de coluna de mer-cúrio, permitindo aferir simultaneamente a PA pelos dois métodos. Determinamos a PA em 423 indivíduos (normotensos e hipertensos), adequando o tamanho do manguito à circunferência braquial.
Resultados: Os valores representam mé-dia ± desvio padrão (DP) (valores mínimo-máximo): Idade 40,8 ± 16,3 anos (18–92), circunferência braquial 28,2 ± 3,7 cm (19–42), PA sistólica (PAS) auscultatório 127,6 ± 22,8 mmHg (69–223), PAS au-tomático 129,5 ± 23,0 mmHg (56–226),
PA diastólica (PAD) auscultatório
79,5 ± 12,6 mmHg (49–135), PAD
au-tomático 79,0 ± 12,6 mmHg (48–123). A
diferença média da PAS entre os dois méto-dos foi de 1,9 mmHg (-15 a +19) e a difer-ença da PAD de 0,5 mmHg (-19 a +13). Os índices de correlação de Pearson entre os métodos são para a PAS (r = 0,97), e PAD (r = 0,91). A análise de Bland-Altman mostrou concordância clinicamente acei-tável entre os métodos. Conclusão: A PA
A
BSTRACTIntroduction: One of the biggest
chal-lenges in the management of hyperten-sion is adequate blood pressure (BP) control. To achieve this goal, home blood pressure measurement (HBPM) with automated devices has been en-couraged. However, part of the medi-cal community still disputes its validity, believing that HBPM may lead to in-correct readings. Objective: To evalu-ate the correspondence between the simultaneous measurements of BP with the auscultatory method and an oscil-lometric digital method, commonly used in HBPM. Methods: BP was de-termined simultaneously in 423 indi-viduals (normotensive and hyperten-sive) with a validated automated digital device (ONROM 705IT) and with the auscultatory method with a mercury sphygmomanometer. Both devices were connected through a Y-shaped connection to a cuff whose size was adjusted to the arm circumference.
Results: The values represent mean ±
SD (minimum-maximum values): age 40.8 ± 16.3 years (18–92), arm circum-ference 28.2 ± 3.7 cm (19–42), systolic BP (SBP) auscultatory 127.6 ± 22.8 mmHg (69–223), SBP automated 129.5 ± 23.0 mmHg (56–226), diastolic BP (DBP) ausculta-tory 79.5 ± 12.6 mmHg (49–135) DBP automated 79.0 ± 12.6 mmHg (48–123). The mean difference in SBP between the two methods was 1.9 mmHg (-15 to +19) and 0.5 mmHg for DBP (-19 to +13). The Bland-Altman analysis showed clinically acceptable agreement be-tween the methods. Conclusion: BP measured with the automated method closely mirrors that determined with the conventional auscultatory method
Similarity between blood pressure values assessed by
auscultatory method with mercury sphygmomanometer
and automated oscillometric digital device
I
NTRODUCTIONHypertension is the most prevalent disease of the adult, its impact on the cardiovascular and renal sys-tems, sometimes devastating, being proportional to blood pressure (BP) levels.1,2 Most complications are
due to inadequate BP control, something observed even in countries with high development indices.3
Auscultatory measurement with the sphygmoma-nometer is the most widespread method for indirect BP determination, having a high concordance level with the direct intra-arterial method.4 Yet, procedure
standardization must be observed if BP values are to be valid.5,6 Guidelines include: 5-10 minute patient`s
rest before measurement; cuff-size adequate to the patient`s arm circumference and positioned 2-3 cm above the antecubital fossa; positioning of the cen-tral portion of the rubber bladder on the brachial artery; positioning of the upper limb at the heart`s level; focusing of the examiner`s eyes on the mercury column level; positioning of the Bell of the stetho-scope on the brachial artery and; 1-2 minute inter-val between measurements. Training is then neces-sary before reliable BP measurements are obtained with the auscultatory method. The use of aneroid sphygmomanometers, which are easily decalibrated, is a common source of error with the auscultatory method.7,8
Oscillometric BP determination with automated digital devices has become more frequent. In spite of its limitations, the method has increasingly sub-stituted for the traditional auscultatory one, chiefly when the patient or a family member is responsible for home blood pressure measurement (HBPM).9
Besides being promoted as an instrument to help reach adequate BP control, HBPM is an excellent warning strategy, helping with patient education and guiding the adjustment of therapeutic regi-mens. Several studies have demonstrated the ben-efits of HBPM compared with casual ambulatory BP measurements, making the diagnosis of hyper-tension more precise and favoring BP control, with consequent lower disease-related morbidity and
mortality.10,11 In spite of great technological
advanc-es and the high acceptability of automated digital devices, some researchers still dispute HBPM valid-ity, believing that values obtained outside a medical environment are prone to error.12-14
Because of controversy surrounding the preci-sion and effectiveness of the automated oscillometric method, the purpose of this study was to compare measurements simultaneously obtained, through use of the same cuff, with the mercury sphygmomanom-eter auscultatory method and the automated digital method.
M
ATERIALAND METHODSSAMPLE SELECTION
The individuals who composed the sample were adults of all ages, deliberately selected and matched for sex: normotensives, hypertensives and those with comorbidities known to alter BP, such as chronic re-nal disease and atherosclerosis. They were extracted from the population (and their caregivers) being fol-lowed up at facilities with mentorship provided by clinicians-educators: basic health units, specialty am-bulatories and dialysis units. The final sample, with the whole range of BP levels, was thought to better represent the general population.
BLOODPRESSUREDETERMINATION
BP was measured in the non-dominant upper limb of the sitting patient, after a 5-minute rest. The arm circumference was measured for adequacy of the cuff size. Two BP measurements were obtained with 1-minute interval between them, with recording of the systolic blood pressure (SBP) and diastolic blood pres-sure (DBP) with both methods. The values shown correspond to the means of the two measurements, which were obtained according to the VI Arterial Hypertension Brazilian Guidelines.6
SBP and DBP were simultaneously measured with the auscultatory and oscillometric (auto-mated digital) methods. For this purpose, we de-signed a system through which an automated digital
aferida pelo método digital automático apresenta boa concordância com o método auscultatório convencio-nal, devendo ser usada no auxílio do diagnóstico e controle da hipertensão arterial (HA).
Palavras-chave: Pressão Arterial. Determinação da Pressão Arterial. Monitores de Pressão Arterial. Hipertensão.
and should be used to improve the diagnosis and control of hypertension.
Keywords: Blood Pressure. Blood Pressure
device (OMRON 705IT, validated by the British Hypertension Society)15 and a newly-calibrated
mer-cury sphygmomanometer were jointly connected to a single cuff, through a Y-shaped connection. The cuff insufflation and deflation rates were determined by the automated device, deflation happening at an approximately 2mmHg/s rate.
The procedure was performed by two independent observers. While one measured the BP according to the auscultatory method, recording the values ob-tained, the other observer recorded the values shown by the automated device, so that bias was avoided. Age, arm circumference, abdominal circumference and the presence of associated diseases were also re-corded. All observers (MAP, GES, HAK, KMN and NDMN) were trained by the main researcher and study organizer (FAA) for BP determination by the auscultatory method and methodology adequacy, during several training sessions that preceded the start of the study.
ETHICALAND STATISTICALFEATURES
The study protocol and the informed consent form were approved by the Committee of Research Ethics of the Faculdade de Ciências Médicas e da Saúde of the PUC/SP. Before undergoing any procedure, the participants were informed on the study`s general characteristics, main objectives and method.
Sample size was based on a pilot study of 138 individuals, considering an α error of 5% and a
β error of 20% for an estimate of a clinically rel-evant difference of 4 mmHg between the methods. Minimum sample size was estimated to include 403 individuals.
Student`s t test was used to assess whether there were significant differences between the SBP and DBP values obtained with the two methods. Pearson`s coefficient was used to assess correlation between SBP and DBP measurements obtained with the two methods and between the SBP and DBP and other measurable continuous variables. The Bland-Altman method was used to assess agreement be-tween the SBP and DBP values obtained with the two methods in relation to the difference between the two methods.16 The Z test was used for
propor-tion comparison. Minimum significance for the null hypothesis (α error) was set at 5%.
R
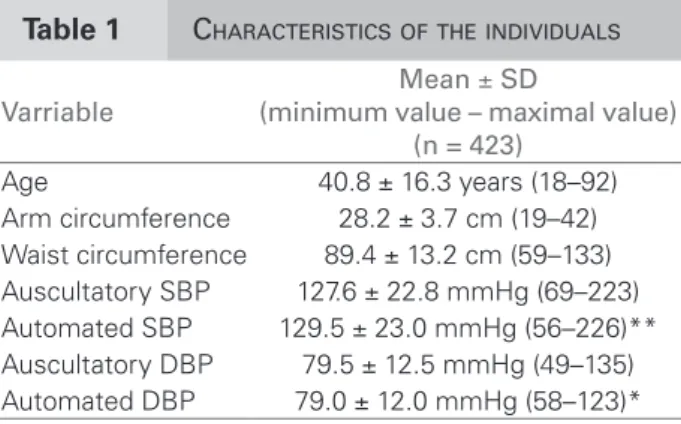
ESULTSData were obtained from 423 individuals whose characteristics allowed their inclusion in the
study. Table 1 shows the means, standard devia-tion (SD) and maximal and minimum values for age, arm circumference, abdominal circumference and SBP and DBP as measured with the two meth-ods. SBP values with the automated method were significantly higher than those obtained with the auscultatory method, being 129.5 ± 23.0 mmHg and 127.6 ± 2.8 mmHg, respectively (p < 0.01). Conversely, DBP values were significantly lower with the automated method, in comparison with the auscultatory one, being 79.0 ± 12.0 mmHg and 79.5 ± 12.5 mmHg, respectively (p < 0.05).
Figure 1 shows SBP (Figure 1A) and DBP (Figure 1B) in graphs of frequency distribution, com-paring the values obtained with the auscultatory and automated values. It is noteworthy that there was a Gaussian distribution of the results in both methods.
The means of the differences of SBP and DBP be-tween the automated and auscultatory methods were calculated. The mean of the differences and the mini-mum and maximal values of the differences between the two methods, for SBP and DBP were 1.9 mmHg (-15 to +19) and -0,6 mmHg (-19 to +13), respec-tively. Therefore, in the 423 study individuals, the two methods of BP determination did not reach the clinically relevant 4 mmHg minimum difference, as defined on the decision on the sample size.
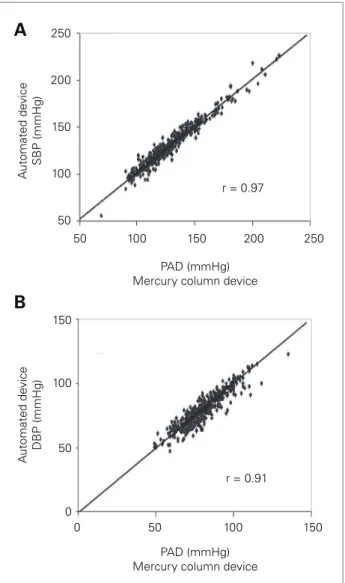
Pearson`s correlation coefficients between the val-ues determined by the auscultatory and automated digital methods for SBP and DBP were 0.97 and 0.91, respectively (p < 0.001).
Figure 2 shows a dispersion graph with the cor-respondence between BP levels determined by the two methods, highlighting the proximity of the points to the identity line, thus depicting a visual representation of the correspondence of the values obtained with the two methods.
Table 1 CHARACTERISTICSOFTHEINDIVIDUALS
SD: standard deviation; SBP: systolic blood pressure; DBP: diastolic blood pressure.*p < 0.05; **p < 0.01.
Varriable
Mean ± SD
(minimum value – maximal value) (n = 423)
The Bland-Altman method was used to analyze the agreement between the BP values determined with the two methods (Figure 3). As can be seen, when plotting the mean differences between the BP values obtained with the automated method minus the ones obtained with the auscultatory method against the mean SBP or DBP values determined with the two methods, less than 1% of the points fall beyond the limit of two standard-deviations above and below bias, whose value is also close to zero. For SBP (Figure 3A) bias was +1.9 mmHg, with an upper limit of +16.9 mmHg (95% CI; +16.3 to +17.6 mmHg) and lower limit of -13.1 mmHg
(95% CI; -12.4 to -13.7 mmHg). For DBP (Figure 3B) bias was -0.6 mmHg, with an upper limit of +14.9 mmHg (95% CI; +14.2 to +15.5 mmHg) and lower limit of -16.0 mmHg (95% CI; -15,3 to -16,6 mmHg). It should also be noted that the differences did not increase or decrease at extreme SBP or DBP values.
Although positive correlation indices were found between abdominal circumference and SBP (r = 0.32, p < 0.01); between abdominal circumference and DBP (r = 0.26, p < 0.01); between age and SBP (r = 0.44, p < 0.01) and between age and DBP (r = 0.23, p < 0.01), we did not detect significant BP differences between
Auscultatory
Number of individuals
Number of individuals
Automated
Auscultatory
Automated
Distribution of diastolic blood pressure (mmHg) 120
100
80
60
40
20
0
90
80
70
60
50
40
30
20
10
<50 50- 55- 60- 70 75- 80- 85- 90 95 100-105 110+ 54 59 64 69 74 79 84 89 94 99 104 109
65-Distribution of systolic blood pressure (mmHg) <80 80- 90- 110-120-130-140-150-160-170- 180+
89 99 109 119 129 139 149 159 169 179
100-0
B
A
Figure 1. Distribution of systolic blood pressure (A) and diastolic blood pressure (B) of individuals assessed with the auscultatory method (gray bars) and automated method (black bars). Notice the wide range of blood pressure values, whocse distribution is Gaussian for both methods.
Figure 2. Correspondence between systolic blood pressure (A) and diastolic blood pressure (B) measured with the mercury sphygmomanometer auscultatory method and oscillometric automated method. Notice how the values are close to the identity line, SBP = systolic blood pressure; DBP = diastolic blood pressure.
250
200
150
100
50
50 100 150 200
r = 0.97
B
A
r = 0.91
250
0 50
0 50 100 150
PAD (mmHg) Mercury column device
PAD (mmHg) Mercury column device
A
utomated de
vice
DBP (mmHg)
A
utomated de
vice
SBP (mmHg)
100 150
the two methods, either for male/female comparison or concerning the arm circumference or the age of the participants.
As for the possibility of diagnosing hypertension (SBP ≥ 140 mmHg and/or DBP ≥ 90 mmHg) with each one of the two methods, based on two consecu-tive BP measurements as performed in this study, hy-pertension would be diagnosed in 128 individuals (30.3% of the sample) with the auscultatory method and in 122 individuals (28.8% of the sample) with the automated method, with diagnostic disagree-ment in only 8 individuals (1.9%), which was not statistically significant.
D
ISCUSSIONThis study showed that BP values obtained with the automated digital method agreed with the val-ues obtained with the conventional mercury sphyg-momanometer auscultatory method, strengthening the safety, reliability and usefulness of the former for hypertension diagnosis and treatment adequacy. Although our data agree with national and interna-tional HBPM guidelines,5,6,10,11 they differ from those
of a study which used a similar method to assess a predominantly elderly population followed up at a cardiology outpatient facility.14 The authors of the
latter valued the statistically significant difference of +2.1 to +2.3 mmHg between the automated method and the auscultatory one, with larger differences in in-dividuals aged 65 years or above.14 We also observed
statistically significant differences of +1.9 mmHg for SBP and -0.6 mmHg for DBP. However, taking into account all the clinical benefits of HBPM (see dis-cussion below), we chose to deem these statistically significant differences clinically irrelevant. Likewise, even with occasional differences of up to 19 mmHg between the methods, it is statistically known that as the number of measurements increases (and repeated measurements are advised for HBPM) the values (dif-ferences) tend to show a regression to the mean.
Validated automated machines for BP reading in the arm, with memory capacity, are the most widely recommended devices for HBP monitoring, as they are easy to handle and reliable.10,11 Although there is
still reluctance on the part of the medical community to indicate HBPM, its use has become more common, the strategy being now an important source of infor-mation on BP levels.9,17,18 Furthermore, HBPM has
high acceptability by the patients.19 The increasing
use of HBPM may improve the quality of hyperten-sion diagnosis and control, a desirable scenario for a disease that is silent and has high rates of cardiovas-cular and renal complications.10,11,17 There is extensive
evidence for the role of emotional, hormonal and en-vironmental factors in the important oscillations BP values may experiment. A classical example is the white coat hypertension and the white coat phenome-non, present in 10–20% of the individuals, which may confound diagnosis and treatment adequacy.17,20,21
Because it allows several measurements, HBPM mini-mizes BP variability, helping to more safely confirm or exclude hypertension, being highly indicated for the diagnosis of white coat hypertension.10,11,18,20,21
Furthermore, recent data have indicated that the use of automated machines for BP determination in the Figure 3. Bland-Altman analysis of concordance
between systolic blood pressure (SBP) (A) and diastolic blood pressure (DBP) (B) obtained with the two methods.
50 100 150 200
B
A
-2SD Bias +2SD -2SD Bias +2SD
250
40 60 80 -25
-20 -15 -10 -5 0 5 10 15 20 25 -25 -20 -15 -10 -5 0 5 10 15 20 25
Diastolic Blood Pressure (mmHg) Systolic Blood Pressure (mmHg)
A
utomated method minus auscult
ator
y method
(mmHg)
A
utomated method minus auscult
ator
y method
(mmHg)
100 120 140
physician`s office also reduces the rates of the white coat phenomenon.22
Small differences in the BP greatly impact on the development of hypertension complications, mainly as this is a highly prevalent public health hazard.2,23
A systematic review, followed by a recent meta-anal-ysis, has shown that HBPM counters clinical inertia, leading the physician to more strictly seek the thera-peutic goal, resulting in better BP control.24 Another
meta-analysis of 18 randomized, controlled trials ob-served that in hypertensive patients followed up at health units, the use of HBPM, compared with casual BP measurements, resulted in better BP control and higher likelihood of reaching adequate BP targets, strengthening the applicability of the method to the management of hypertension.23
Prospective studies have shown that HBPM val-ues were better correlated to cardiovascular and re-nal complications when compared to ambulatory measurements.26-31
In conclusion, we observed that BP values ob-tained with the automated digital method have good agreement with those obtained with the conventional auscultatory method. The results indicate that HBPM with validated digital devices should be encouraged as a strategy to help with BP control and increase the treatment compliance of hypertensive patients. We thus hope that this simple and practical method for HBPM can better control hypertension, thus reducing the devastating scale of its complications.
A
CKNOWLEDGEMENTSGlauco Eduardo Saura, Henri Augusto Korkes and Karen Moreno Nascimento were recipients of a schol-arship of the Programa Institucional de Iniciação Científica of the PUC/SP-CNPq.
R
EFERENCES1. Kearney PM, Whelton M, Reynolds K, Muntner P, Whelton PK, He J. Global burden of hypertension: analysis of worldwide data. Lancet 2005;365:217-23. 2. Lewington S, Clarke R, Qizilbash N, Peto R, Collins
R. Prospective studies collaboration. Age-specific relevance of usual blood pressure to vascular mortality: a meta-analysis of individual data for one million adults in 61 prospective studies. Lancet 2002;360:1903-13.
3. Chobanian AV. The hypertension paradox: more uncontrolled disease despite improved therapy. N Engl J Med 2009;361:878-87.
4. Grattinger WF, Lipson JL, Cheung DG, Weber MA. Validation of portable noninvasive blood pressure monitoring devices: comparisons with intra-arterial
and sphygmomanometer measurement. Am Heart J 1988;116:1155-60.
5. Mancia G, De Backer G, Dominiczak A, et al. 2007 Guidelines for the management of arterial hypertension: the task force for the management of arterial hypertension of the European Society of Hypertension (ESH) and of the European Society of Cardiology (ESC). J Hypertens 2007;25:1105-87.
6. VI Diretrizes Brasileiras de Hipertensão Arterial. Sociedade Brasileira de Nefrologia, Sociedade Brasileira de Hipertensão e Sociedade Brasileira de Cardiologia. J Bras Nefrol 2010;32:1-64.
7. Coleman AJ, Steel SD, Ashworth M, Vowler SL, Shennan A. Accuracy of the pressure scale of sphygmomanometers in clinical use within primary care. Blood Press Monit 2005;10:181-8.
8. Greeff A, Lorde I, Wilton A, Seed P, Coleman AJ, Shennan AH. Calibration accuracy of hospital-based non-invasive blood pressure measuring devices. J Hum Hypertens 2010;24:58-63.
9. Yarows SA, Julius S, Pickering TG. Home blood pressure monitoring. Arch Intern Med 2000;160:1251-7. 10. III Diretrizes Brasileiras de Monitorização Residencial
de Pressão Arterial (MRPA) e V Diretrizes Brasileiras de Monitorização Ambulatorial da Pressão Arterial (MAPA). Rev Bras Hipertens 2011;18:18-25.
11. Parati G, Stergiou GS, Asmar R, et al. European Society of Hypertension practice guidelines for home blood pressure monitoring. J Hum Hypertens 2010;24:779-85.
12. Oltra MR, Vicente A, Vicente Lozano J, et al. Factors related to the differences in blood pressure values assessed by auscultatory or oscillometric methods. Med Clin (Barc) 2006;127:688-91.
13. Nelson D, Kennedy B, Regnerus C, Schweinle A. Accuracy of automated blood pressure monitors. J Dent Hyg 2008;82:35-5.
14. Landgraf J, Wishner SH, Kloner RA. Comparison of automated oscillometric versus auscultatory blood pressure measurement. Am J Cardiol 2010;106:386-8. 15. Coleman A, Freeman P, Steel S, Shennan A. Validation of the
Omron 705IT (HEM-759-E) oscillometric blood pressure monitoring device according to the British Hypertension Society protocol. Blood Press Monit 2006;11:27-32. 16. Bland JM, Altman DG. Statistical methods for
assessing agreement between two methods of clinical measurement. Lancet 1986;i:307-10.
17. Pickering TG, Hall JE, Appel LJ, et al. Recommendations for blood pressure measurement in humans and experimental animals: part 1: blood pressure measurement in humans: a statement for professionals from the Subcommittee of Professional and Public Education of the American Heart Association Council on High Blood Pressure Research. Circulation 2005;111:697-716. 18. Pickering TG. Measurement of blood pressure in and
out of the office. J Clin Hypertens 2005;7:123-9. 19. Little P, Barnett J, Barnsley L, Marjoram J,
Fitzgerald-Barron A, Mant D. Comparison of acceptability of and preferences for different methods of measuring blood pressure in primary care. BMJ 2002;325:258-9. 20. Pickering TG, James GD, Boddie C, Harshfield GA,
21. Kotsis V, Stabouli S, Toumanidis S, et al. Target organ damage in “white coat hypertension” and “masked hypertension”. Am J Hypertens 2008;21:393-9. 22. Myers MG, Godwin M, Dawes M, et al. Conventional
versus automated measurement of blood pressure in primary care patients with systolic hypertension: randomised parallel design controlled trial. BMJ 2011;342:d286.
23. Turnbull F. Blood pressure lowering treatment trialists’ collaboration. Effects of different blood-pressure-lowering regimens on major cardiovascular events: results of prospectively-designed overviews of randomised trials. Lancet 2003;362:1527-35.
24. Agarwal R, Bills JE, Hecht TJ, Light RP. Role of home blood pressure monitoring in overcoming therapeutic inertia and improving hypertension control: a systematic review and meta-analysis. Hypertension 2011;57:29-38. 25. Cappuccio FP, Kerry SM, Forbes L, Donald A. Blood pressure control by home monitoring: meta-analysis of randomised trials. BMJ 2004;329:145. BMJ, doi:10.1136/bmj.38121.684410.AE
26. Bobrie G, Chatellier G, Genes N, et al. Cardiovascular prognosis of “masked hypertension” detected by blood pressure self-measurement in elderly treated hypertensive patients. JAMA 2004;291:1342-9.
27. Sega R, Facchetti R, Bombelli M, et al. Prognostic value of ambulatory and home blood pressures compared with office blood pressure in the general population: follow-up results from the Pressioni Arteriose Monitorate e Loro Associazioni (PAMELA) study. Circulation 2005;111:1777-83.
28. Mancia G, Facchetti R, Bombelli M, Grassi G, Sega R. Long-term risk of mortality associated with selective and combined elevation in office, home, and ambulatory blood pressure. Hypertension 2006;47:846-53.
29. Ohkubo T, Imai Y, Tsuji I, et al. Home blood pressure measurement has a stronger predictive power for mortality than does screening blood pressure measurement: a population-based observation in Ohasama, Japan. J Hypertens 1998;16:971-5.
30. Fagard RH, Van Broeke C, Cort P. Prognostic significance of blood pressure measured in the office, at home and during ambulatory monitoring in older patients in general practice. J Hum Hypertens 2005;19:801-7. 31. Niiranen TJ, Hänninen MR, Johansson J, Reunanen